
Home › Research › How Long Do SSDs and Hard Drives Last? Failure Rates (2026)
Research data
How Long Do SSDs and Hard Drives Last? Drive Lifespan and Failure-Rate Statistics
How long SSDs and hard drives last and how often they fail: Backblaze's 1.36% a year, field studies, TBW ratings, external drives and the myths, sourced.
Key hard drive and SSD lifespan statistics
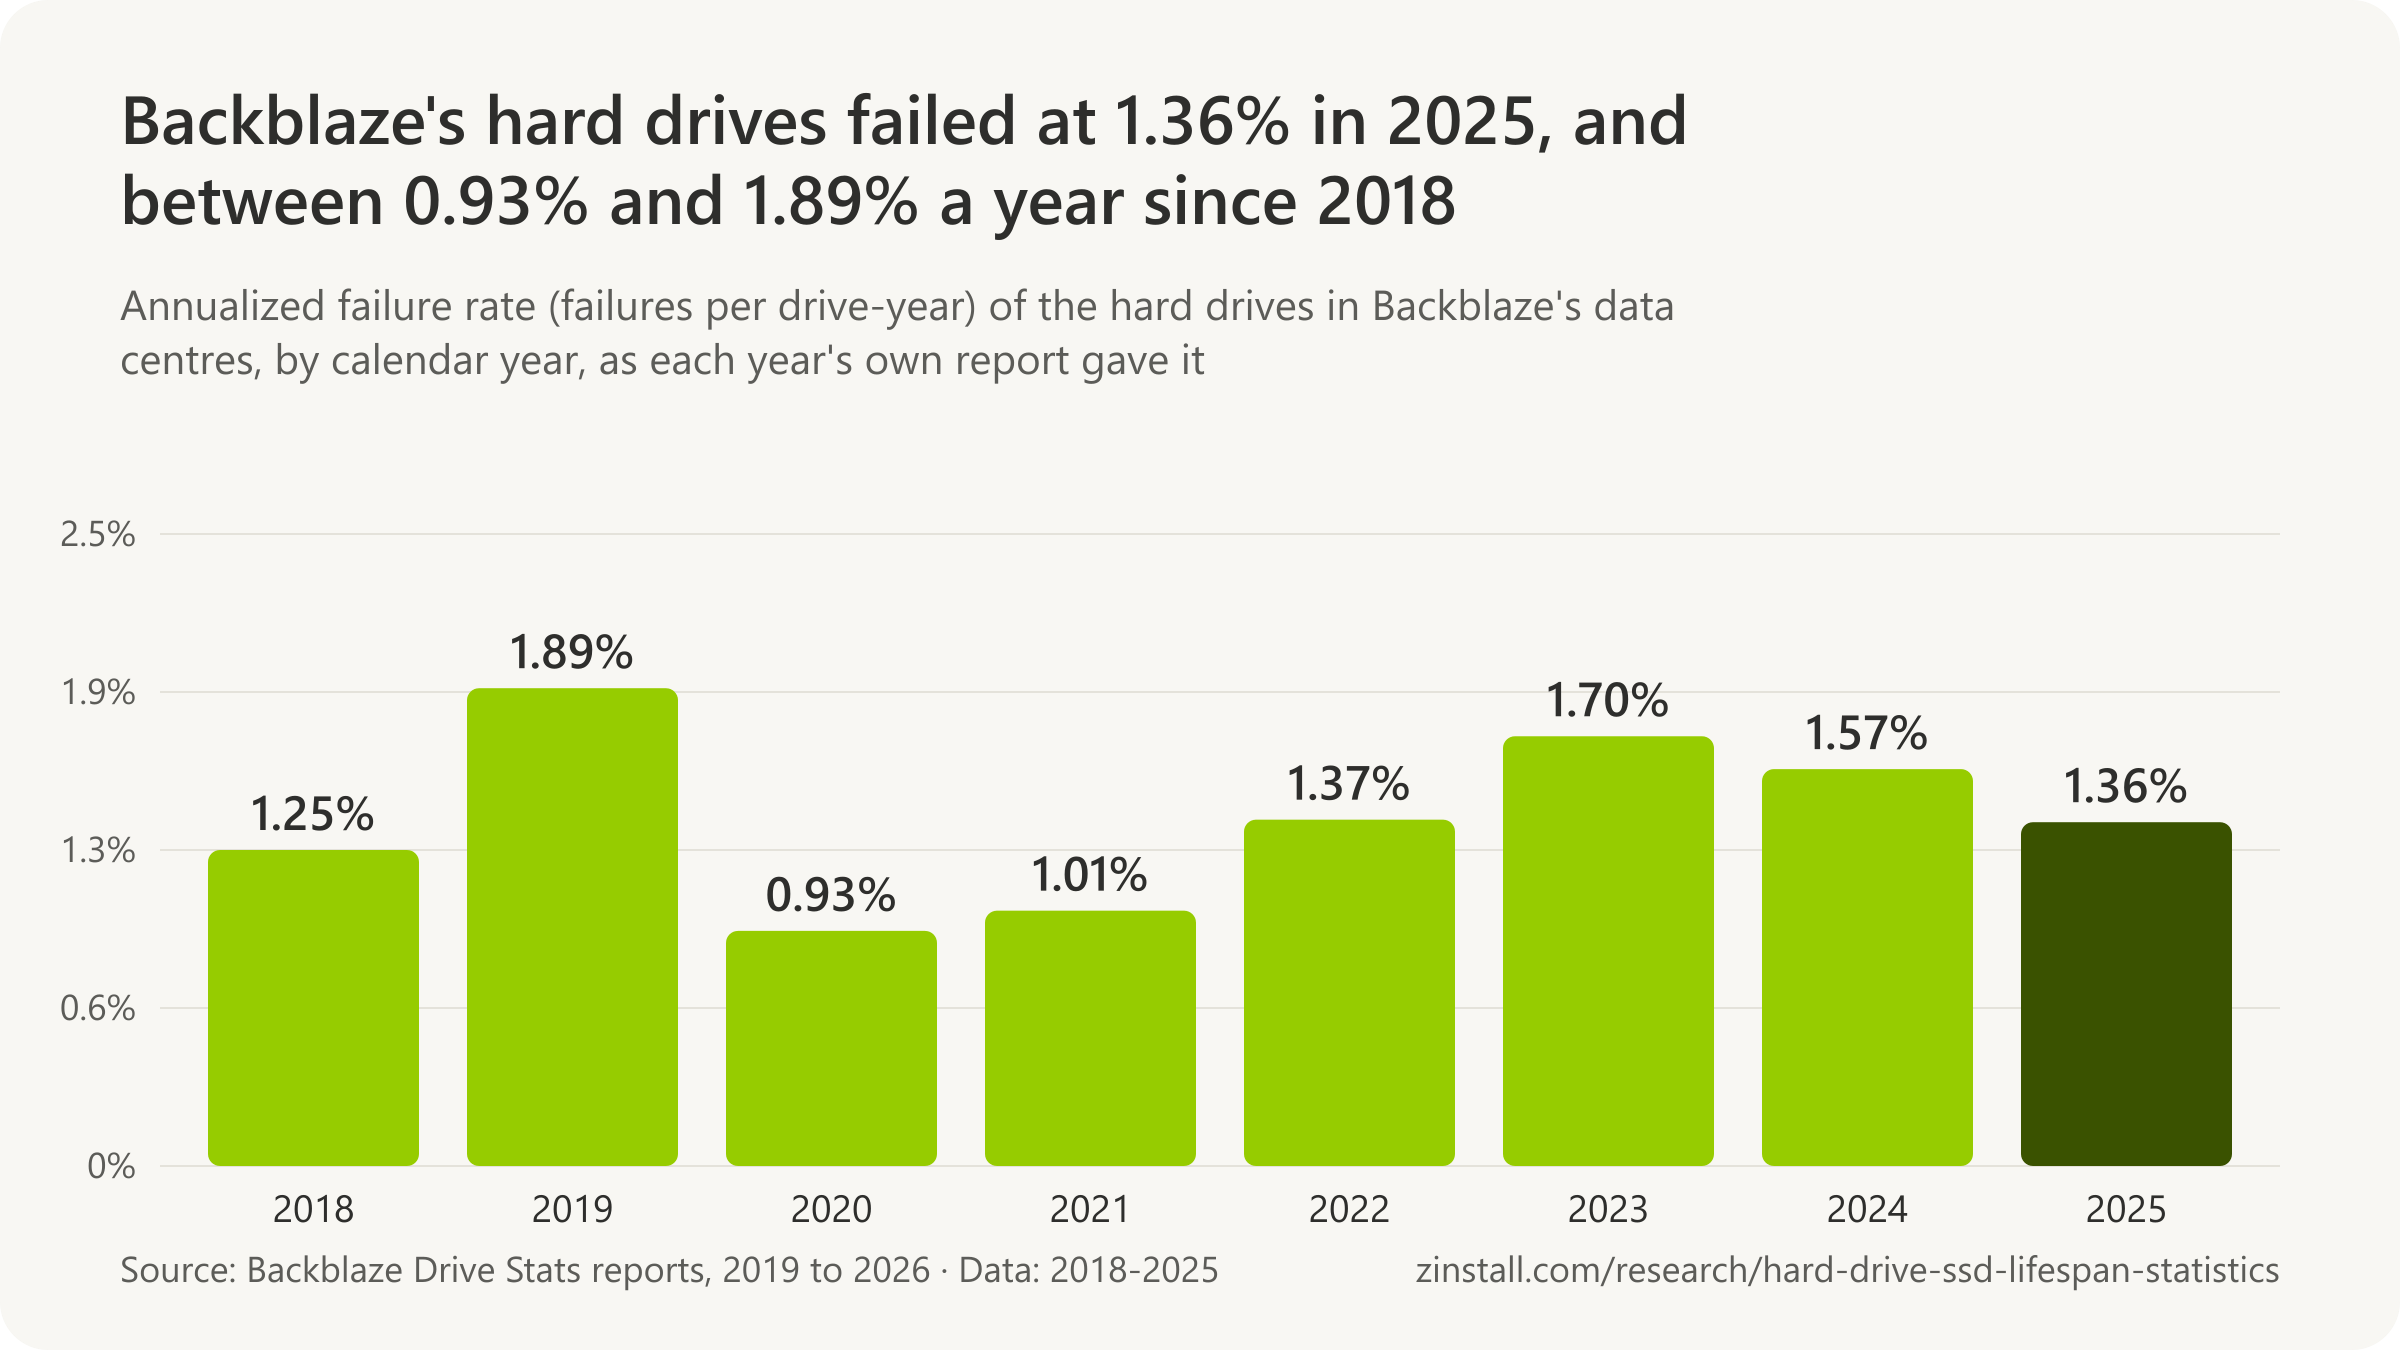
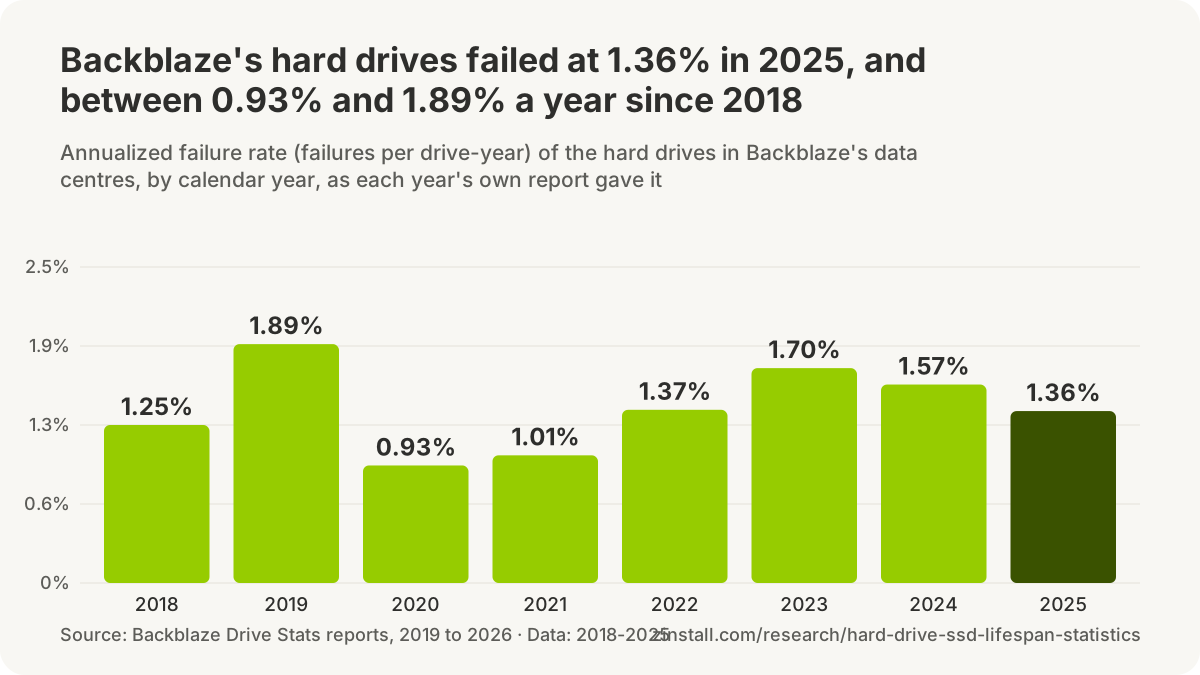
- Hard drives in a cloud company's data centres failed at an annualized 1.36% in 2025, across 344,196 drives (2026).
- Hard drives were replaced at 3.01% a year in seven large systems, against 0.58% to 0.88% on their datasheets (2007).
- 0.22% of enterprise SSDs at one storage maker's customers were replaced a year, 2017 to 2019 (2020).
- Almost 98% of SSD failures in a data centre came before half the rated write cycles were used (2019).
- SSD boot drives failed at 0.92% a year in year five, against 3.55% for same-age hard drives (2022).
- 38% of the SSDs that failed in large data centres showed none of four SMART warning signs beforehand (2016).
- A Samsung 850 Pro 256 GB SSD wrote about 9.1 PB before failing, 60 times its rating (2017).
- 124.3 million hard drives shipped worldwide in 2025, about a fifth of the 651 million of 2010 (2026).
Sources: Backblaze (2026, 2022); Carnegie Mellon University; USENIX, Proceedings of the 18th USENIX Conference on File and Storage Technologies; ACM / IEEE, Proceedings of the International Conference; ACM, Proceedings of the 9th ACM International Systems and Storage Conference; heise online / c't magazin; Forbes
How long does an SSD last, how often do hard drives fail, and which lasts longer? The answers usually given, three to five years for a hard drive and five to ten for an SSD, have no study behind them. This page collects what has been measured: the failure counts Backblaze has published for its data-centre drives since 2013, the field studies of Google, Carnegie Mellon, Microsoft, NetApp and Alibaba, retailers' and recovery labs' records, the makers' ratings and the tests that wrote drives until they died, each with its measure, its date and its source. It also says where nothing has been measured, as for external drives and home PCs.
How often do hard drives fail?
Hard drives in a cloud company's data centres failed at an annualized 1.36% in 2025, across 344,196 drives (Backblaze, 2026).

- Hard drives were replaced at 3.01% a year in seven large systems, against 0.58% to 0.88% on their datasheets (Carnegie Mellon University, 2007).
- 3.16% of hard drives failed a year across nine Microsoft data centres, from 1.5% to 5.4% by site.
- About 0.78% of hard drives failed a year across the 15 largest models in Alibaba Cloud's data centres.
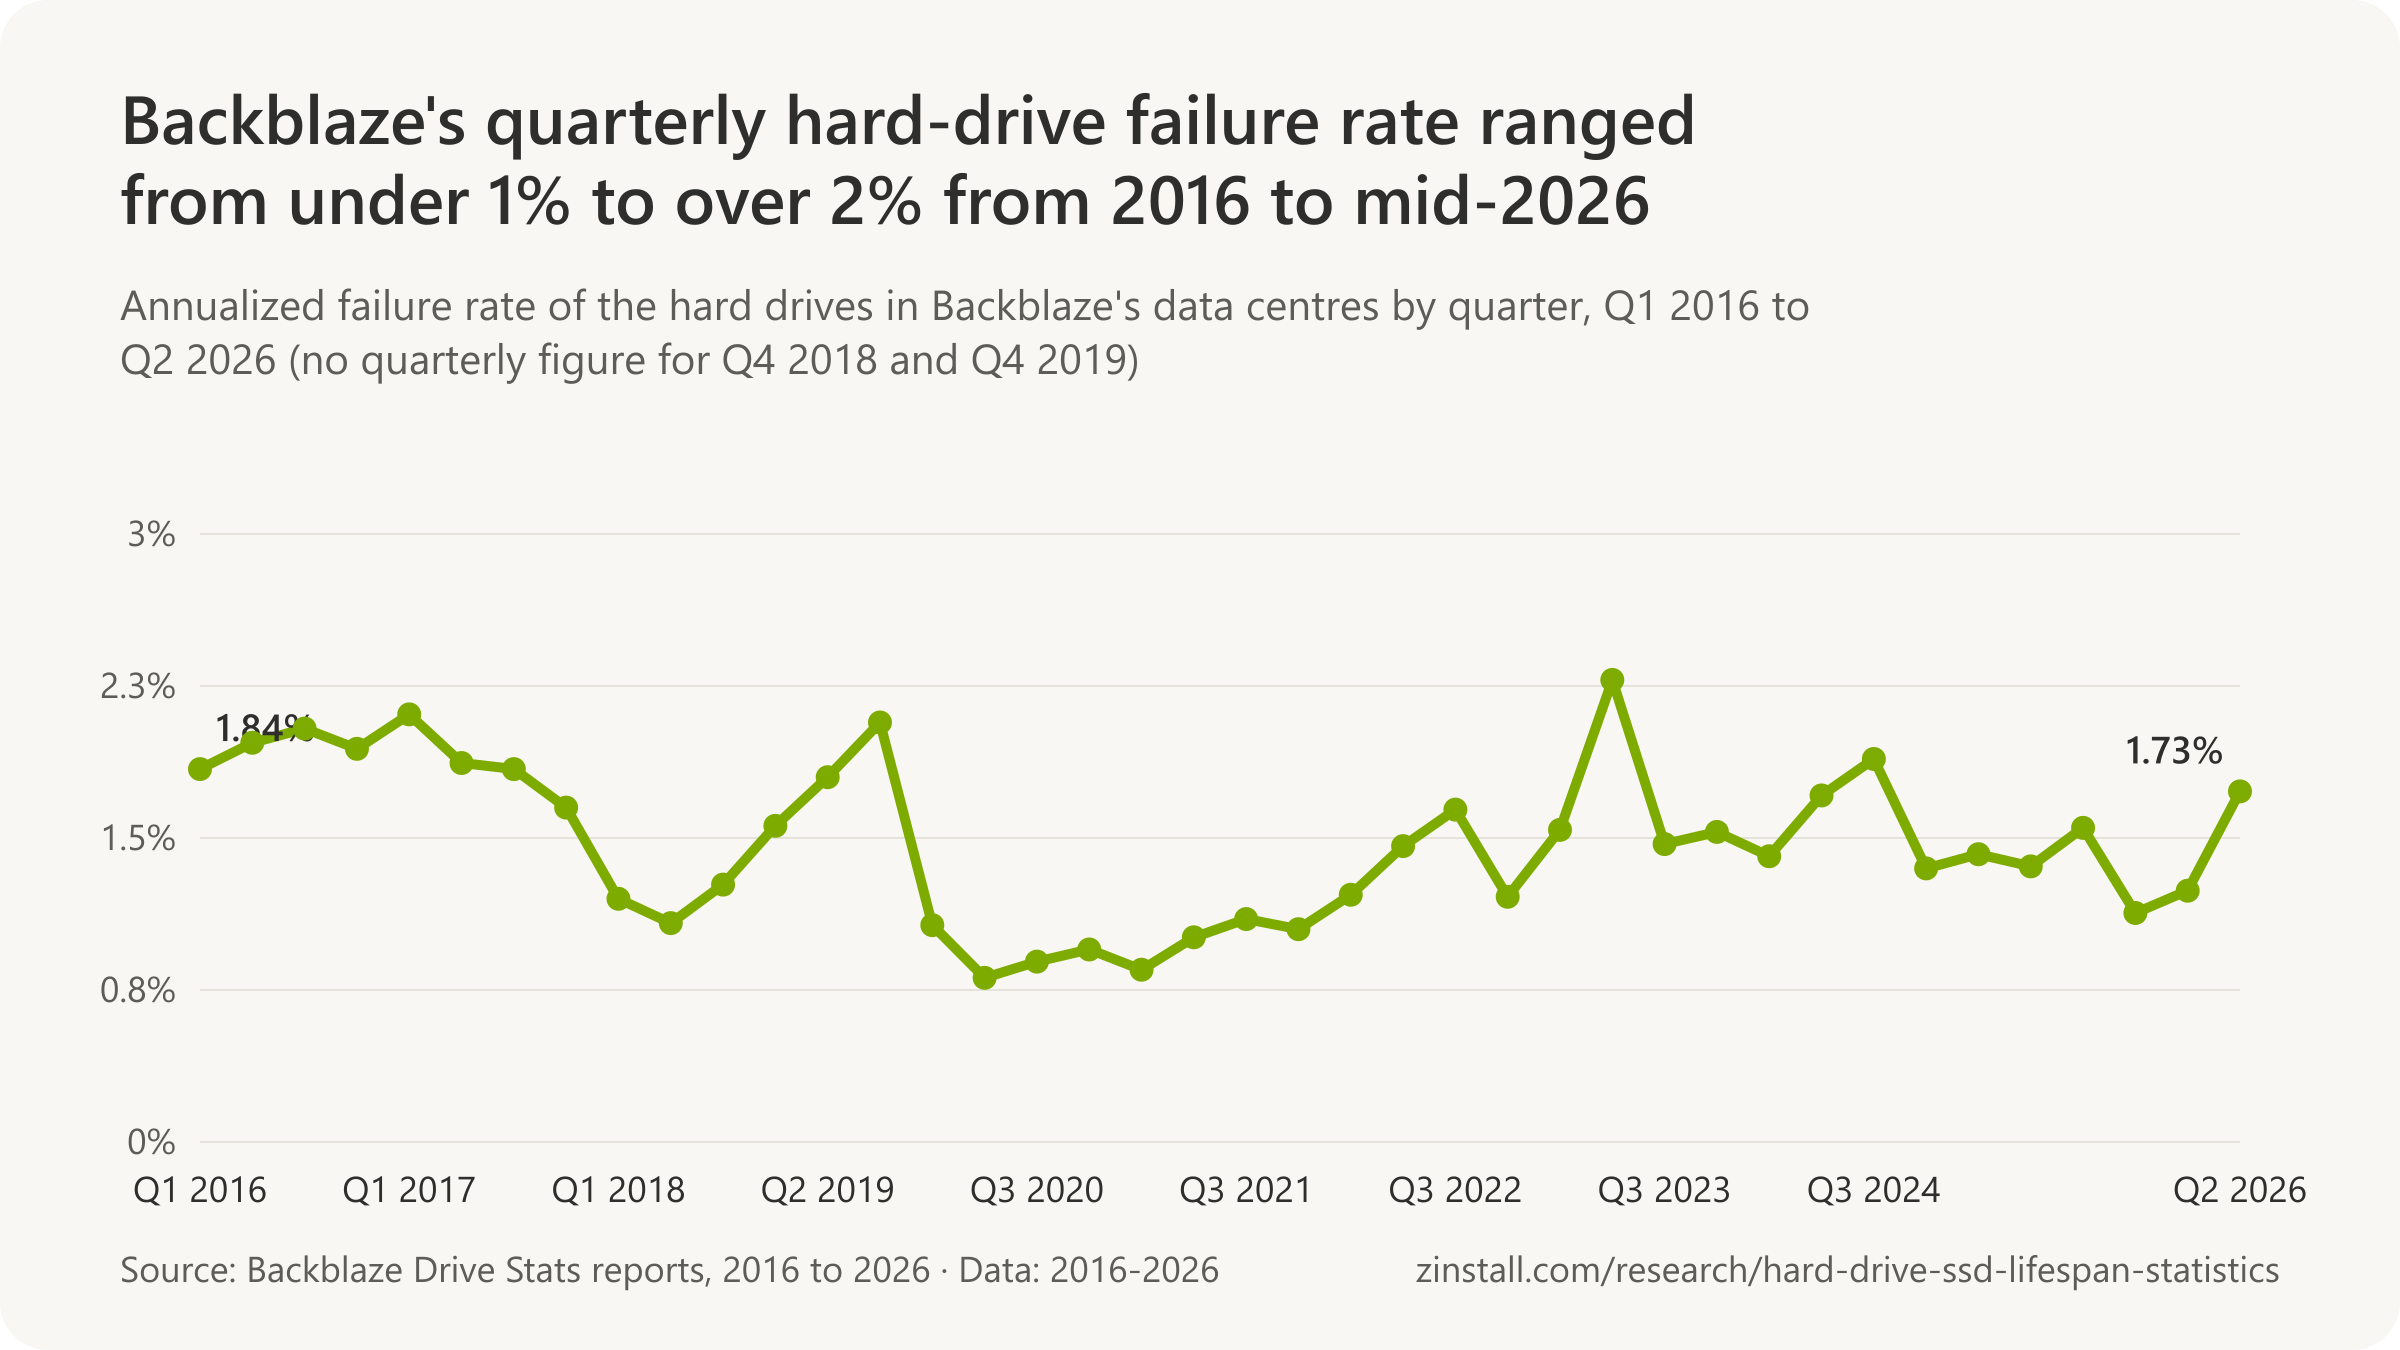
- A cloud company's hard drives failed at an annualized 1.73% in the second quarter of 2026, its newest published quarter.
- 53.0% of the failures Backblaze logged in Q3 2024 were drives pulled early because they showed signs of failing.
| Fleet, measure and year | Rate |
|---|---|
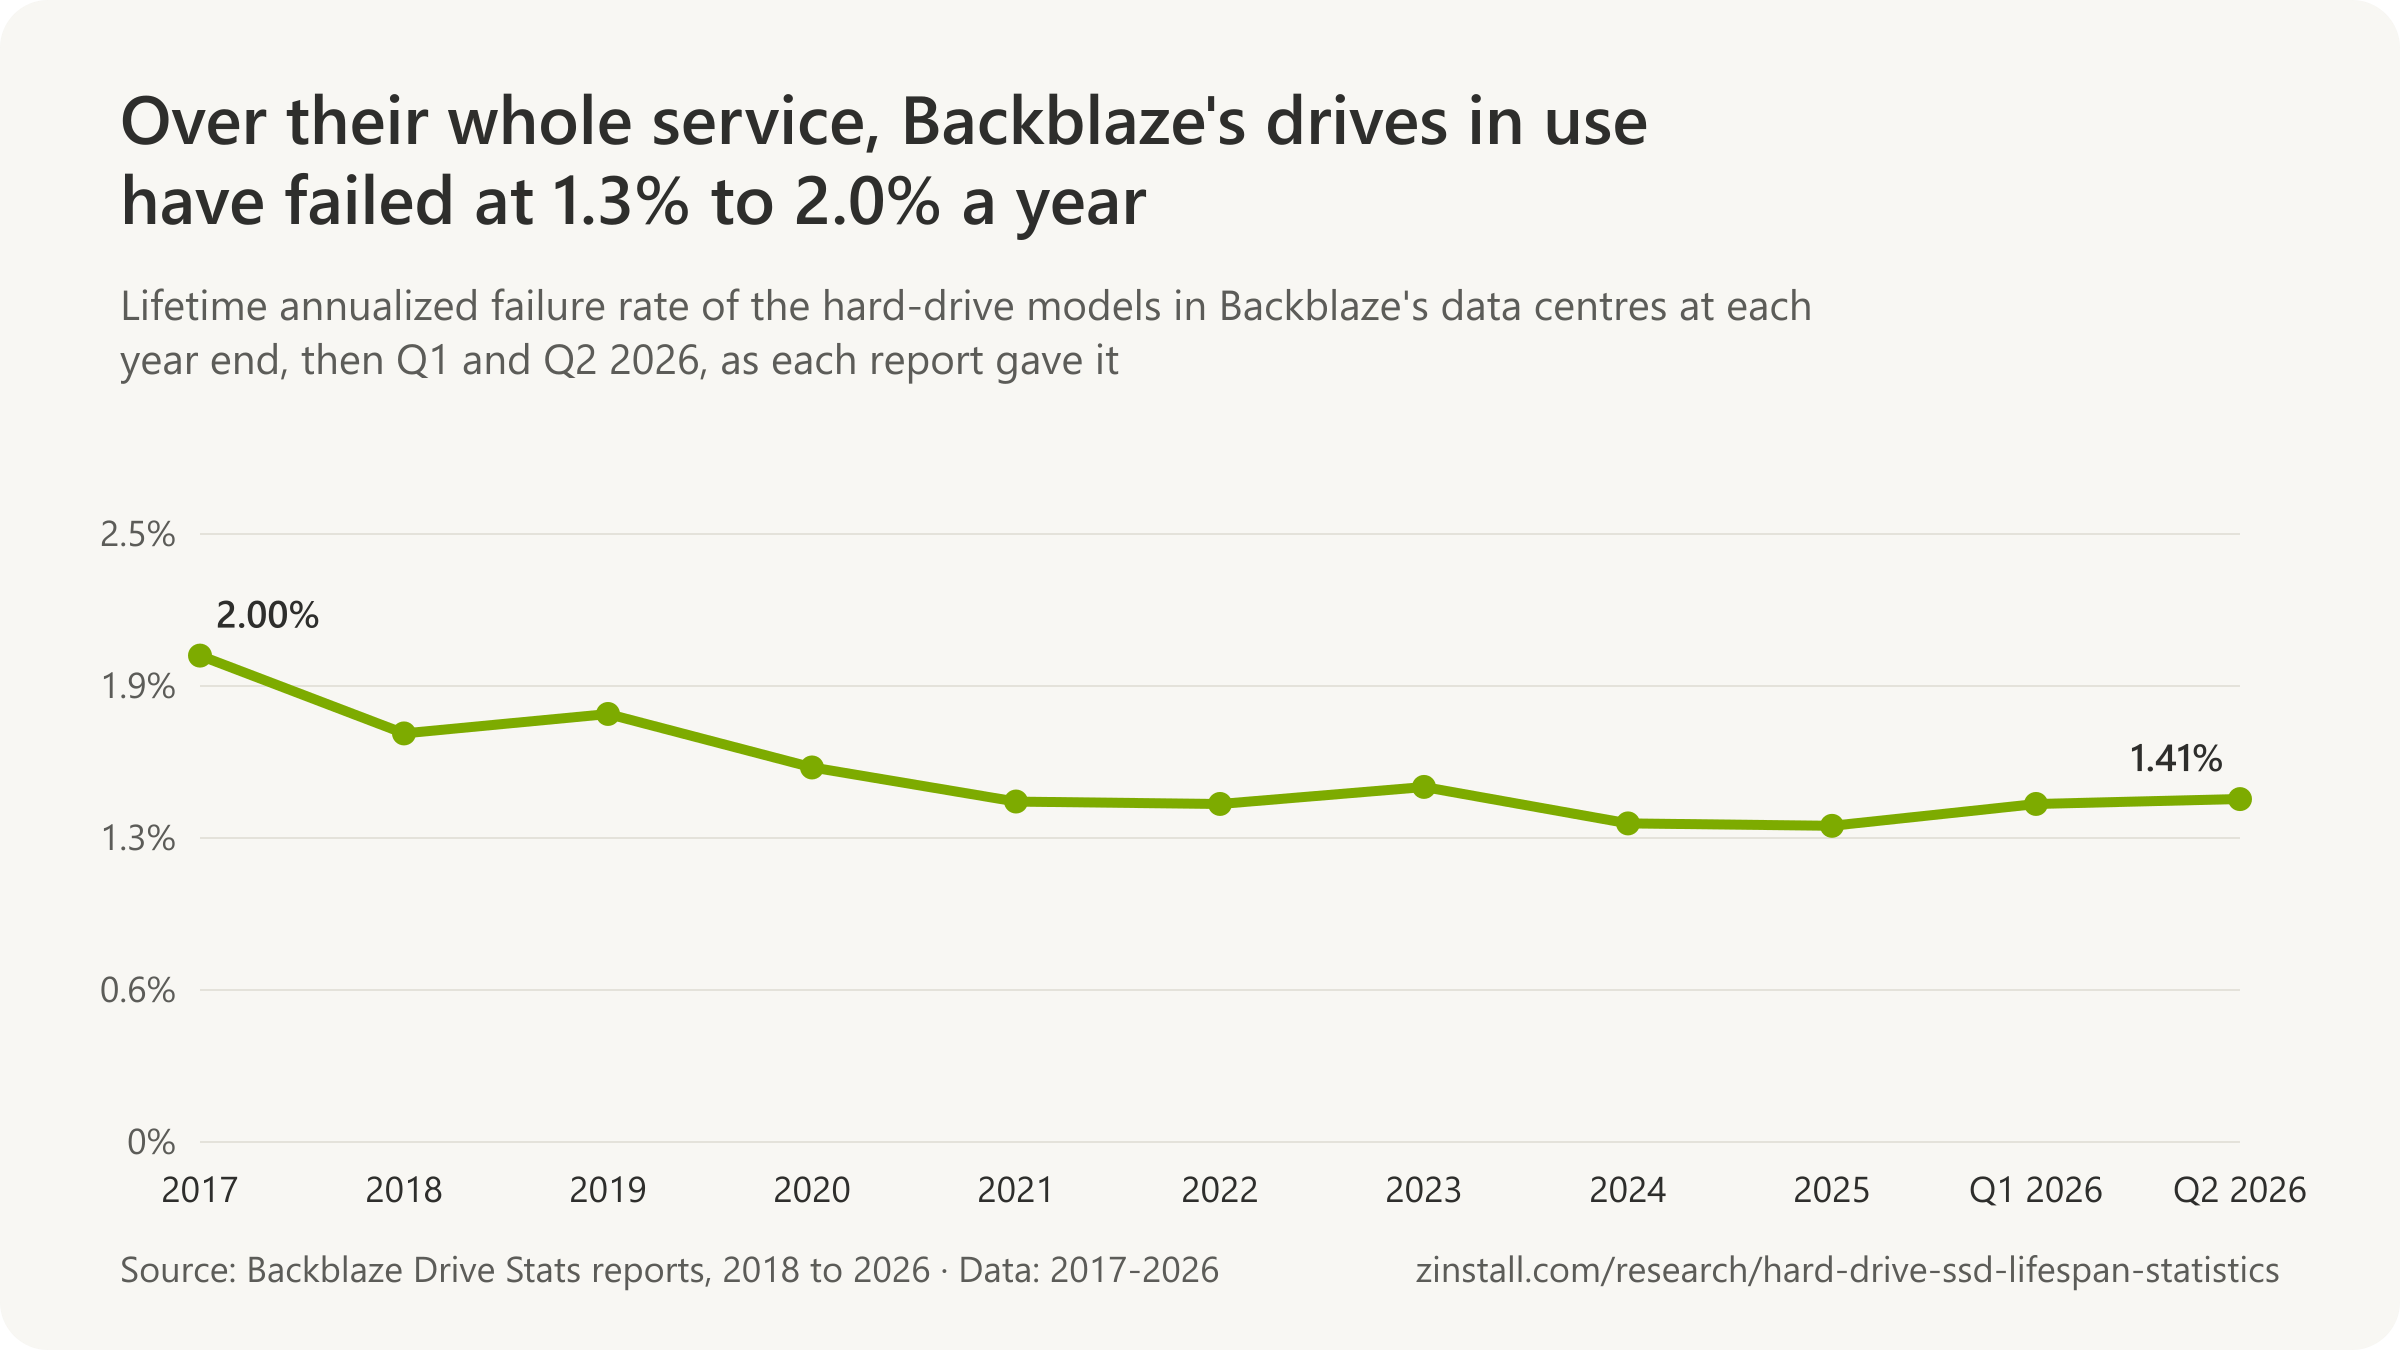
| Backblaze: lifetime rate of the drives in service, mid-2026 | 1.41% |
| Backblaze: its first fleet-wide count, 2013 | 4.2% |
| Carnegie Mellon: a supercomputer cluster over five years | 3.4% |
| Carnegie Mellon: the worst system it studied | up to 13% |
| Microsoft cloud servers: drives replaced a year, 2010 | 2.7% |
| Microsoft Azure: drives turning faulty a day, 2018 | 3 in 10,000 a day |
| NetApp backup systems: SATA drives, 2008 | 1.9% |
| 380,000 drives at 64 data-centre sites, 2020 | 1.36% |
| Two large web properties: SCSI drives replaced a year, 2005 | 6.0% |
| Alibaba Cloud: the 15 largest drive models, 2019 | under 1% (10 of 15 models) |
Sources: Backblaze (2013-2026); Carnegie Mellon University; Rutgers University, GoDaddy and Microsoft; The Chinese University of Hong Kong and Alibaba; Microsoft Research (2010, 2005); Microsoft Research and Microsoft Azure, with the University of Newcastle and Nankai University; University of Illinois at Urbana-Champaign and NetApp; Wayne State University and Northeastern University
Related guides: Windows detected a hard disk problem · A hard drive with bad sectors · Back up your entire computer
More statistics (67)
The measured answer comes from large fleets: Backblaze's data centres, which have published every drive failure since 2013, and the studies of Google, Carnegie Mellon, Microsoft, NetApp and Alibaba. In most of them a hard drive's yearly chance of failing is in the low single digits, and well above the rates on the makers' datasheets. A rate describes a population: it cannot say when one drive will fail.
Backblaze's data centres, every year since 2013

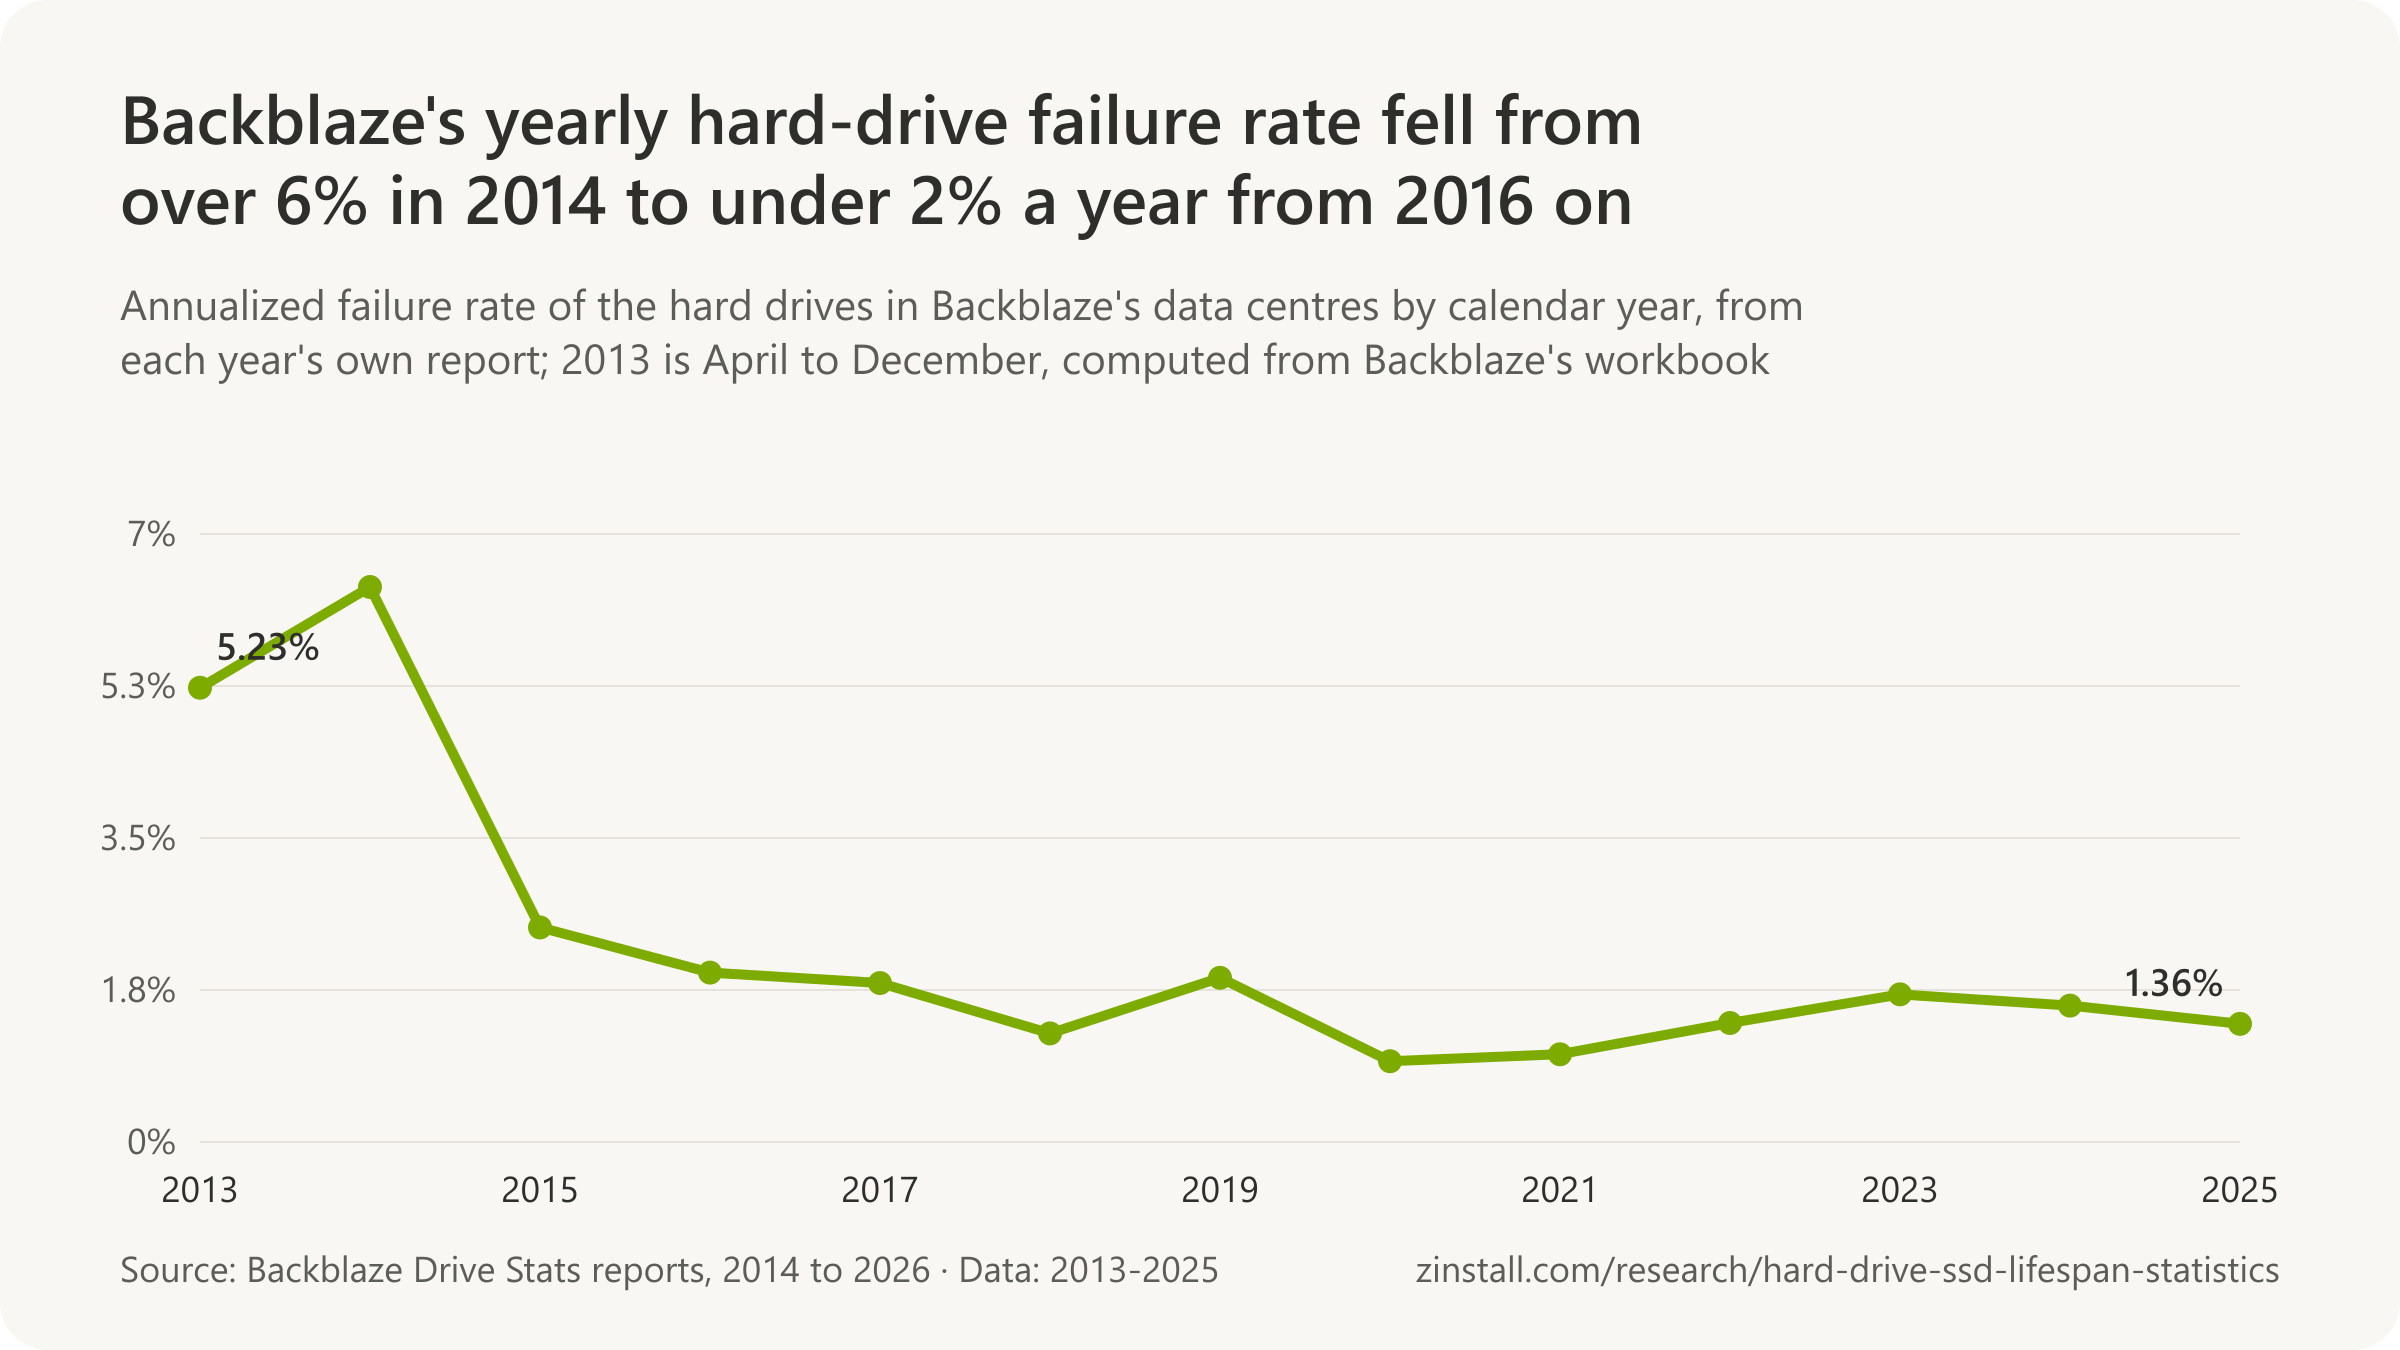
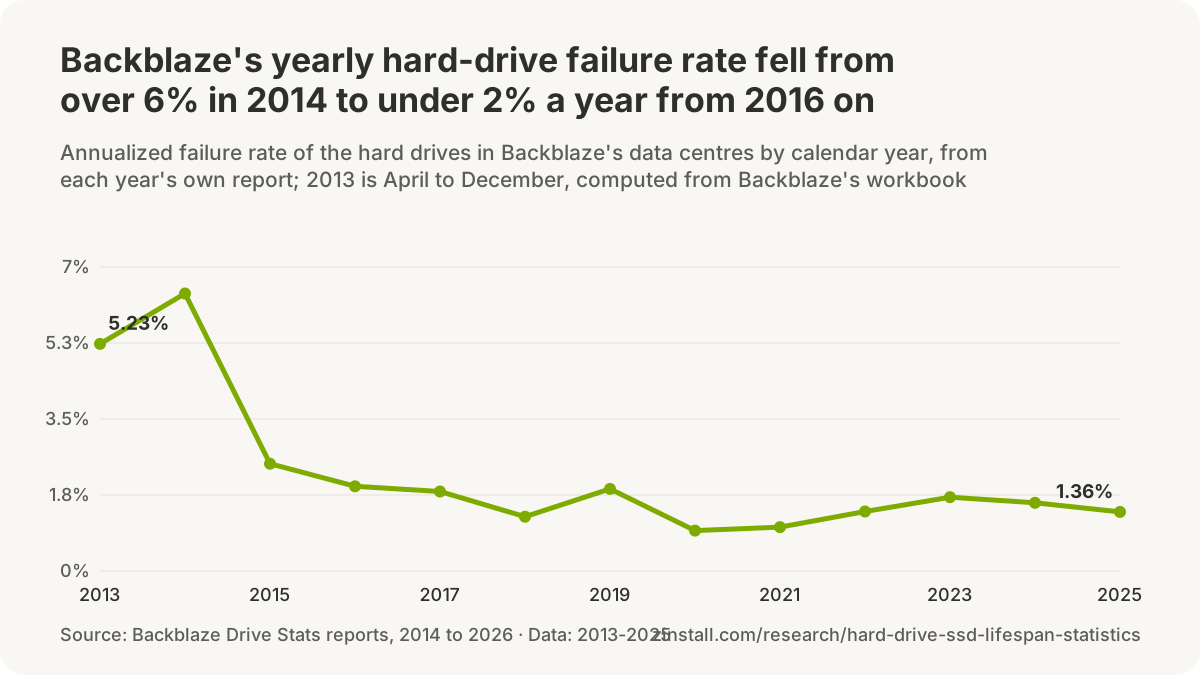
- 2.35% of the hard drives in Backblaze's data centre failed in 2015 on an annualized basis, counting only the 45,566 drives of models still in service at the end of 2017 (Backblaze, 2018).
- 2.00% of the hard drives in Backblaze's data centre failed in 2016 on an annualized basis, counting only the 66,252 drives of models still in service at the end of 2017 (Backblaze, 2018).
- 1.77% of the hard drives in Backblaze's data centres failed in 2017 on an annualized basis, as restated in its 2018 report for 90,523 drives (Backblaze, 2019).
- 1.83% is the 2019 annualized failure rate as Backblaze's 2021 report wrote it, against 1.89% in its own 2019 report (Backblaze, 2022).
- 1.55% is the 2024 annualized failure rate as the text of Backblaze's 2025 report gives it, against 1.57% in its 2024 report and in the 2025 report's own chart (Backblaze, 2026).
- 1.62% is the end-2019 lifetime annualized failure rate as Backblaze's 2021 report gives it, against 1.76% in the 2019 report's own lifetime table (Backblaze, 2022).
- 3.36% a year was the annualized failure rate of all 85,467 hard drives Backblaze had used from April 2013 to the end of 2016, 5,380 failures in 58,375,646 drive days, retired models included (Backblaze, 2017).
- 6,795 hard drives failed in Backblaze's data centres between April 2013 and the end of 2017, an average of 3.94 a day, by Backblaze's count (Backblaze, 2018).
- One hard drive failed about every two hours and five minutes in Backblaze's data centres in 2023, 4,189 failures in the year (Backblaze, 2024).


Backblaze's fleet

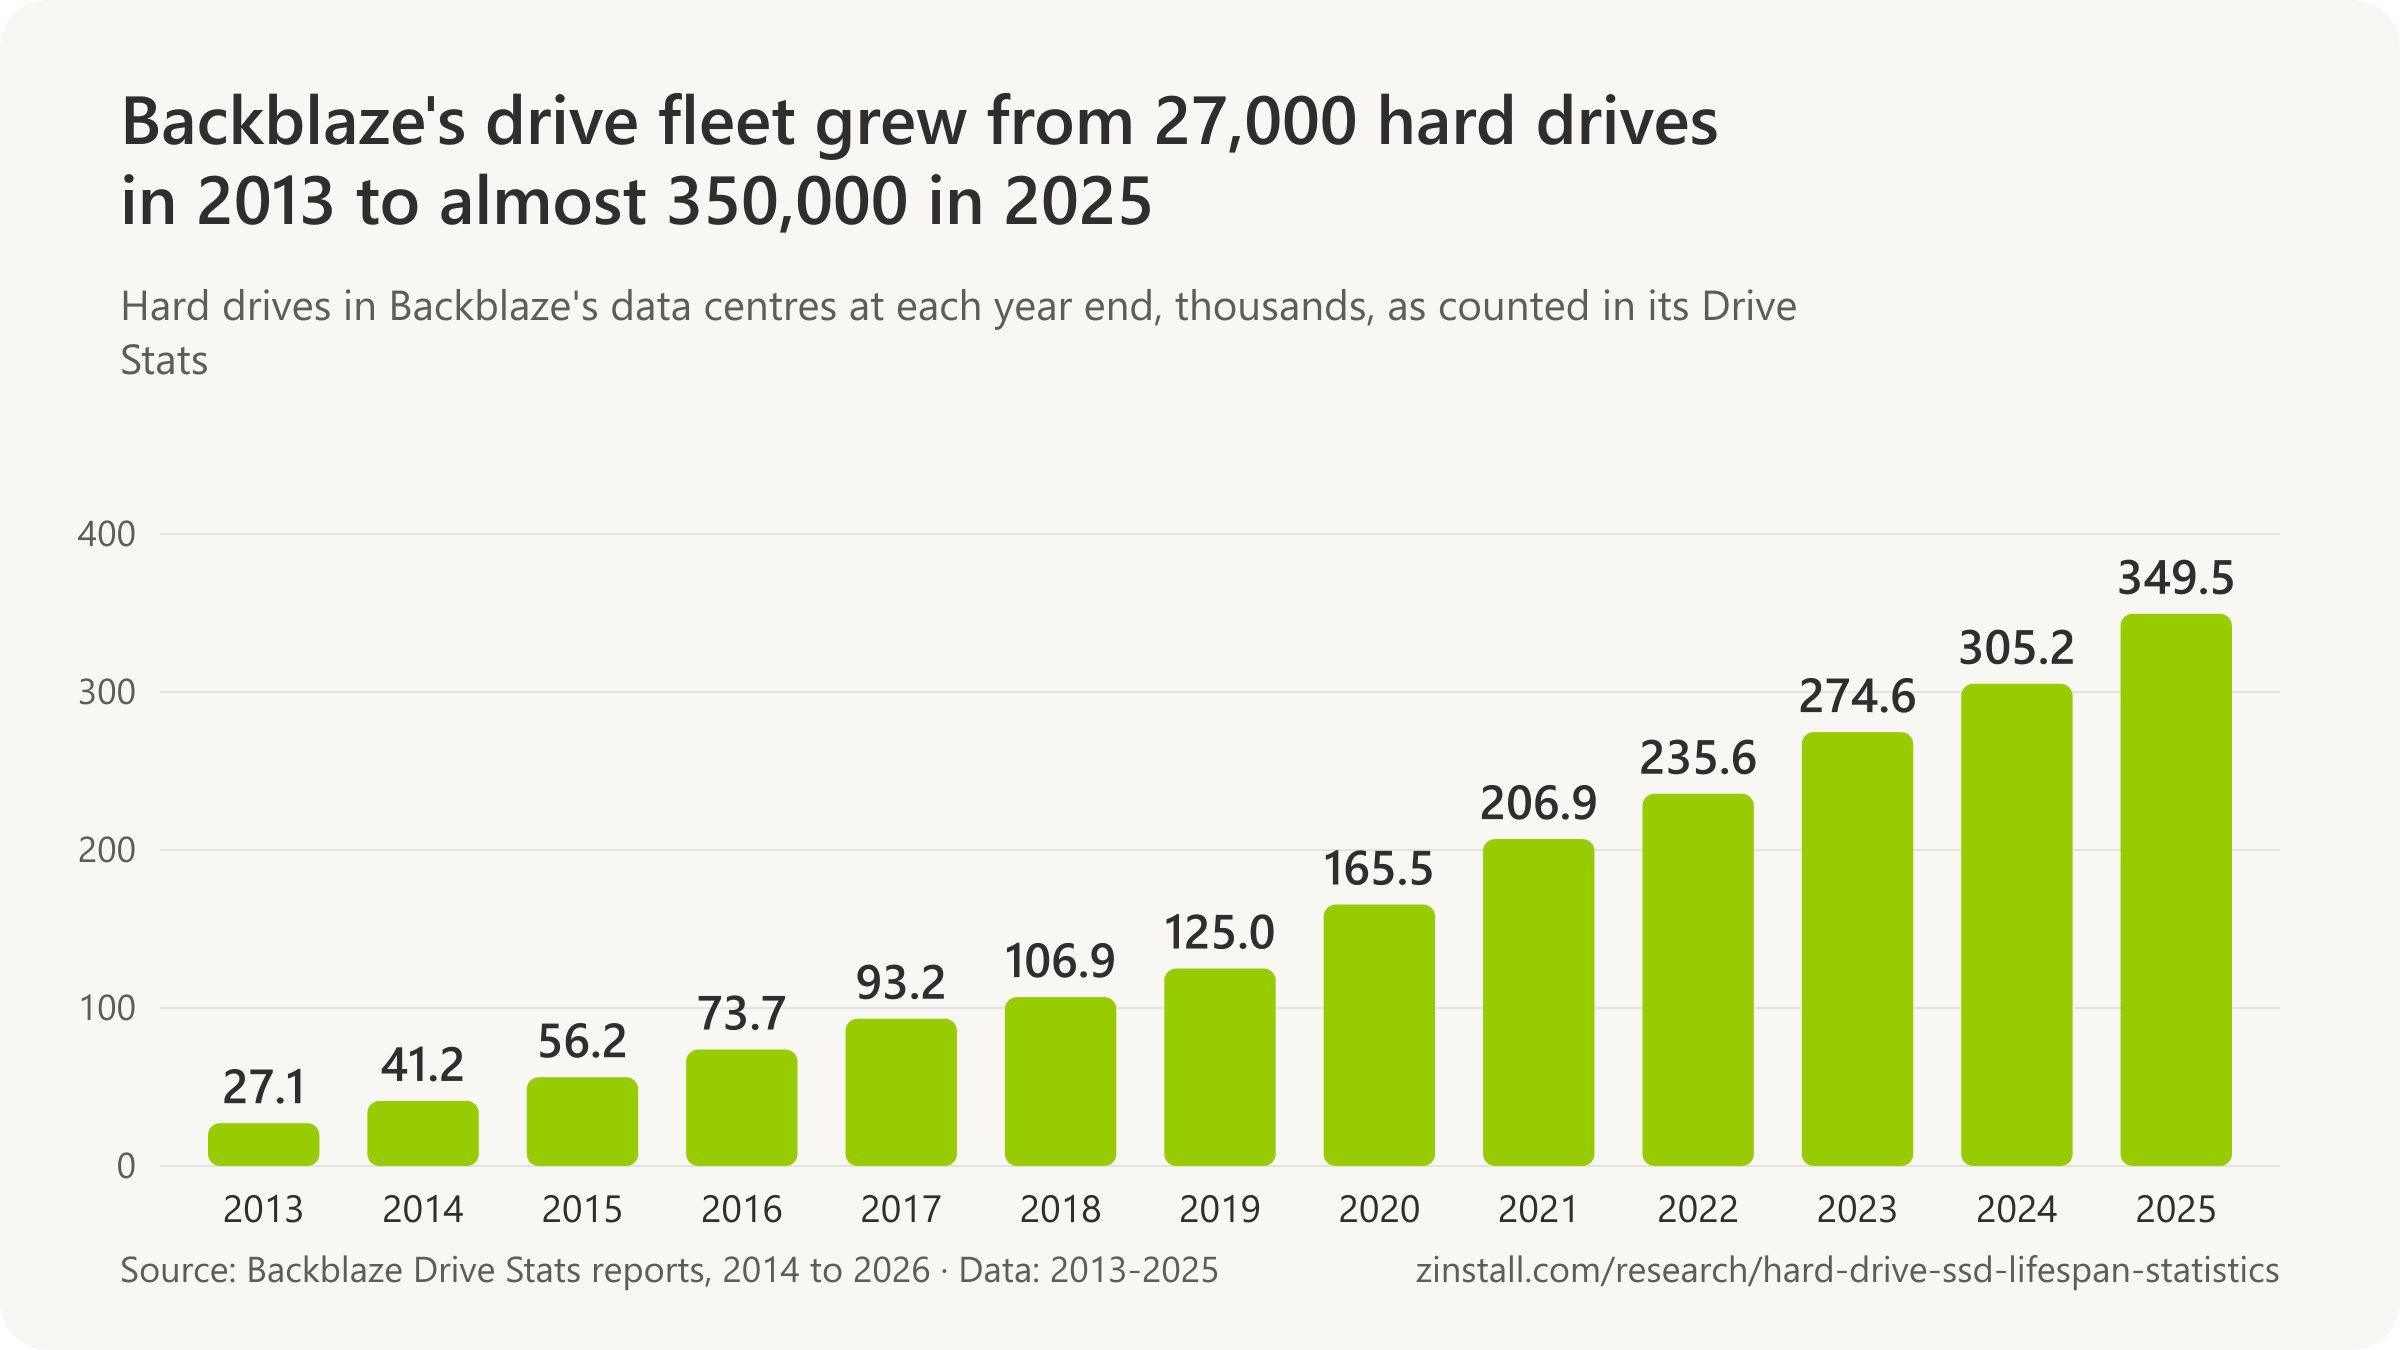
- 3,112 hours were spent replacing hard drives across Backblaze's data centres in 2025, about 0.74 hours per drive (Backblaze, 2025).
- 53,337 drives were installed in Backblaze's data centres in 2024, about 26 an hour of technician time (Backblaze, 2025).
- Over four exabytes of storage ran on Backblaze's hard drives in mid-2025, by Backblaze's description (Backblaze, 2025).
- 388 million daily drive records make up Backblaze's public Drive Stats dataset in 2026, growing by more than 240,000 a day (Backblaze, 2026).
Field studies: Google, Carnegie Mellon, Microsoft, NetApp, Alibaba and others
- 3.01% of hard drives were replaced each year on average across seven large production systems, against datasheet failure rates of 0.58% to 0.88%, among about 100,000 drives under five years old (Carnegie Mellon University, 2007).
- Up to 13% of hard drives a year were replaced on some systems, while annual replacement rates of 2% to 4% were common, across about 100,000 drives at computing and internet-service sites (Carnegie Mellon University, 2007).
- 3.4% of hard drives a year were replaced over the five-year life of a 765-node supercomputer cluster, against a datasheet rate of 0.88% (Carnegie Mellon University, 2007).
- 3.3% of SATA hard drives a year were replaced, against 3.7% of 15K rpm SCSI drives in the same supercomputer, so the cheaper SATA drives did no worse (Carnegie Mellon University, 2007).
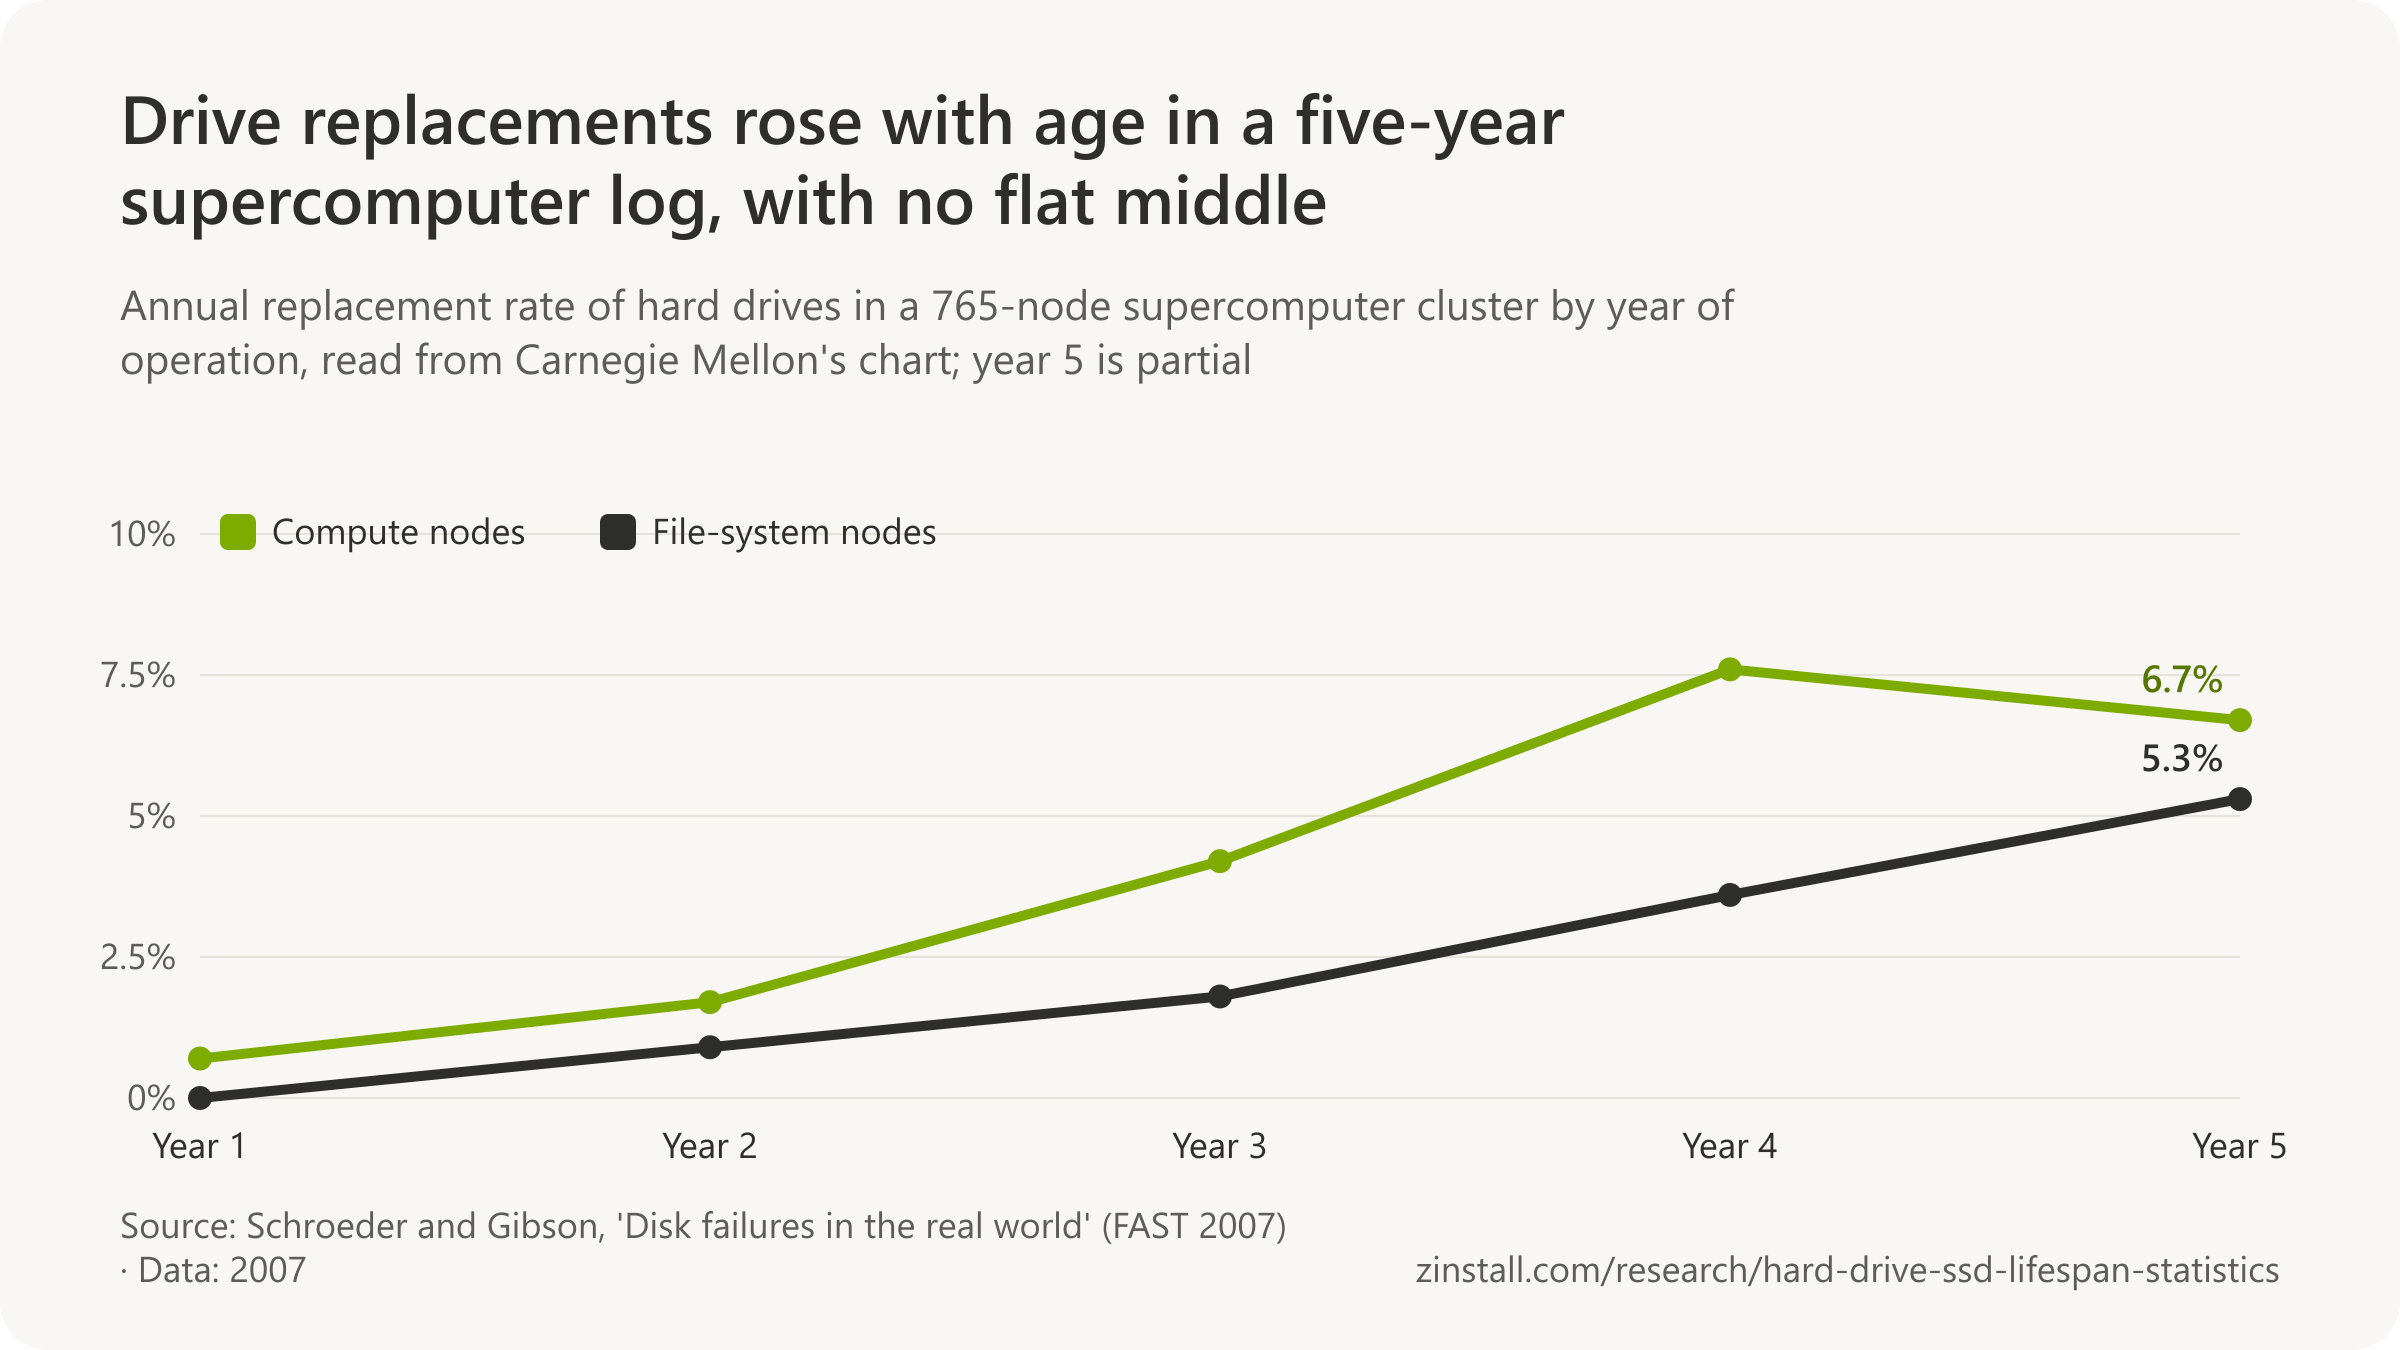
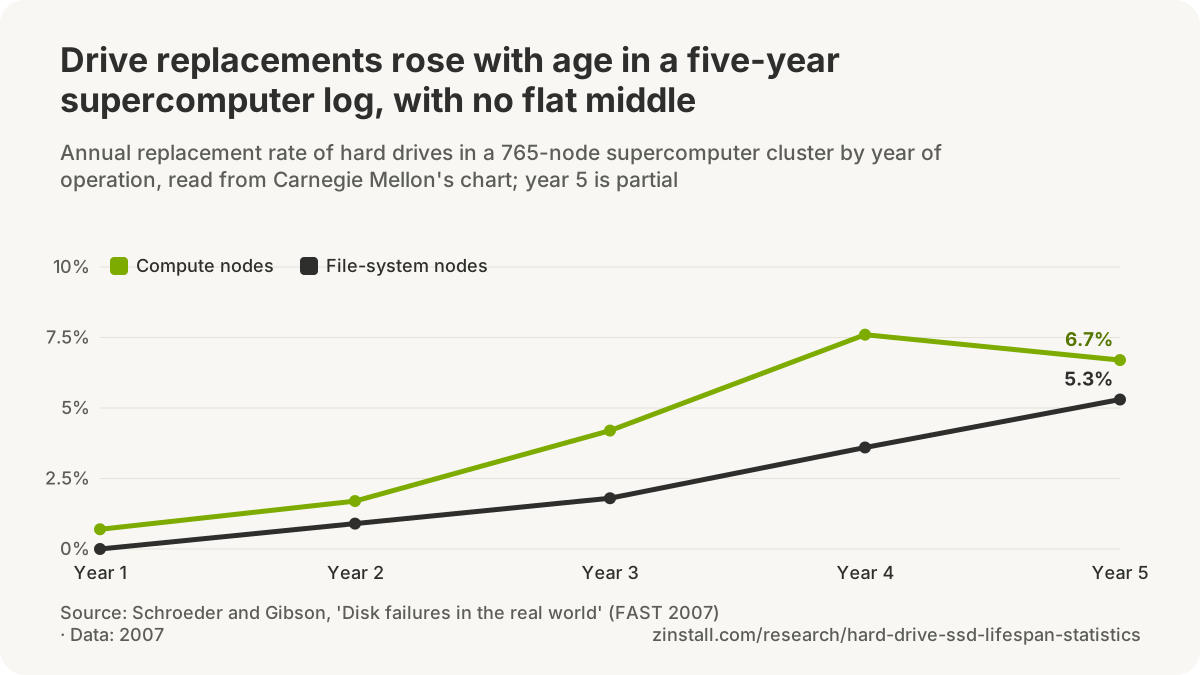
- About 0.7% of hard drives were replaced in their first year of operation in a supercomputer cluster's compute nodes (Carnegie Mellon University, 2007).
- About 1.7% of hard drives were replaced in their second year of operation in a supercomputer cluster's compute nodes (Carnegie Mellon University, 2007).
- About 4.2% of hard drives were replaced in their third year of operation in a supercomputer cluster's compute nodes (Carnegie Mellon University, 2007).
- About 7.6% of hard drives were replaced in their fourth year of operation in a supercomputer cluster's compute nodes, still within the drives' nominal five-year life (Carnegie Mellon University, 2007).
- About 6.7% of hard drives were replaced in their fifth year of operation in a supercomputer cluster's compute nodes (Carnegie Mellon University, 2007).
- 0% of hard drives were replaced in their first year in a supercomputer cluster's file-system nodes: no infant mortality was detectable (Carnegie Mellon University, 2007).
- About 0.9% of hard drives were replaced in their second year in a supercomputer cluster's file-system nodes (Carnegie Mellon University, 2007).
- About 1.8% of hard drives were replaced in their third year in a supercomputer cluster's file-system nodes (Carnegie Mellon University, 2007).
- About 3.6% of hard drives were replaced in their fourth year in a supercomputer cluster's file-system nodes (Carnegie Mellon University, 2007).
- About 5.3% of hard drives were replaced in their fifth year in a supercomputer cluster's file-system nodes (Carnegie Mellon University, 2007).
- 16% of node outages caused by hardware in a supercomputer cluster were traced to hard drives, the third cause after CPUs (44%) and memory (29%), but about 90% of disk problems ended in a drive replacement (Carnegie Mellon University, 2007).
- 43% of the hard drives customers returned showed no problem when the maker tested them, as a drive vendor reported to Carnegie Mellon (Carnegie Mellon University, 2007).
- 20% to 55% of storage-subsystem failures were disk failures, and 27% to 68% were failures of the connections (cables, shelf enclosures, adapters), across about 39,000 NetApp storage systems with 1.8 million drives (University of Illinois and NetApp, 2008).
- 1.9% of SATA hard drives in near-line backup systems failed a year, against 0.9% of Fibre Channel drives in low-end primary systems, from the logs of about 39,000 NetApp storage systems (University of Illinois and NetApp, 2008).
- 4.6% a year was the failure rate of whole storage subsystems in low-end NetApp systems, while their disks failed at only 0.9% a year, about 20% of the total (University of Illinois and NetApp, 2008).
- 78% of hardware replacements in Microsoft's cloud servers were hard disks, followed by RAID controllers (5%) and memory (3%), across over 100,000 servers over 14 months (Microsoft, 2010).
- 70% of first hardware failures of Microsoft's cloud servers were hard disks, ahead of RAID controllers (6%) and memory (5%), across over 100,000 servers (Microsoft, 2010).
- 2.7% of hard disks were replaced each year (an upper bound) in Microsoft's cloud servers, against 0.7% of RAID controllers and 0.1% of memory modules, across over 100,000 servers (Microsoft, 2010).
- 3.16% of hard drives failed a year on average (annualized failure rate), ranging from 1.5% to 5.4% by data centre, across more than 1 million drives in nine Microsoft data centres (Microsoft and Rutgers University, 2016).
- 89% of server hardware component failures were hard drive failures on average (76% to 95% by data centre), whatever the cooling or climate, across nine Microsoft data centres (Microsoft and Rutgers University, 2016).
- The highest and lowest useful-life failure rates of hard drive models differed by well over 10 times, across over 50 makes and models and 4.3 million NetApp drives (Carnegie Mellon University, 2020).
- 1.36% of hard drives failed a year (annual failure rate, measured over about 70 days), across 380,000 drives at 64 sites of a large data-centre operator (Wayne State and Northeastern Universities, 2020).
- 10 of the 15 largest hard drive models had an annualized failure rate under 1%, and none above 3.8%, across over three million drives in Alibaba Cloud data centres (Chinese University of Hong Kong and Alibaba, 2019).
- About 0.78% of hard drives failed a year on average across the 15 largest drive models, which make up 72% of over three million drives in Alibaba Cloud data centres (Chinese University of Hong Kong and Alibaba, 2019).
- At most 3 in 10,000 hard drives became faulty on any day in Microsoft Azure, a cloud the paper says runs hundreds of millions of drives (Microsoft, 2018).
- 6.0% of 10K rpm SCSI hard drives a year needed replacement at one large web property, and 3.3% of PATA desktop-class drives at another, about ten times the vendors' specification sheets (Microsoft Research, 2005).
Drives among other hardware failures
- Motherboards and hard drives were the two most common sources of hardware failure in notebook and desktop PCs under two years old, Gartner reported in 2006 (Gartner, 2006).
- 25% to 45% of notebook hardware failures were motherboard and hard-drive failures, Gartner found in 2006 from warranty repair providers and end-user surveys (Gartner, 2006).
What counts as a failure
- 53.0% of the 1,361 hard-drive failures in Backblaze's data centres in Q3 2024 were proactive replacements of drives showing signs of failure, and 47.0% were drives that had stopped working (Backblaze, 2024).
- AFR = (drive failures / (drive days / 365)) x 100 is the formula behind every Backblaze failure rate, counting each day each drive runs so drives added or removed mid-year are weighted fairly (Backblaze, 2022).
- 1 drive out of 100 is expected to fail in a year at a 1% annualized failure rate, Backblaze explains, adding that a single drive's owner faces all-or-nothing odds (Backblaze, 2025).
- 3 conditions define a failed drive in Backblaze's data: it will not spin up or connect, it will not sync or stay synced in its array, or its SMART stats exceed Backblaze's thresholds (Backblaze, 2015).
- 16.95% was the Q3 2025 annualized failure rate of one Toshiba 16TB model in Backblaze's data centres, inflated because drives pulled for a firmware update were counted as failures (Backblaze, 2025).
- Day-one failures have probably been under-reported in Backblaze's data since it began, Backblaze said in 2026, because a drive must survive its first day to enter the daily log (Backblaze, 2026).
- 24.31% was the Q1 2022 annualized failure rate of a batch of 76 two-month-old HGST 8TB drives with 4,504 drive days, an example of why Backblaze warns against small samples (Backblaze, 2022).
- 2 drive models, the Western Digital Green 3TB and the Seagate LP 2TB, were left out of Backblaze's first reliability report because they 'just don't work' in its servers, an early selection caveat (Backblaze, 2014).
- Backblaze warns that its drives are used differently from consumers' drives, and that its workloads and drive handling have changed over its 13 years of data (Backblaze, 2025).
- Backblaze tolerates drive failures by design: it says pushing hardware toward zero failures would be imprudent because its software layer largely prevents data loss (Backblaze, 2026).
- One third of enterprise SSD replacements in NetApp's storage systems followed severe SCSI errors and another third were preventive, triggered by predictions of failure; only 0.6% followed a drive going completely dead (Maneas et al., 2020).
- Half (49.55%) of Alibaba's NVMe SSD failures showed up as read or write errors and only 5.65% as the drive vanishing, against 53.7% vanishing among its earlier SATA SSDs (Lu et al., 2022).
- 1.41% of Alibaba's enterprise NVMe SSDs turned 'fail-slow' (at least twice as slow as their neighbours for 5 minutes or more) during four months of monitoring, against 0.20% of its hard drives (Lu et al., 2022).
- Only about 0.22% of Alibaba's fail-slow NVMe SSDs (10 drives) went on to fail outright within the following months, so a slow SSD is rarely a dying one (Lu et al., 2022).
- Slow-downs in Alibaba's enterprise NVMe SSDs became strongly more common with age only once drives had been powered on for more than 41 months (Lu et al., 2022).
- Only about half of the SSDs swapped out after failing in a Google data centre were repaired and returned to service within the six years observed (Alter et al., 2019).
- About 50% of the failed Google data-centre SSDs in one study were repaired and put back into service, against 7% of failed Backblaze hard drives (Pinciroli et al., 2023).
Sources: Backblaze (2014-2026); Carnegie Mellon University (2007, 2020); University of Illinois at Urbana-Champaign and NetApp; Microsoft Research (2005, 2010); Rutgers University, GoDaddy and Microsoft; Wayne State University and Northeastern University; The Chinese University of Hong Kong and Alibaba; Microsoft Research and Microsoft Azure, with the University of Newcastle and Nankai University; USENIX, Proceedings of the 2019 USENIX Annual Technical Conference; Gartner (2006); USENIX, Proceedings of the 18th USENIX Conference on File and Storage Technologies; USENIX, Proceedings of the 2022 USENIX Annual Technical Conference; ACM / IEEE, Proceedings of the International Conference; IEEE, Transactions on Dependable and Secure Computing, vol. 20, no. 1, pp. 256-270
How long do hard drives last?
About 90% of the hard drives in a fleet of over 200,000 data-centre drives had lasted four years (Backblaze, 2021).

- 65% of a cloud fleet's hard drives were still working after six years, by a 2021 analysis.
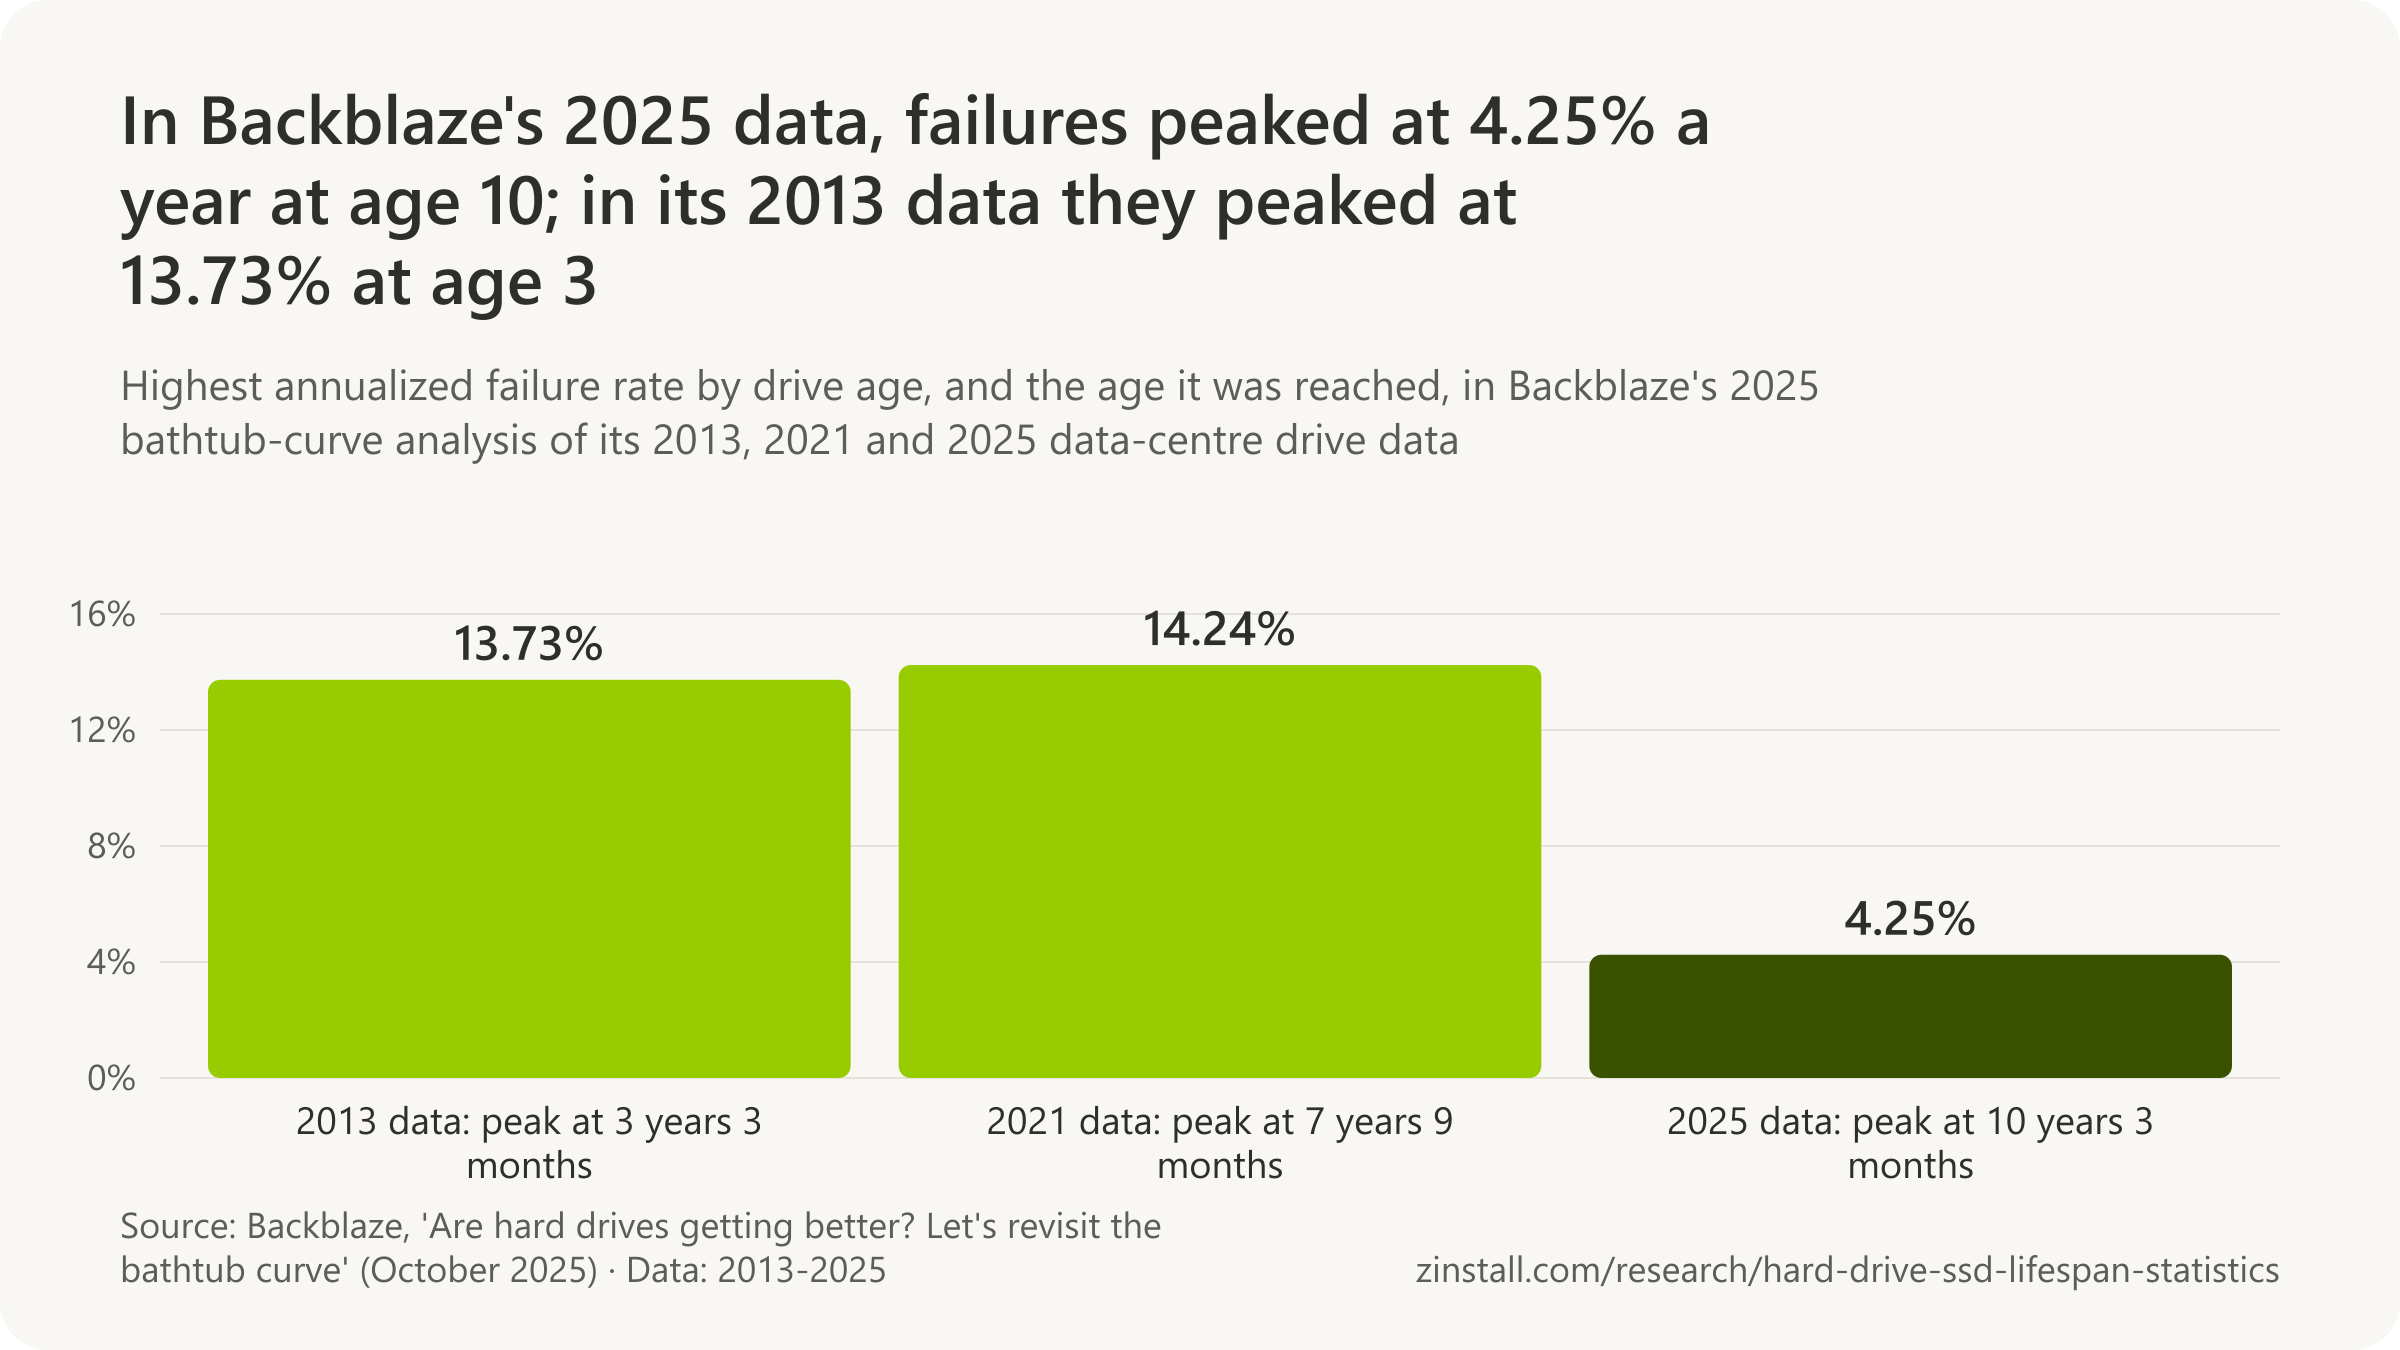
- Failures in a cloud fleet peaked at 4.25% a year at age 10 in 2025 data, against 13.73% at about three in 2013.
- None of over 60 drive models showed a sudden onset of wear-out, across 5.3 million data-centre drives.
- The 17,155 drives that failed in a cloud fleet by 2023 averaged 2 years 6 months old: an age at failure, not a lifespan.
- A cloud fleet's oldest working data drive had run 8.8 years in mid-2023.
| Source, measure and date | Figure |
|---|---|
| Still working after four years, 2013 data | 78% |
| Expected to be working at six years, October 2021 analysis | 88% |
| Median life, December 2021 estimate (extrapolated) | 6 years 9 months |
| Median life, 2013 projection | over 6 years |
| Failure rate in the first year of service, 2025 data | under 1.30% |
| Average age of the drives that had failed, 2024 | 2 years 10 months |
| Age at which working drives were replaced by denser ones, 2018 | about 4 years |
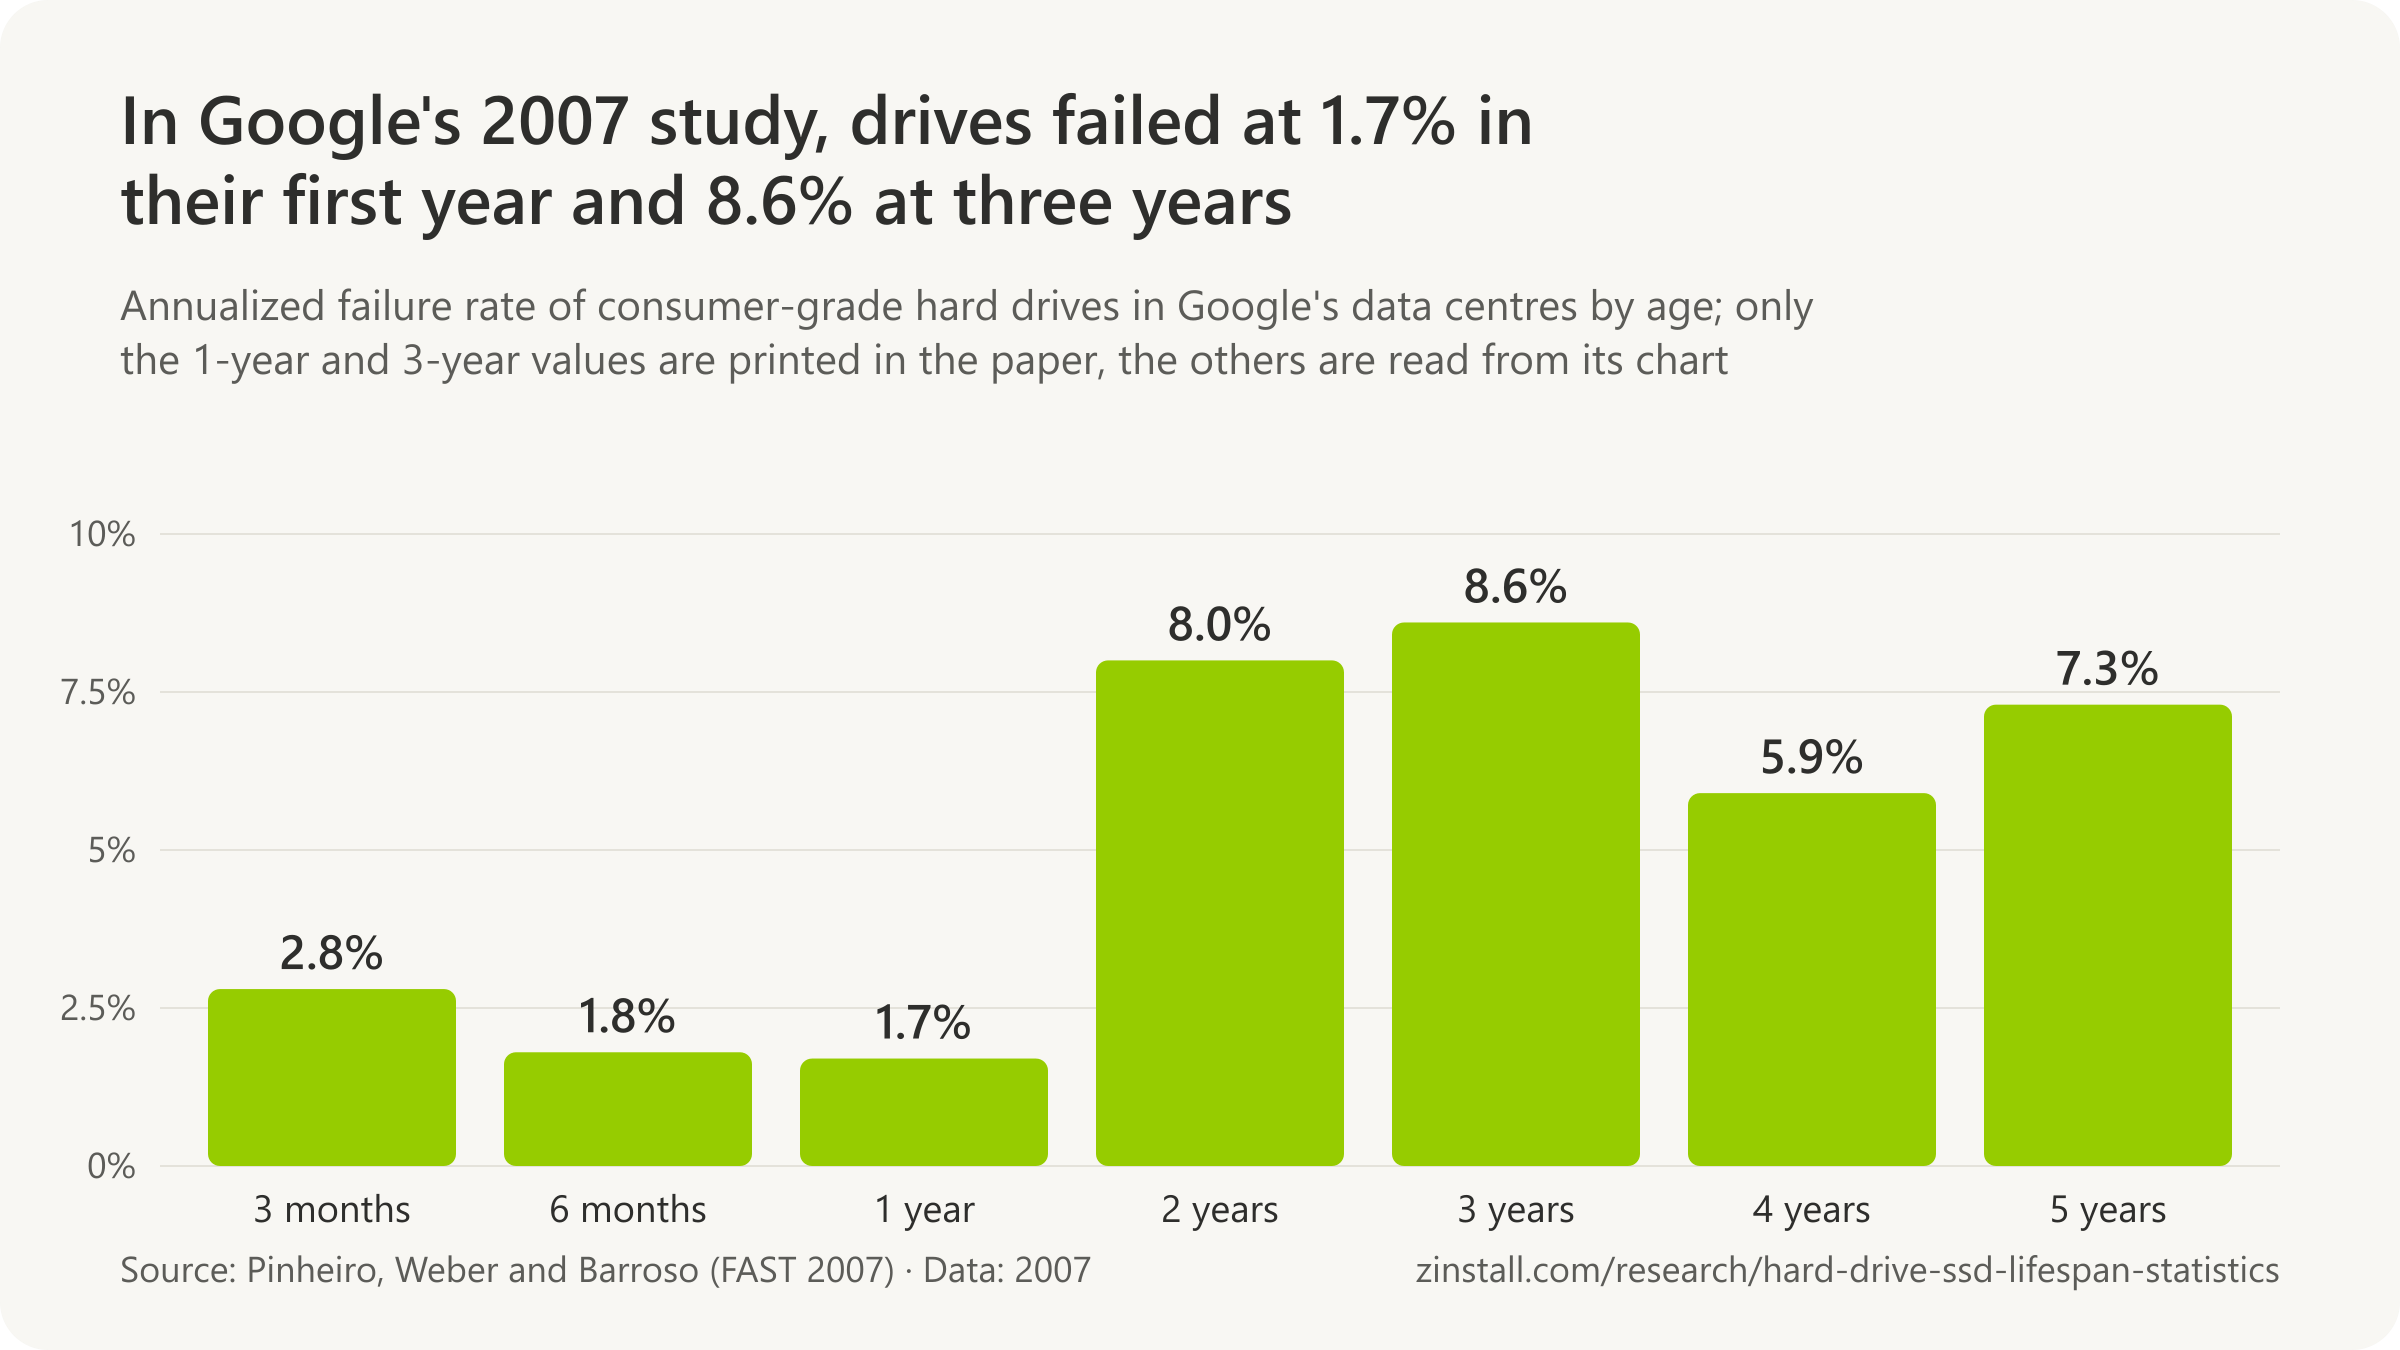
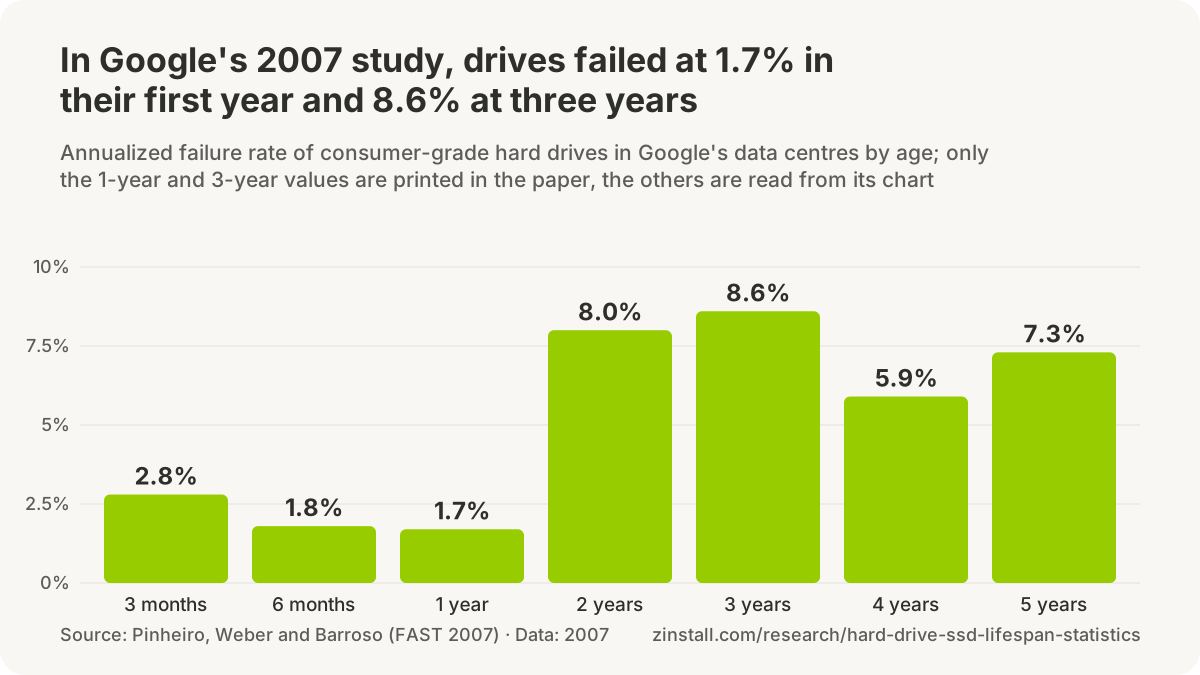
| Google: failure rate in the first year, 2007 | 1.7% |
| Google: failure rate at three years, 2007 | 8.6% |
| Carnegie Mellon: replacement rates by year of use, 2007 | about 2x |
Sources: Backblaze (2013-2025); Carnegie Mellon University (2020, 2007); Google
Related guides: An old hard drive to a new PC · A broken or dead computer · Windows detected a hard disk problem
More statistics (44)
No study has followed home PCs' drives to the end, so the measured answers come from data centres and from the drives sent to recovery labs. Backblaze's survival counts show most of its hard drives outliving four years, and the age at which failures peak has moved later since 2013. The textbook bathtub curve, many early failures then a long quiet stretch, did not show up in the largest studies; the average age of drives that failed is a different measure from how long drives last.
How many drives survive four and six years
- 78% of the hard drives Backblaze bought were still working after four years, by its count of about 25,000 data-centre drives (Backblaze, 2013).
- Over 6 years is the median lifespan Backblaze projected in 2013 for its data-centre hard drives, extrapolated from four years of survival data (Backblaze, 2013).
- 80% of the hard drives Backblaze deploys function for at least four years, by its own experience as stated in 2015 (Backblaze, 2015).
- About 90% of the hard drives Backblaze owned had lasted four years, by its 2021 survival analysis of over 200,000 data-centre drives (Backblaze, 2021).
- 65% of the hard drives Backblaze owned were still working after six years, by its 2021 survival analysis of over 200,000 data-centre drives (Backblaze, 2021).
- 6 years and 9 months is Backblaze's estimate of the median life of its data-centre hard drives, extrapolated from six years of survival data (Backblaze, 2021).
- 2% to 2.5% of Backblaze's hard drives were lost each year in their first four years, after which losses accelerated, by its 2021 survival analysis (Backblaze, 2021).
- 88% of Backblaze's hard drives were expected to be alive at six years in 2021, against 50% in its 2013 data, by Backblaze's bathtub-curve analysis; its survival analysis two months later, a different method, put six-year survival at 65% (Backblaze, 2021).
- 362 days (8,687 power-on hours) was the median running time before failure among 5,106 failed hard drives sent to Secure Data Recovery from 2023 to mid 2026 (Secure Data Recovery, 2026).
- 5,536 power-on hours was the median at failure for the Western Digital hard drives sent to Secure Data Recovery from 2023 to mid 2026, against 15,070 for Seagate, 7,639 for Toshiba and 14,348 for Hitachi (Secure Data Recovery, 2026).
When in its life a drive fails: the bathtub curve
- 5.1% of Backblaze's hard drives failed each year at 0 to 18 months of age, in its 2013 study of about 25,000 data-centre drives (Backblaze, 2013).
- 1.4% of Backblaze's hard drives failed each year at 18 months to 3 years of age, in its 2013 study of about 25,000 data-centre drives (Backblaze, 2013).
- 11.8% of Backblaze's hard drives failed each year once they were older than three years (to four years, the end of its data), in its 2013 study of about 25,000 data-centre drives (Backblaze, 2013).
- Under 1.30% of Backblaze's hard drives failed on an annualized basis in their first year of service, in its 2025 bathtub-curve analysis (Backblaze, 2025).
- About 1.0% a year was the failure rate of Backblaze's Seagate 8TB drives for their first 60 months, the profile Backblaze calls normal before failures rise with age (Backblaze, 2024).
- Hard drive replacement rates nearly doubled from year 1 to year 2, or from year 2 to year 3, in a five-year supercomputer log, rising steadily rather than levelling off as the bathtub curve assumes (Carnegie Mellon University, 2007).


- 24% of hard drives more than seven years old were replaced in a year, among 432 Fibre Channel drives deployed in 1998 at an internet service provider and logged in 2005 (Carnegie Mellon University, 2007).
- About 1.4% of SATA hard drives were replaced in their first year of age in high-performance computing clusters (Carnegie Mellon University, 2007).
- About 2.4% of SATA hard drives were replaced in their second year of age in high-performance computing clusters (Carnegie Mellon University, 2007).
- About 2.9% of SATA hard drives were replaced in their third year of age in high-performance computing clusters (Carnegie Mellon University, 2007).
- 63% to 66% of the failed hard drives of three SATA models failed in their fourth year of service, so drives installed together tended to fail together, in EMC backup appliances (EMC, 2015).
- None of over 60 hard drive makes and models showed a sudden onset of wear-out: failure rates rose gradually with age instead, across 5.3 million drives at Google, NetApp and Backblaze (Carnegie Mellon University, 2020).
- Within 20 days of deployment the failure rate of most hard drive models dropped sharply and levelled off, at Google and NetApp, while Backblaze's drives showed a longer, higher infancy (Carnegie Mellon University, 2020).
- 50% of the first-year failures of PC components sold by a large French online retailer were reported within a month and a half of shipping, and 25% within 10 days, by hardware.fr's count (hardware.fr, 2014).
The age of drives that failed
- 2 years and 6 months was the average age of the 17,155 hard drives that failed in Backblaze's data centres from April 2013 to March 2023 (Backblaze, 2023).
- 2 years and 7 months was the average age of 3,379 failed hard drives from models Backblaze had fully retired, which can no longer fail or age (Backblaze, 2023).
- 2 years and 10 months was the average age of the 21,388 hard drives that had failed in Backblaze's data centres by March 2024 (Backblaze, 2024).
- Close to 4 years is the average age at failure Backblaze predicted in 2024 for its retired drive models once its 4TB drives leave service (Backblaze, 2024).
- About 4 years of service was when Backblaze found it made financial sense in 2018 to replace working drives with denser ones, retiring 4TB drives at 3.5 to 4 years old (Backblaze, 2018).
- 8.8 years was the age of Backblaze's oldest working data drive in mid-2023, a Seagate 4TB, while its oldest working drive overall, a WDC 500GB boot drive, had run 10.2 years (Backblaze, 2023).
- Nearly 100 of Backblaze's Seagate 4TB hard drives ran more than 100 months (over eight years) before being retired, out of a model that peaked at 34,744 drives in 2016 (Backblaze, 2024).
- 0.86% is the lifetime annualized failure rate of Backblaze's Seagate 6TB hard drives at an average age of nine years, with zero failures in Q1 2024 (Backblaze, 2024).
- 1.33% is the collective lifetime annualized failure rate of Backblaze's hard-drive models that were six or more years old in mid-2025 (Backblaze, 2025).
- Nearly 20% of the hard drives in Backblaze's data centres at the end of 2023 belonged to nine models averaging six years or more in age (Backblaze, 2024).
- 1 year and 8 months was the average age of Backblaze's 3,579 failed 12TB hard drives, against 4 years 7 months for its 76 failed 1TB drives, by Backblaze's count (Backblaze, 2023).
- 3.8 years (45.9 months) was the average age of the hard drives in Backblaze's Q2 2026 failure table, weighting each model's average age by its drive count (Backblaze data, 2026).
- Most of the hard drives sent to Japan Data Technology for recovery in 2009 had been made about four to five years earlier, among over 40,000 drives (Japan Data Technology, 2010).

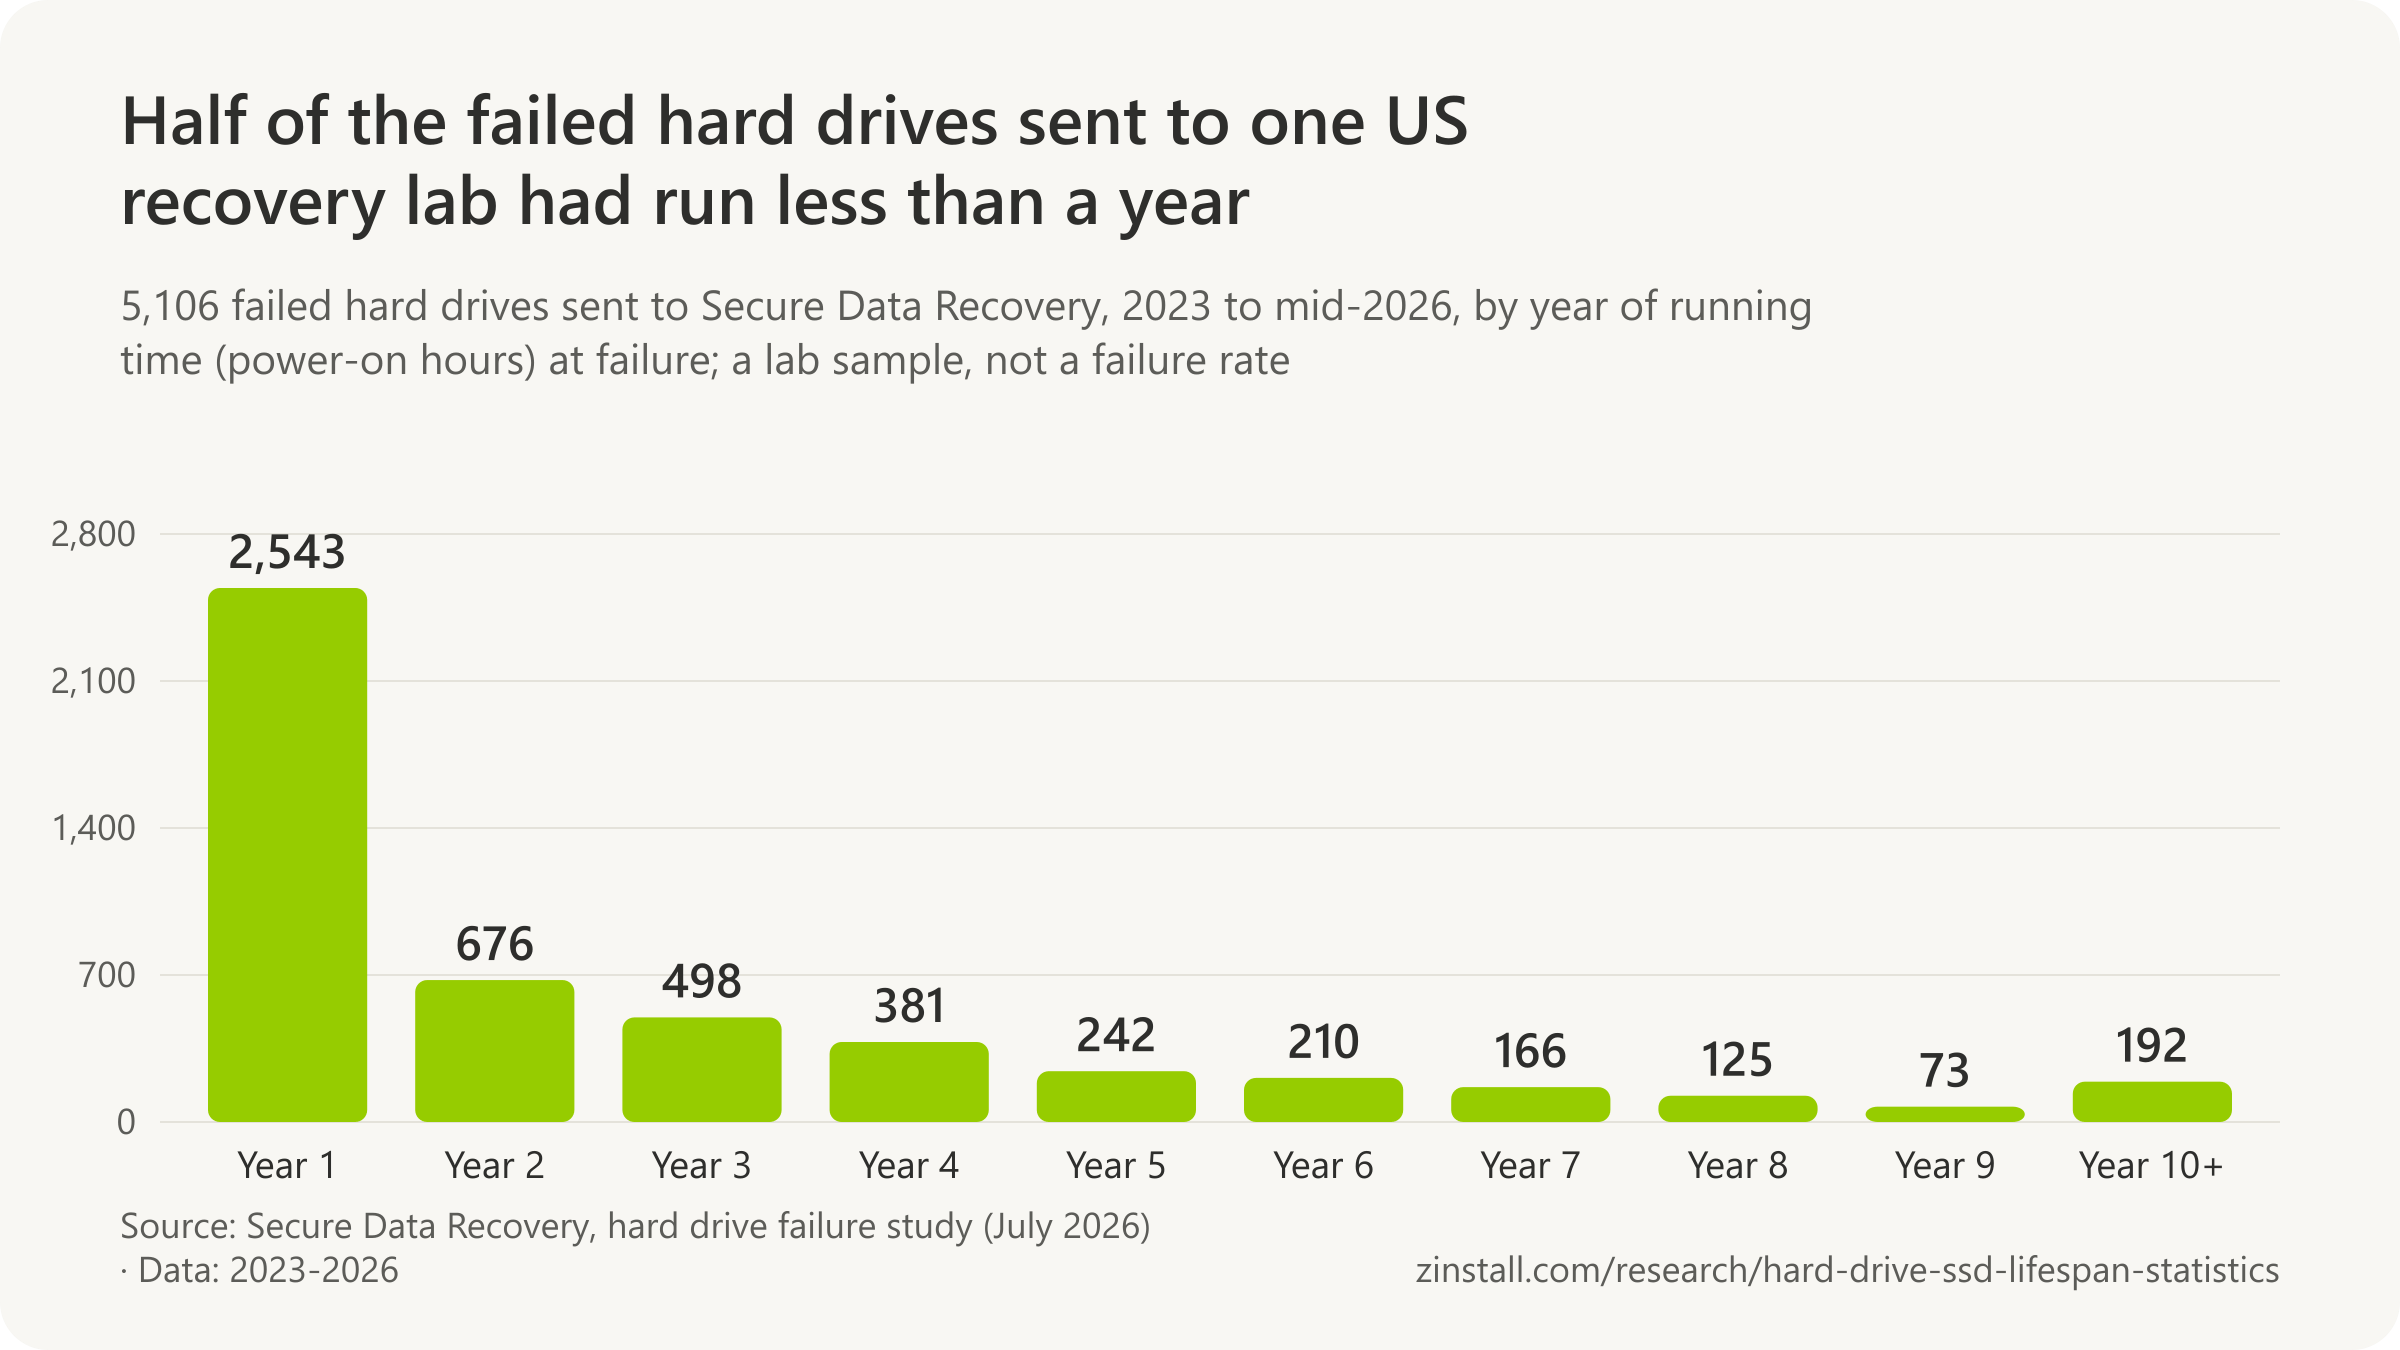
- 807 days (19,375 power-on hours, about 2 years 2 months) was the average running time before failure among 5,106 failed hard drives sent to Secure Data Recovery from 2023 to mid 2026 (Secure Data Recovery, 2026).
- 49.8% of the failed hard drives sent to Secure Data Recovery from 2023 to mid 2026 had run less than one year (8,760 power-on hours) when they failed, among 5,106 drives (Secure Data Recovery, 2026).
- The average running time before failure of the hard drives sent to Secure Data Recovery was 23.2% shorter in its 2023-2026 sample (807 days) than in its 2022 sample (1,051 days) (Secure Data Recovery, 2026).
- 25,233 power-on hours (1,051 days, about 2 years 10 months) was the average running time before failure among 2,007 failed hard drives sent to Secure Data Recovery in 2022 (Secure Data Recovery, 2023).
- 1,548 bad sectors (current pending sector count) was the average at failure among 2,007 failed hard drives sent to Secure Data Recovery in 2022 (Secure Data Recovery, 2023).
- 34,799 power-on hours was the average at failure for the Toshiba hard drives sent to Secure Data Recovery in 2022, the highest of six makers, against 25,676 for Western Digital, 23,298 for Seagate and 18,632 for Hitachi (Secure Data Recovery, 2023).
- The five most durable hard-drive models of each maker in Secure Data Recovery's 2022 sample of 2,007 failed drives were all made before 2015, and most of the least durable after 2015 (Secure Data Recovery, 2023).
Sources: Backblaze (2013-2026); Secure Data Recovery Services (2023, 2026); Carnegie Mellon University (2007, 2020); EMC Corporation and Datrium; Hardware.fr; Japan Data Technology; Google
How long do SSDs last?
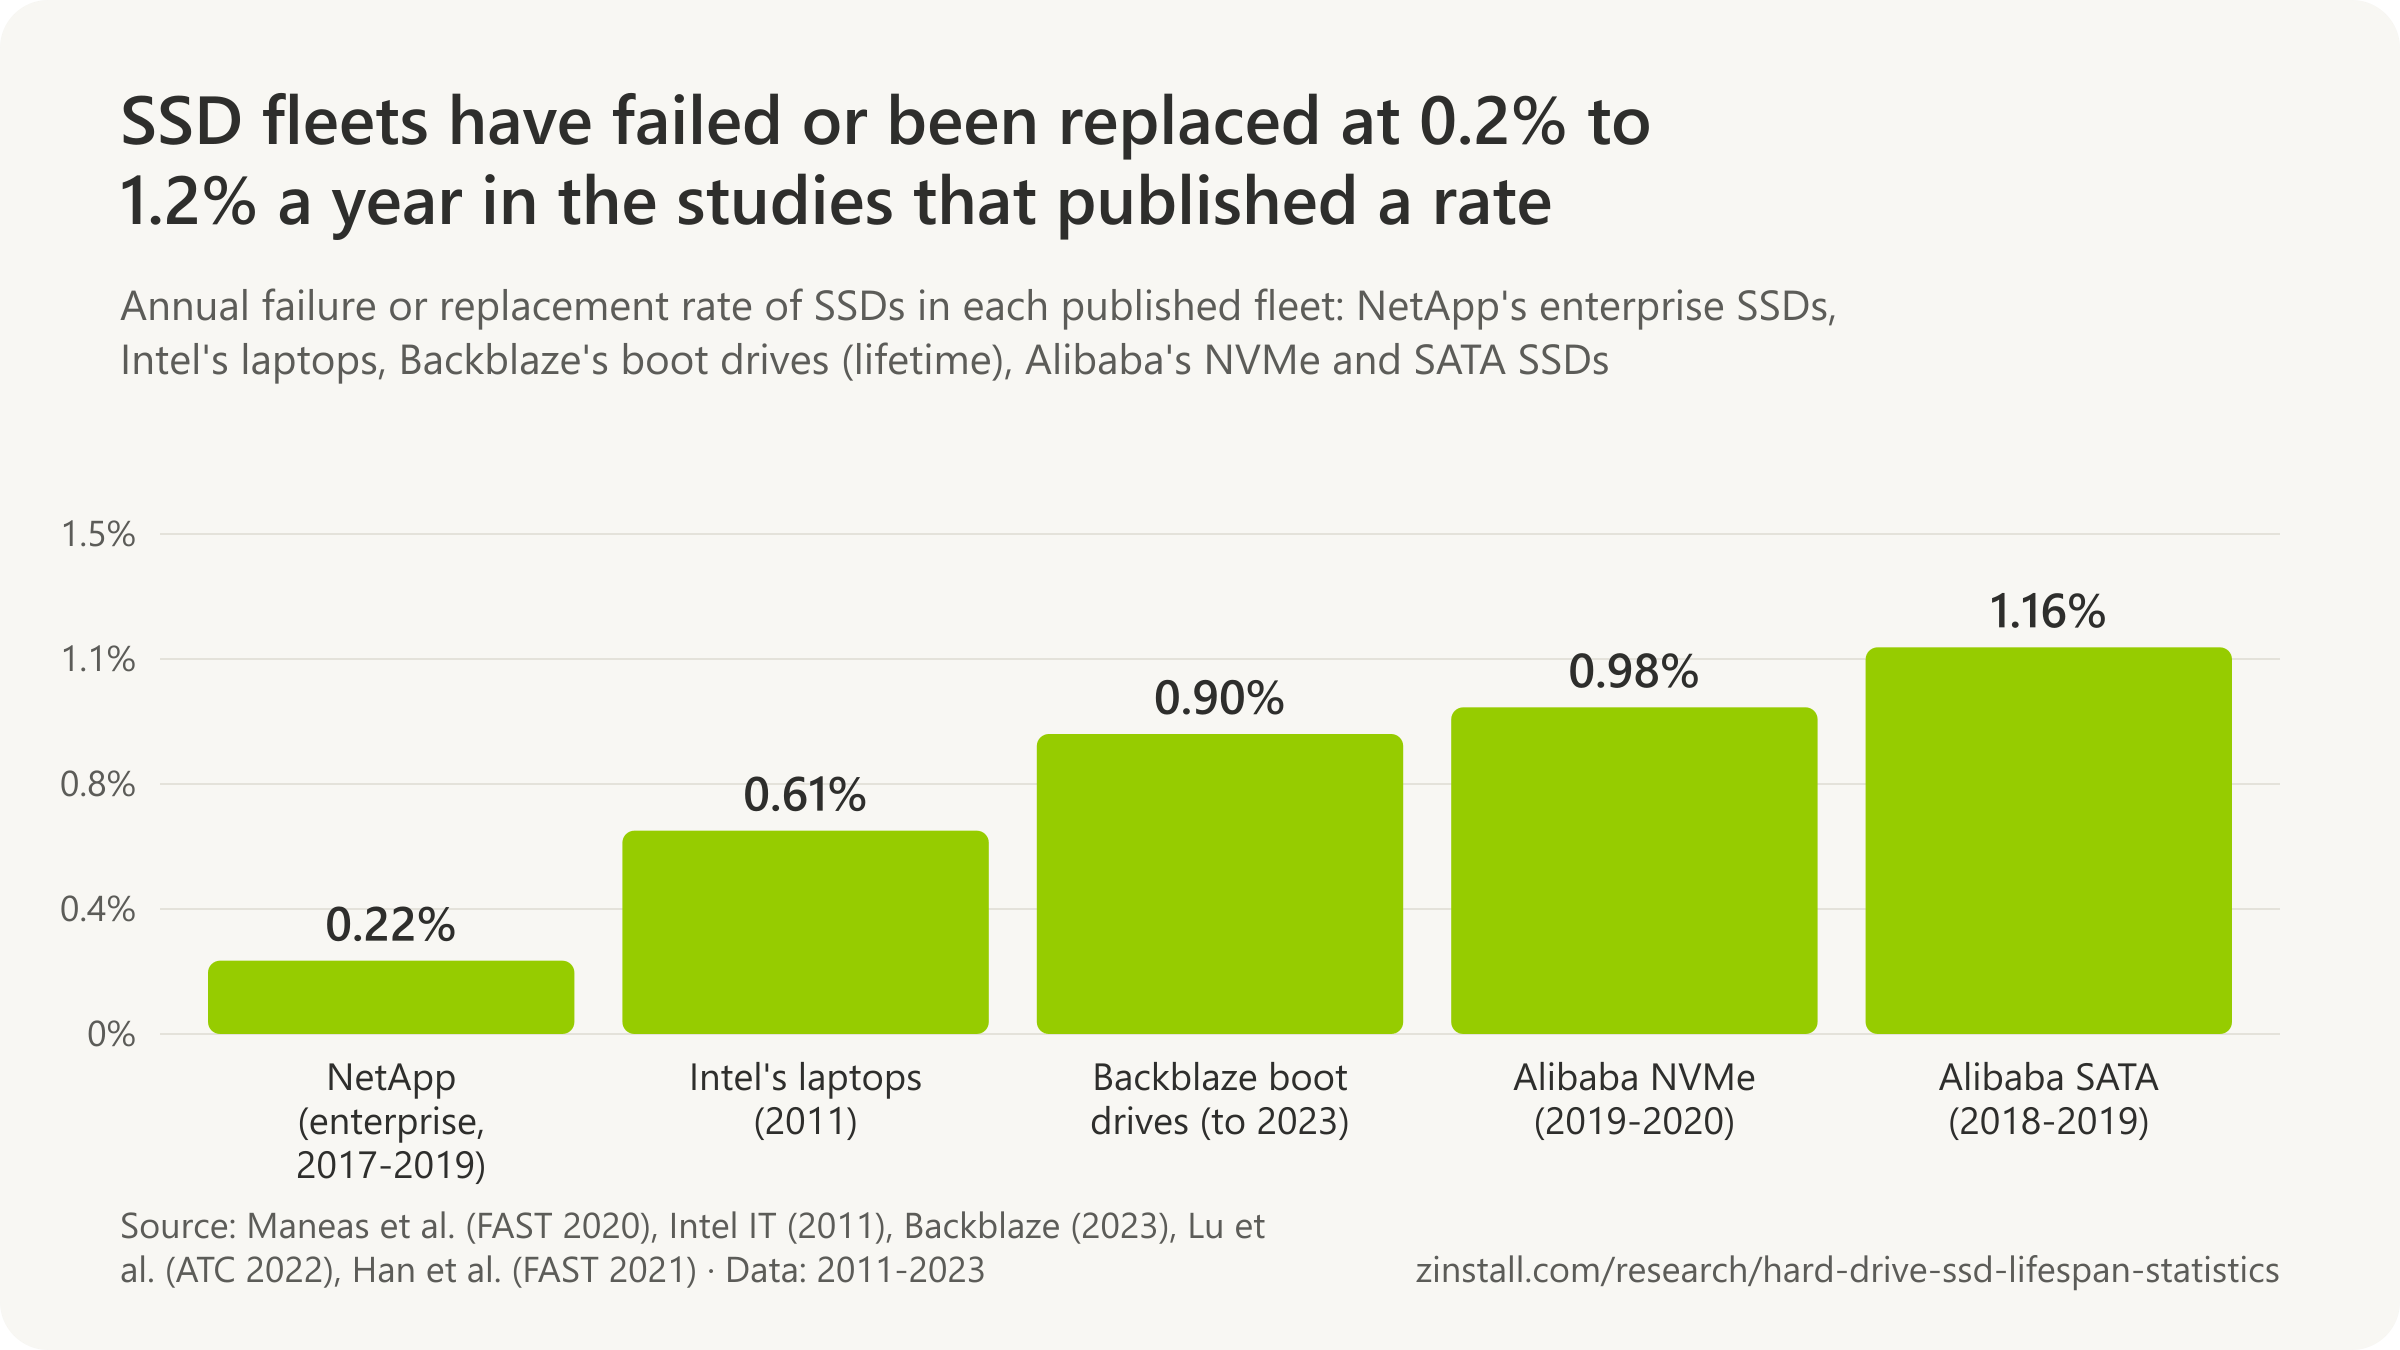
0.22% of enterprise SSDs at one storage maker's customers were replaced a year, 2017 to 2019 (Maneas et al., 2020).

- Almost 98% of SSD failures in a data centre came before half the rated write cycles were used (Alter et al., 2019).
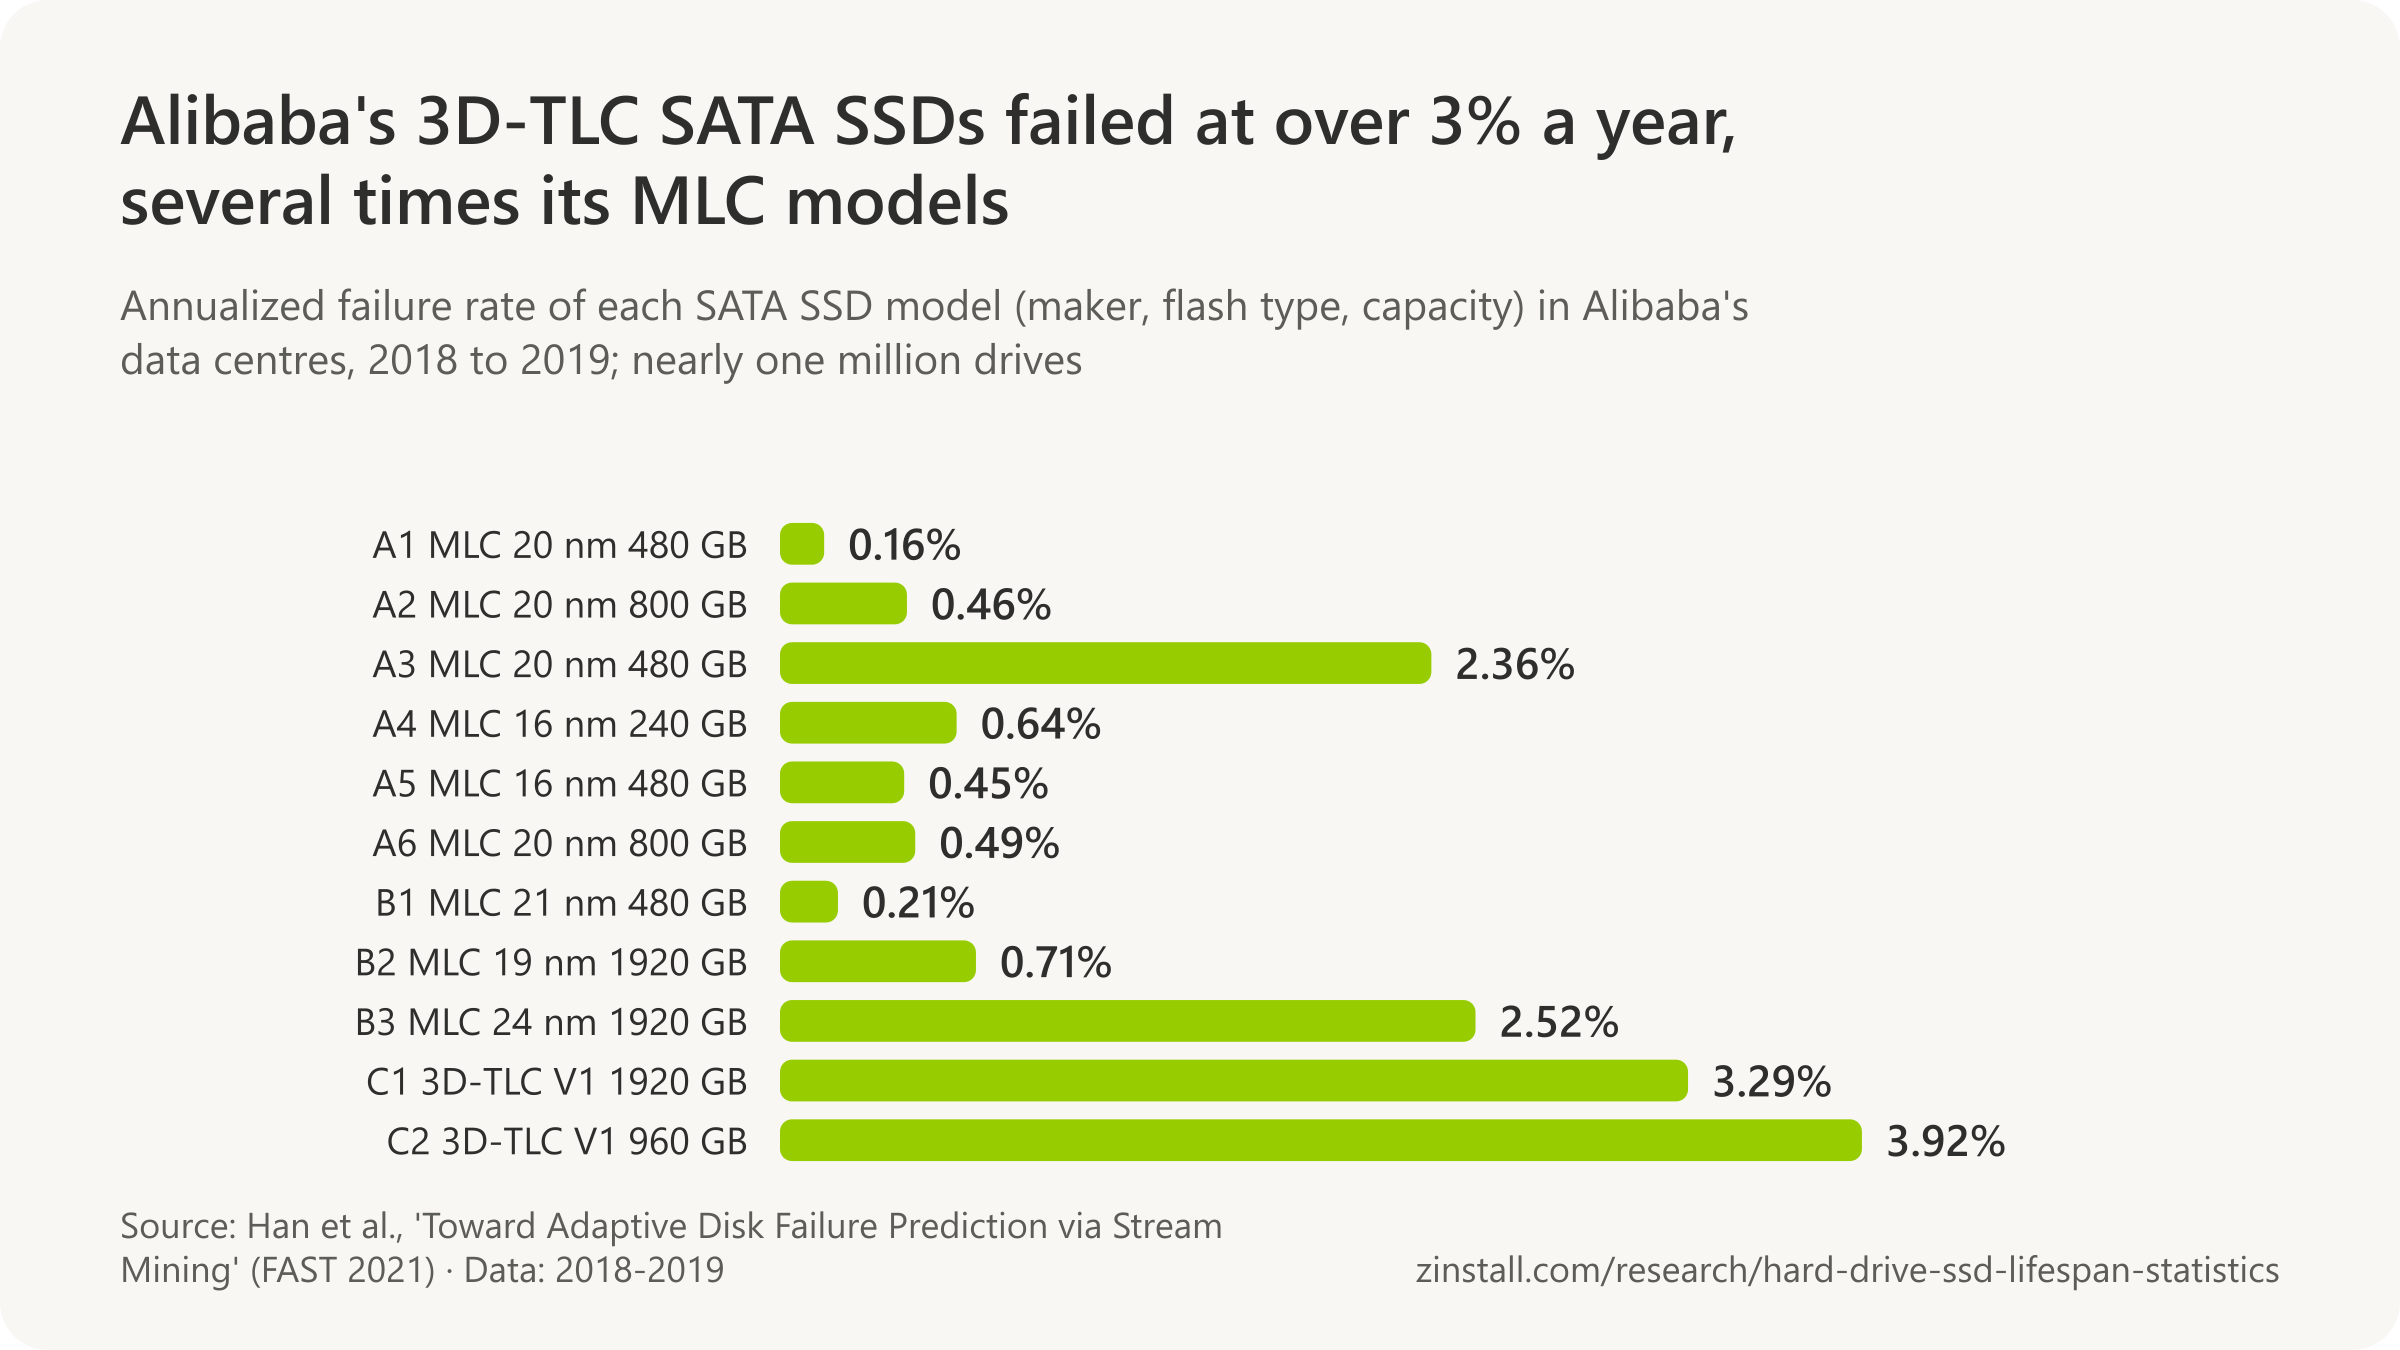
- Nearly one million SATA SSDs in Alibaba's data centres failed at 1.16% a year in 2018 and 2019.
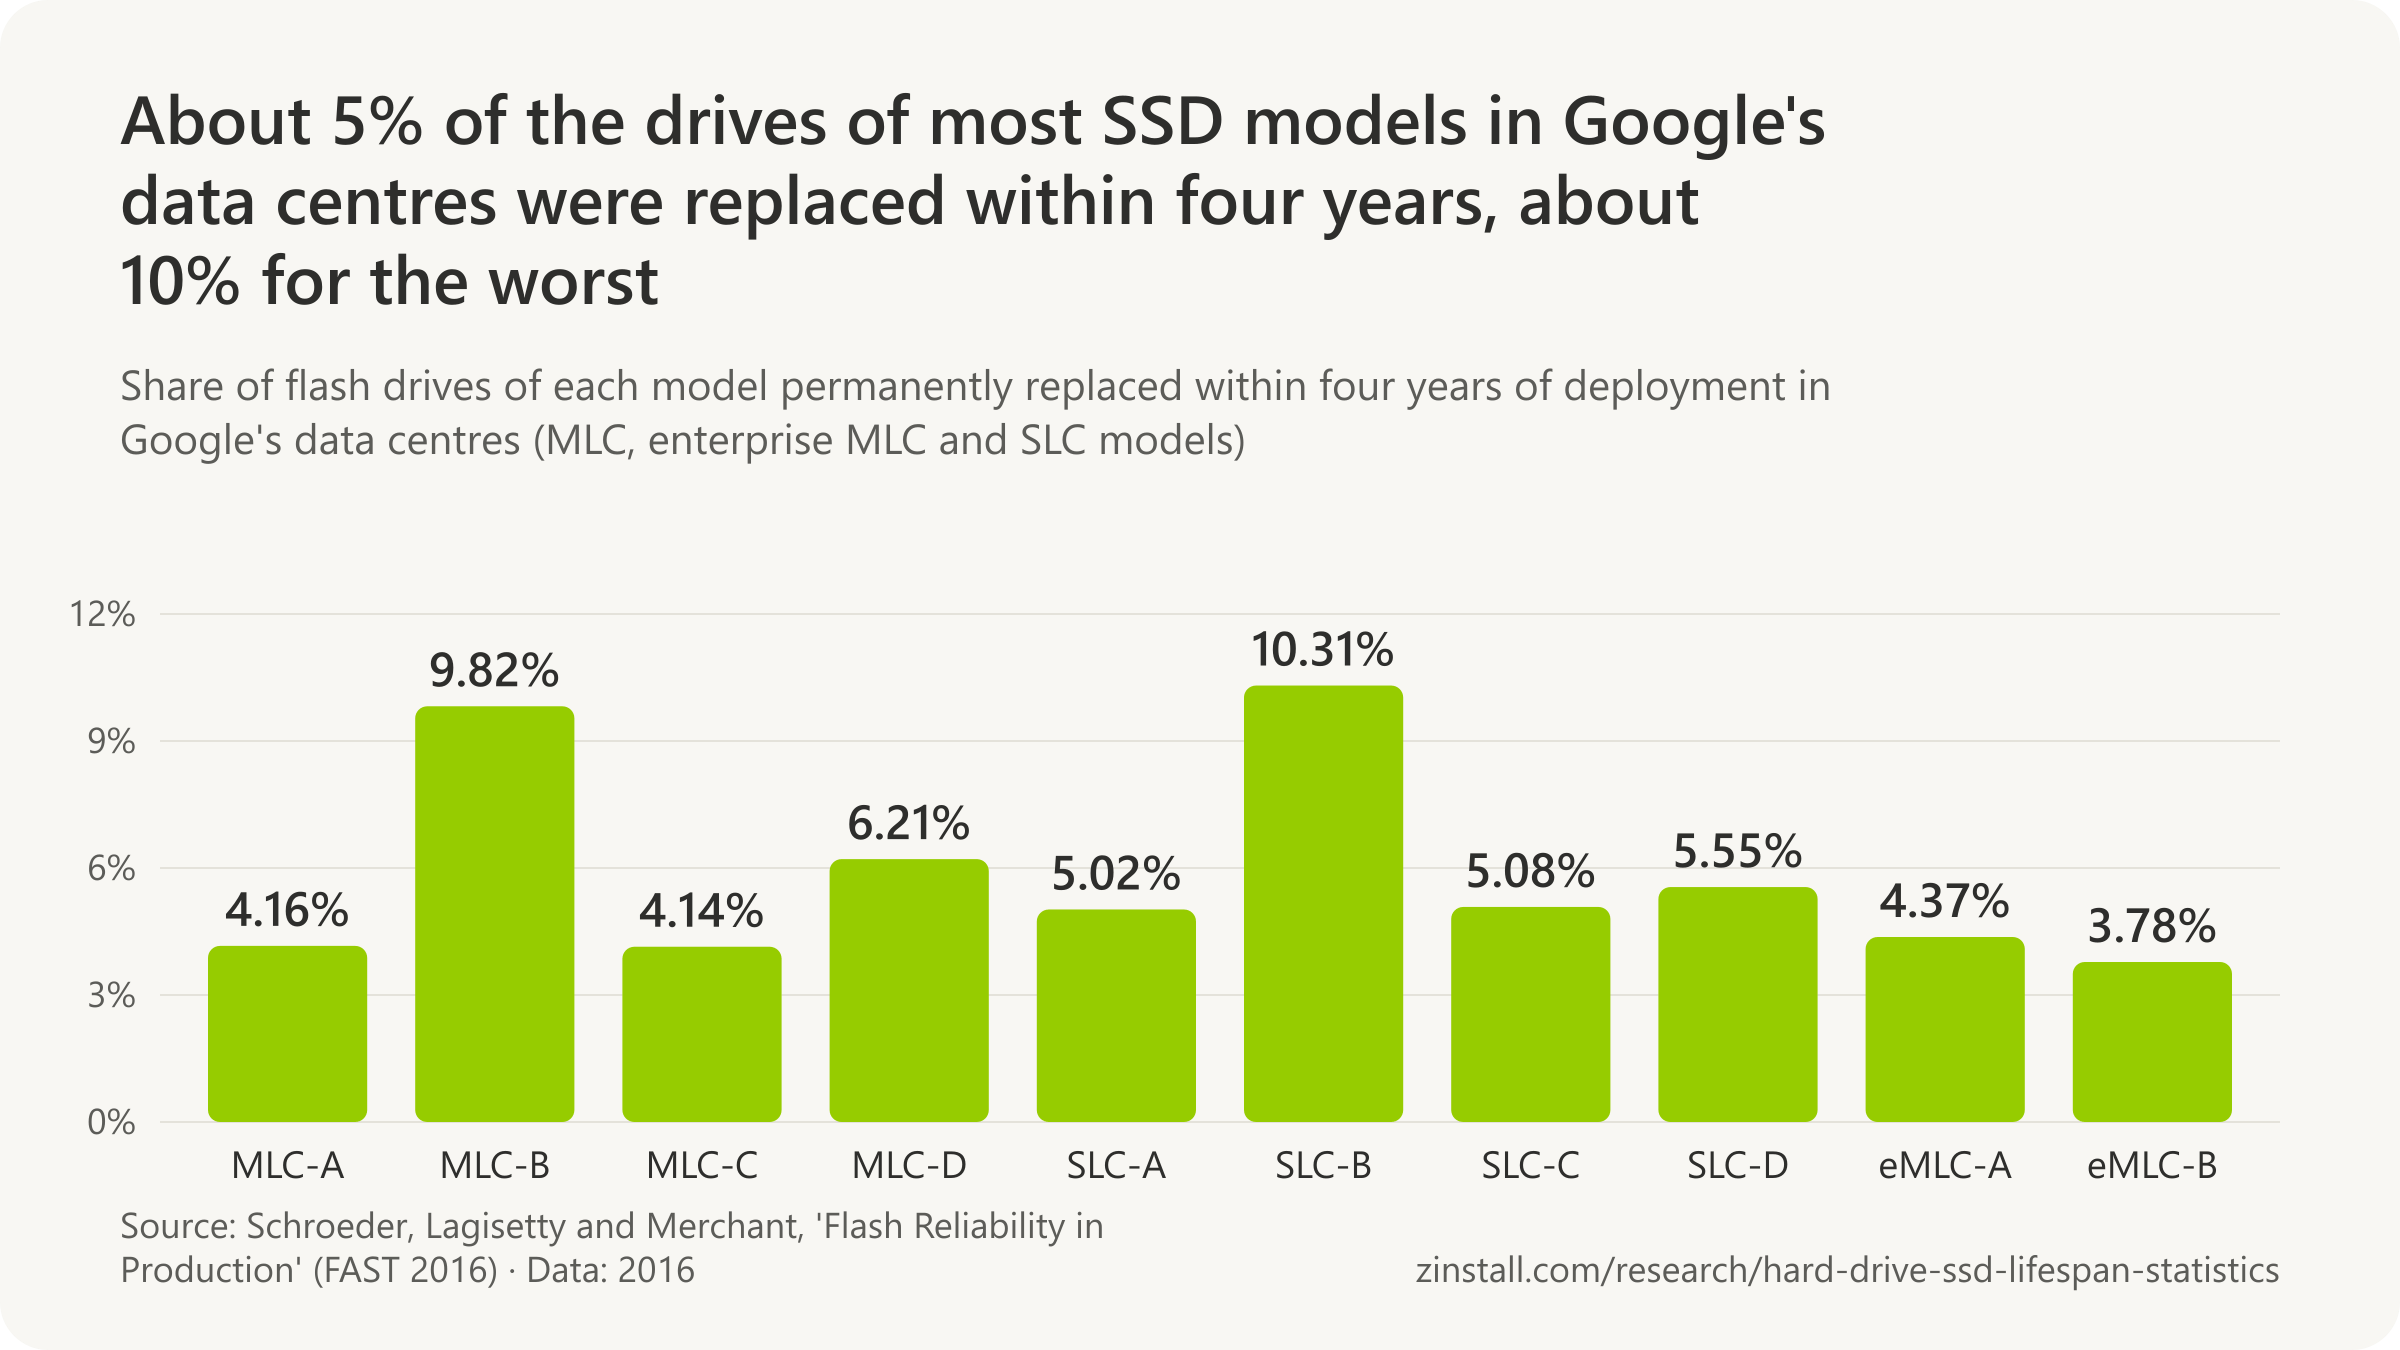
- About 5% of the drives of most SSD models in Google's data centres were replaced within four years.
- Denser 3D-TLC SSDs in NetApp's systems were replaced about 1.5 times as often as enterprise MLC drives with similar use.
- 0.74% of all the SSDs one US workstation builder has sold have failed.
| Fleet, measure and date | Figure |
|---|---|
| Alibaba: NVMe SSDs replaced a year, 2019-2020 | 0.98% (median 0.69%) |
| Alibaba: 3D-TLC SATA SSDs, 2018-2019 | over 3% (3.29%, 3.92%) |
| Microsoft: field failures above the makers' specification | up to 70% above spec |
| Google: swapped at least once in six years | 11.3% (6.95-14.3%) |
| Google: failures in the first 90 days | 25% in the first 90 days |
| NetApp: how long early failures lasted | 12-15 months |
| NetApp: earliest firmware against latest | up to 10x |
| Backblaze: average age of its failed SSD boot drives | 14 months |
| Tencent: Samsung enterprise NVMe SSDs, rough estimate | under 0.2% a year |
| Puget Systems: Kingston KC3000 NVMe SSDs, 2024 | 0.08% |
Sources: USENIX, Proceedings of the 18th USENIX Conference on File and Storage Technologies; ACM / IEEE, Proceedings of the International Conference; USENIX, Proceedings of the 19th USENIX Conference on File and Storage Technologies; USENIX, Proceedings of the 14th USENIX Conference on File and Storage Technologies; Puget Systems (2026, 2025); USENIX, Proceedings of the 2022 USENIX Annual Technical Conference; ACM, Proceedings of the 9th ACM International Systems and Storage Conference; Backblaze; USENIX, Proceedings of the 21st USENIX Conference on File and Storage Technologies; Intel Corporation, on Intel's own fleet and Intel's own SSD product
Related guides: A new PC with an SSD · Clone or transfer
More statistics (48)
SSD fleets in data centres fail or are replaced at rates of about a fifth of a percent to just over one percent a year, and almost never because they wore out their rated writes: in every study the drives used a small part of their endurance before they failed or were retired. Failures cluster early in some fleets and not in others, and a drive's model, firmware and capacity matter more than its age. Client data is scarce: Intel's laptops, Backblaze's boot drives and one workstation builder's records.
SSD failure and replacement rates by fleet
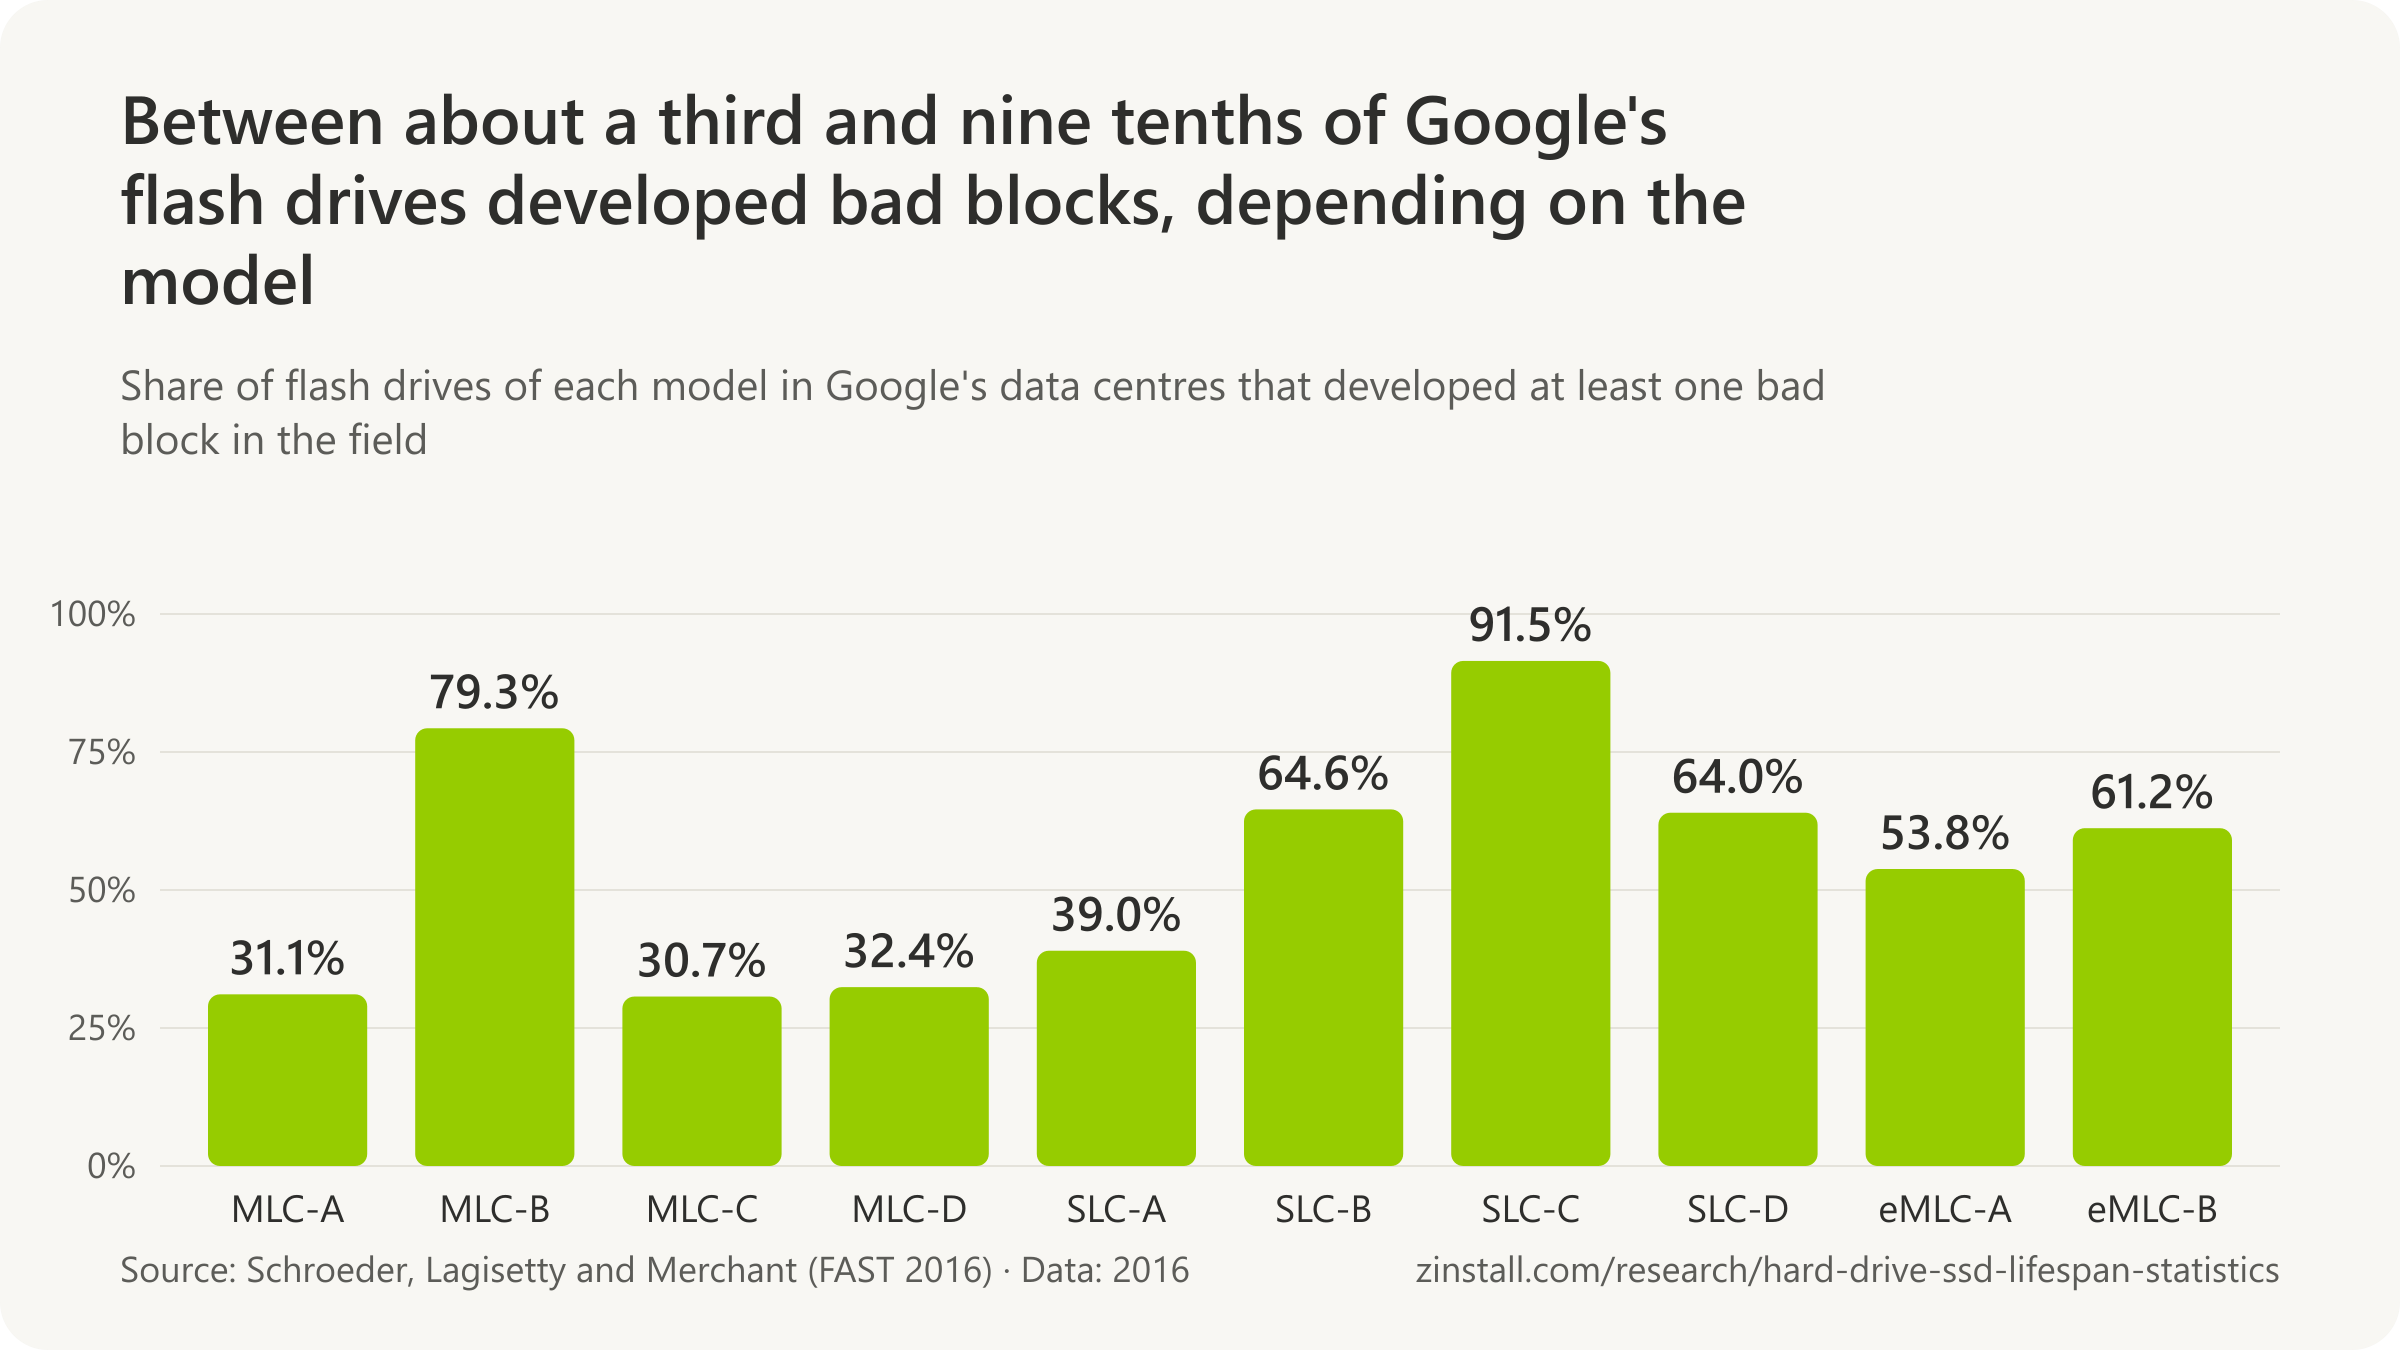
- About 5% of the drives of most flash-drive models in Google's data centres were permanently replaced within four years of deployment, and about 10% for the two worst models (Schroeder et al., 2016).
- About 1% to 2.5% of the flash drives in Google's data centres were replaced per year on average, spreading the 4% to 10% replaced over four years evenly (Schroeder et al., 2016; derived).
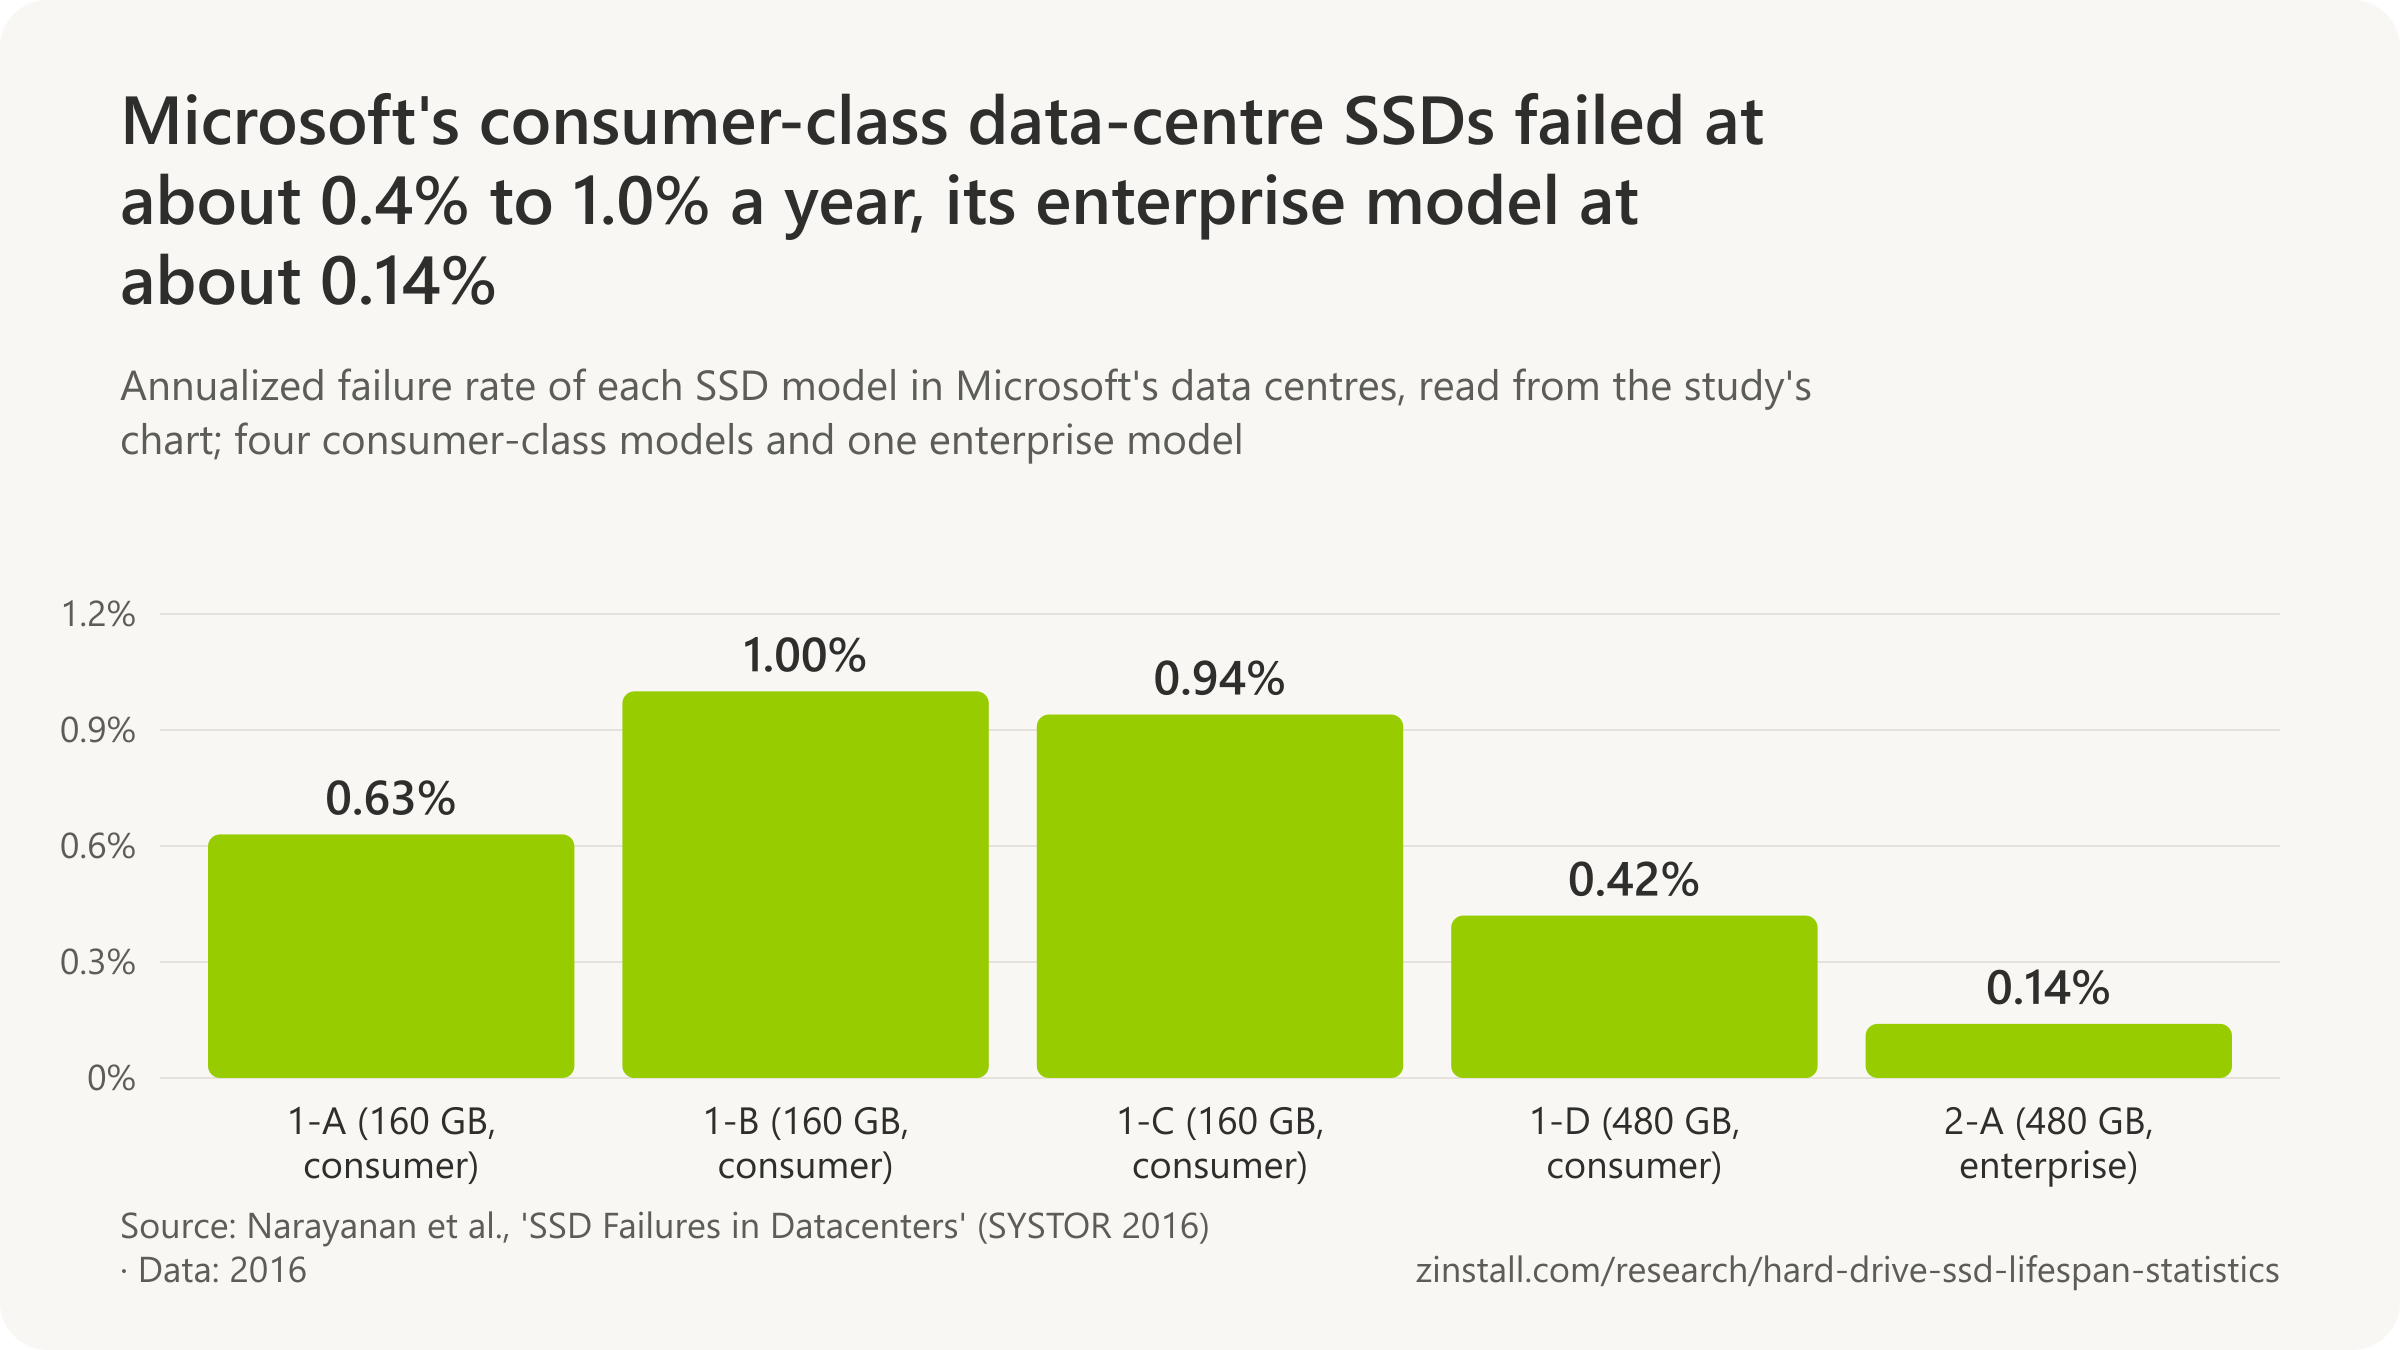
- Some models of the SSDs in Microsoft's data centres failed up to 70% more often in the field than the annualized failure rate in their makers' specifications (0.61% to 0.73%) (Narayanan et al., 2016).
- SSDs in Microsoft's data centres failed at an annualized rate of roughly 0.4% to 1.0% for four consumer-class models and roughly 0.14% for one enterprise-class model, as read from the study's chart (Narayanan et al., 2016).
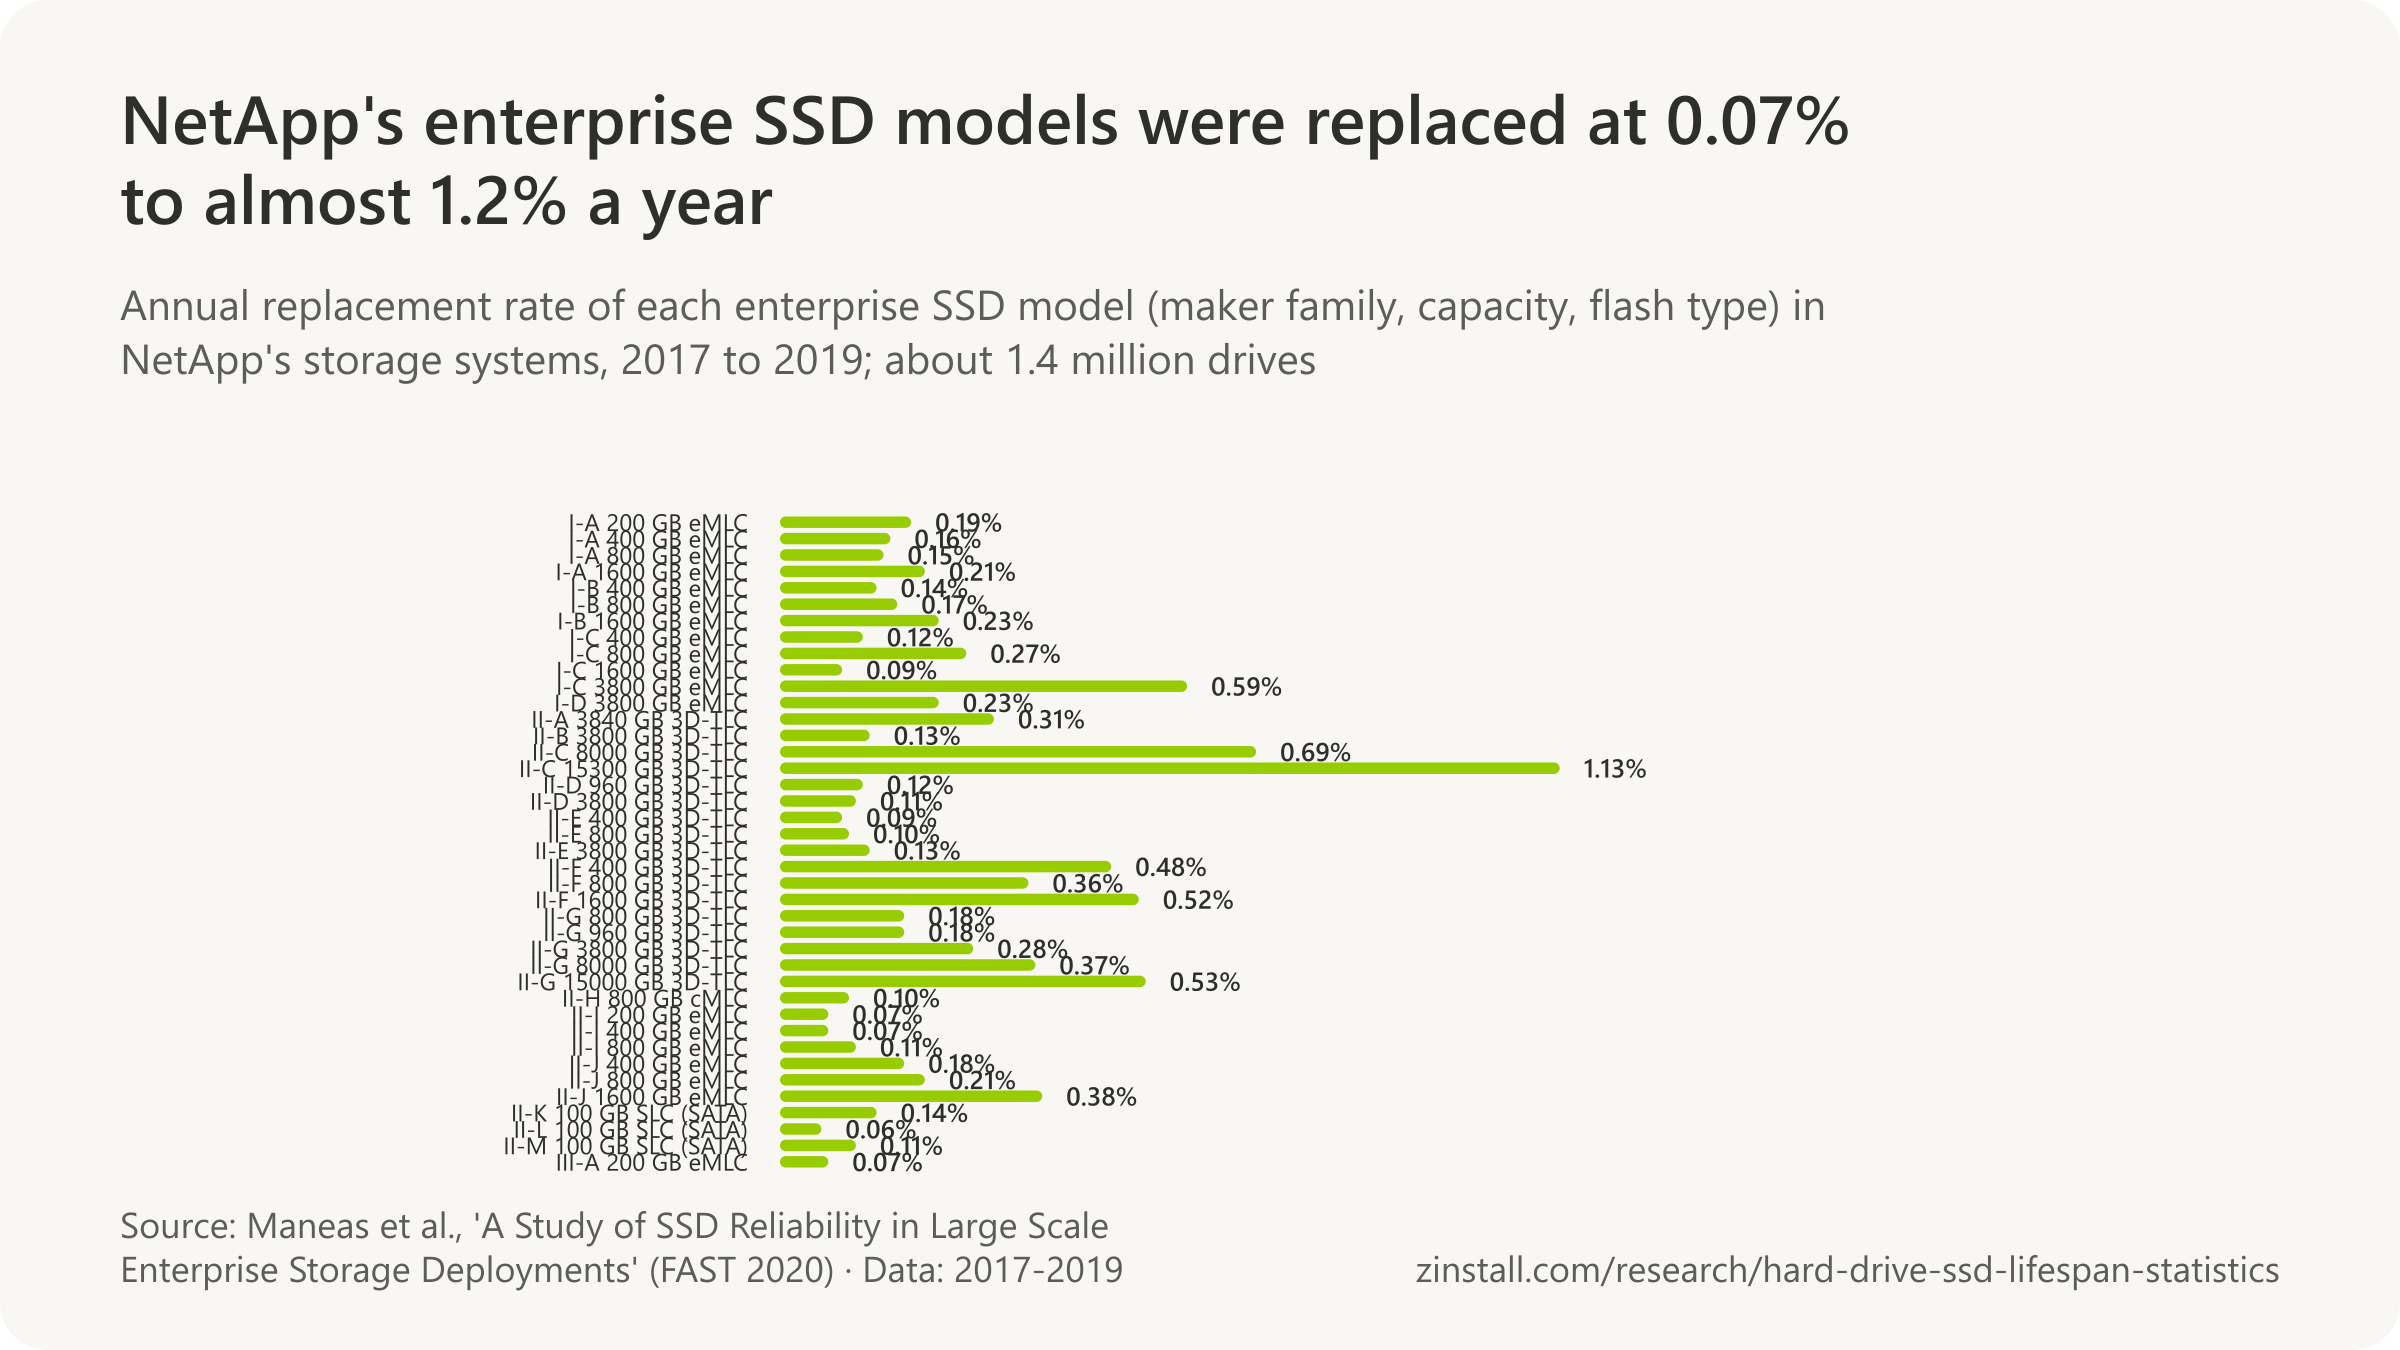
- Even the worst enterprise SSD model in NetApp's storage systems was replaced at 1.2% a year, at the low end of the 1% to 2.5% reported for Google's data-centre SSDs and below the 2% to 9% reported for hard drives (Maneas et al., 2020).
- 0.55% a year was the overall failure rate of Alibaba's enterprise-class MLC data-centre SSDs in 2018 and 2019, from 0.16% to 2.52% by model, which the authors called slightly lower than the 1% to 2.5% reported for Google's SSDs (Han et al., 2021).
- Alibaba's two 3D-TLC data-centre SSD models failed at more than 3% a year (3.29% and 3.92%) in 2018 and 2019, several times the 0.55% of its MLC SSDs (Han et al., 2021).
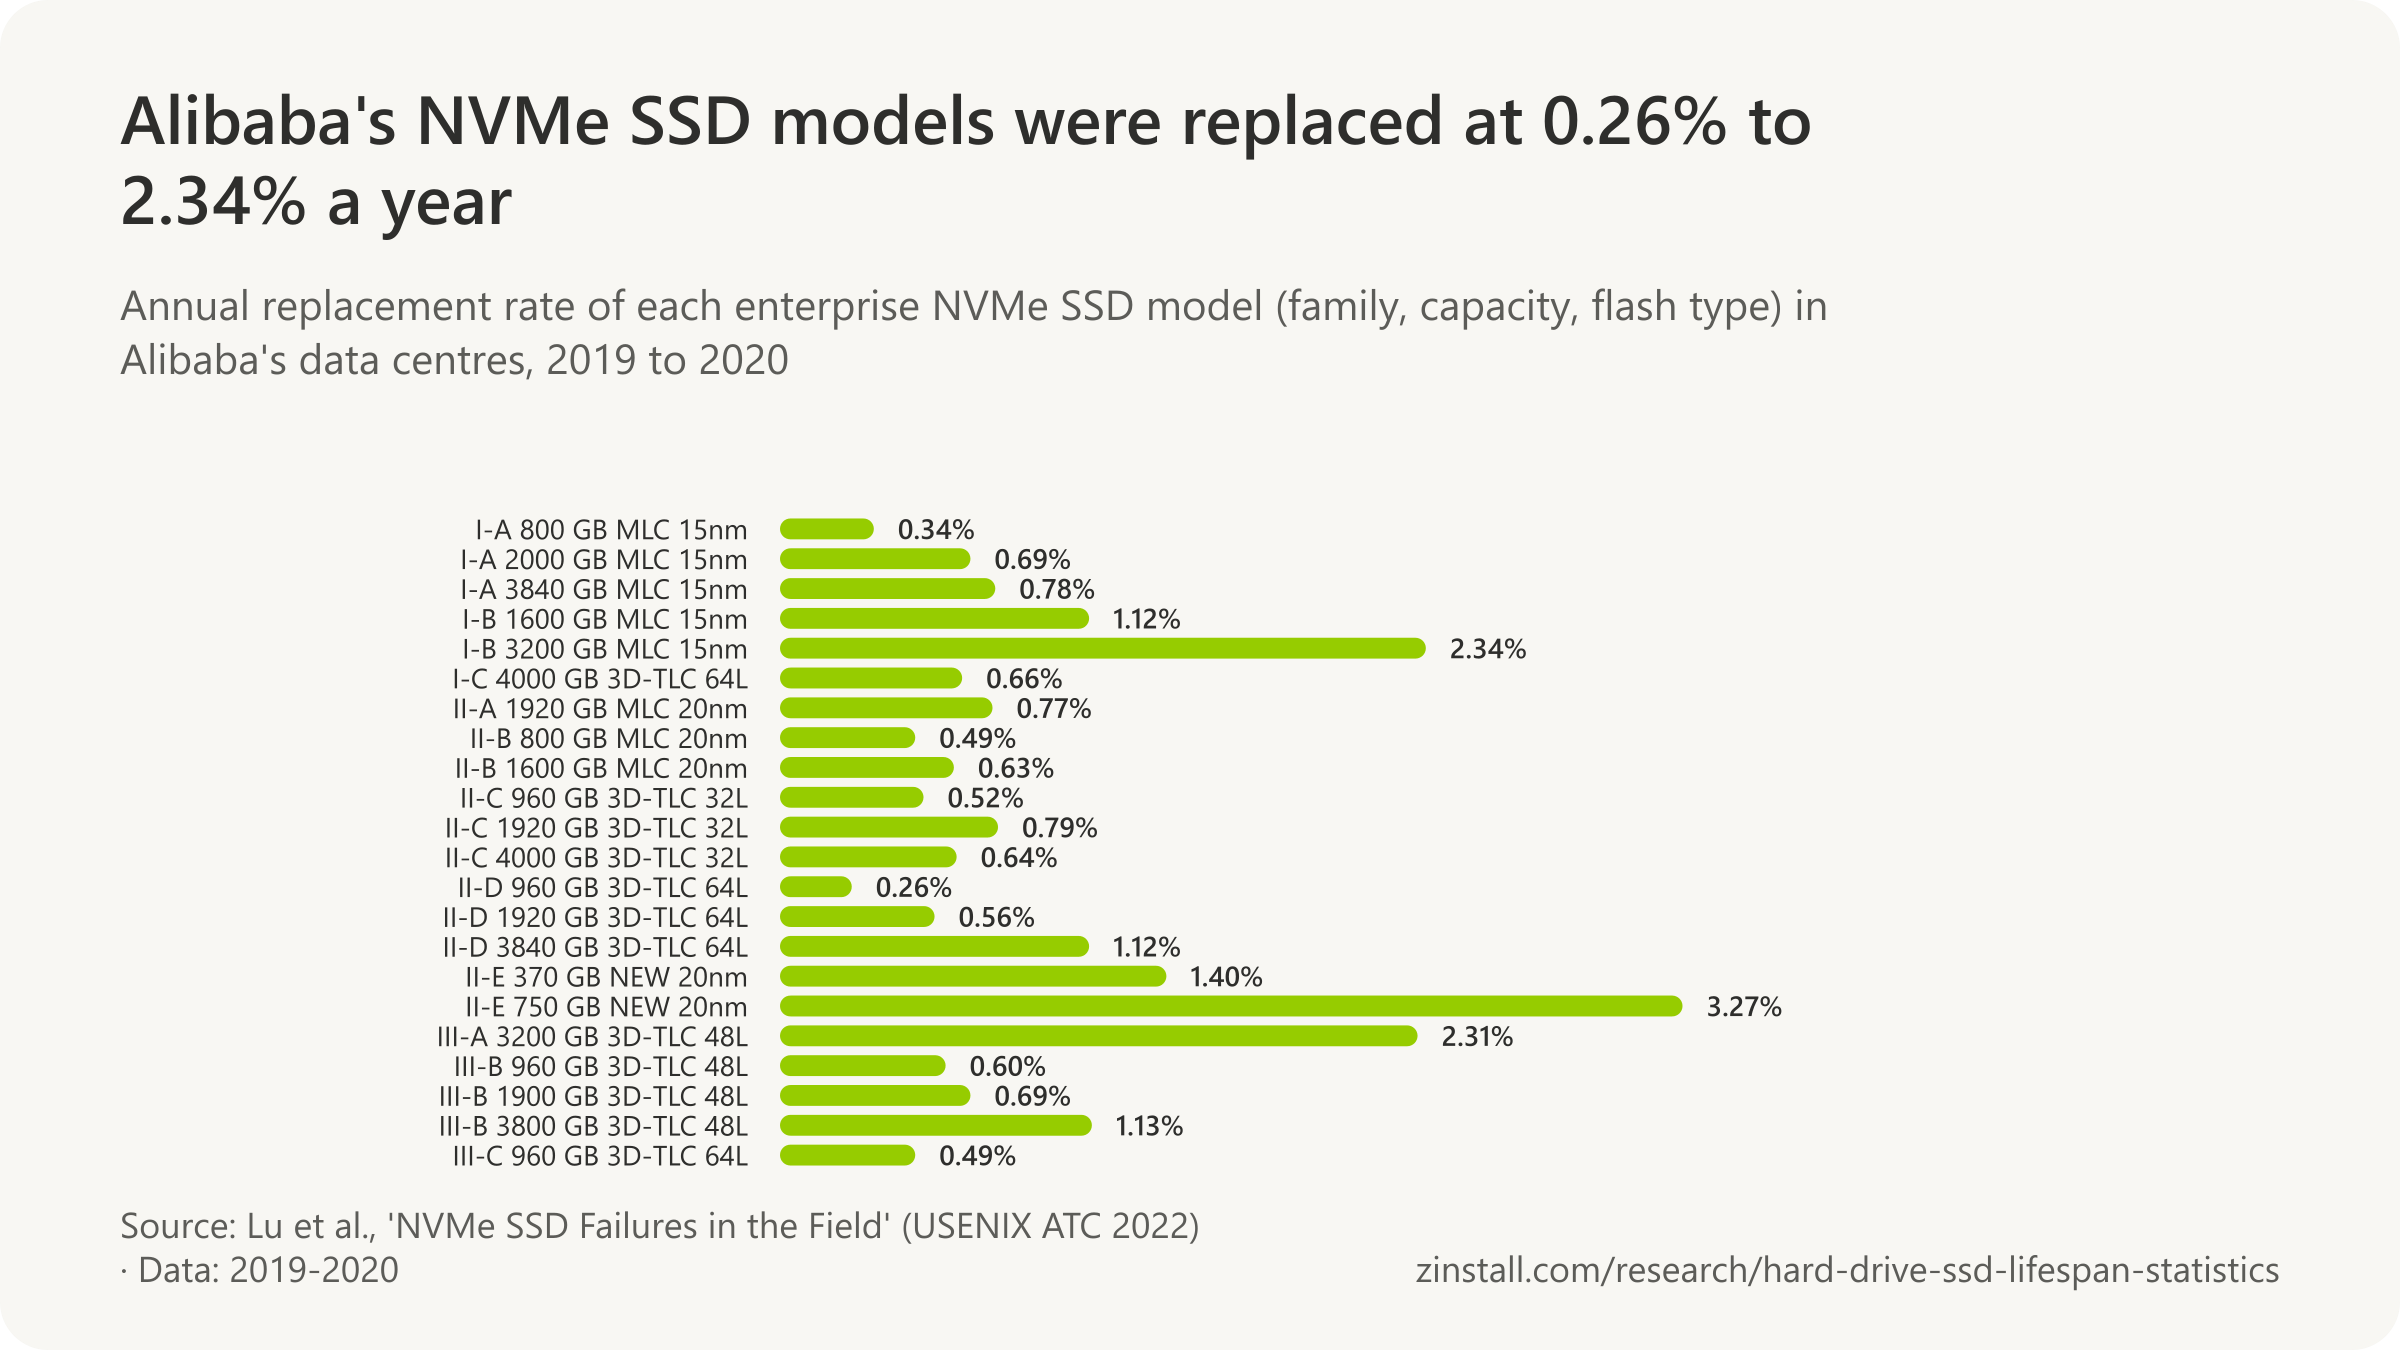
- Alibaba's MLC NVMe SSDs were replaced at 0.34% to 2.34% a year and its 3D-TLC NVMe SSDs at 0.26% to 2.31% in 2019-2020, so TLC was slightly better on average, the reverse of NetApp's SATA and SAS fleet (Lu et al., 2022).
- 6.95% to 14.3% of the MLC flash drives of three models in a Google data centre failed and were swapped out at least once over six years, 11.29% overall (Alter et al., 2019).
- Fewer than 0.2% a year of the more than 300,000 Samsung PM1733 and PM9A3 enterprise NVMe SSDs in Tencent's cloud had a failure recorded, by a rough count of 409 failure records in nine months (Zhang et al., 2023; derived).
By model, flash type and capacity





- Google's enterprise-grade SLC flash drives were not repaired or replaced less often than its cheaper MLC drives, and did not typically have fewer errors that reached the user (Schroeder et al., 2016).
- 3D-TLC enterprise SSDs in NetApp's storage systems were replaced about 1.5 times as often as enterprise MLC SSDs with similar use, and had used 10 to 15 times as much of their spare blocks (Maneas et al., 2020).
- Denser 1x-nm enterprise MLC SSDs in NetApp's storage systems were replaced almost twice as often as 2x-nm drives, while for 3D-TLC the older, lower-density V2 generation fared worse than V3 (Maneas et al., 2020).
- The 15 TB SSDs in NetApp's storage systems were always replaced more often than smaller drives of the same family, and their failures were more often sudden and severe (Maneas et al., 2020).
- Two 15 TB 3D-TLC enterprise SSD models from the same maker had annual replacement rates of 0.53% and 1.13% in NetApp's storage systems, so near-identical specifications did not mean equal reliability (Maneas et al., 2020).
- Enterprise SSDs in NetApp's storage systems running a model's earliest firmware could be replaced up to ten times as often as the same model on later firmware, yet 70% of drives stayed on one firmware version throughout (Maneas et al., 2020).
- For one model of Alibaba's NVMe SSDs, the monthly chance of failure was 0.02% in the first three months of service, 0.05% in months 4 to 12 and 0.35% in the most recent three months (Lu et al., 2022).
- Larger NVMe SSDs of the same family were replaced more often at Alibaba: in one family the annual rate rose from 0.26% for 960 GB drives to 1.12% for 3.84 TB drives (Lu et al., 2022).
When SSDs fail
- Flash drives in Google's data centres showed no significant infant mortality in uncorrectable errors, unlike Facebook's fleet, perhaps because the two companies burn in new drives differently (Schroeder et al., 2016).
- Failure rates of Facebook's server SSDs did not rise steadily with wear: they rose, fell, then rose again as more data was written (early detection, early failure, useful life and wear-out), unlike the classic bathtub curve (Meza et al., 2015).
- The early-life rise in failures of Facebook's server SSDs ended after about 3 TB to 10 TB had been written: 3 TB for 720 GB and 1.2 TB drives, 10 TB for 3.2 TB drives (Meza et al., 2015).
- Enterprise SSDs in NetApp's storage systems showed rising failure rates for their first 12 to 15 months, then 6 to 12 months of slowly falling rates before levelling off, so infant mortality took 20% to 40% of a typical five-year life (Maneas et al., 2020).
- During infant mortality, enterprise SSDs in NetApp's storage systems failed at 2 to 3 times the rate they showed later in life, and no rise in failures appeared towards the end of life (Maneas et al., 2020).
- Alibaba's enterprise NVMe SSDs showed no notable infant mortality: for nearly all models the failure rate in the first three months of service was the same as or lower than later (Lu et al., 2022).
- 15% of the SSD failures in a Google data centre came in the drives' first 30 days and 25% in their first 90 days; after that infancy the failure rate stayed roughly flat over six years (Alter et al., 2019).
- Past their first 90 days, the oldest MLC SSDs in a Google data centre failed about as often as younger ones over six years, so age alone did not make them more likely to fail (Alter et al., 2019).
Backblaze's SSD boot drives

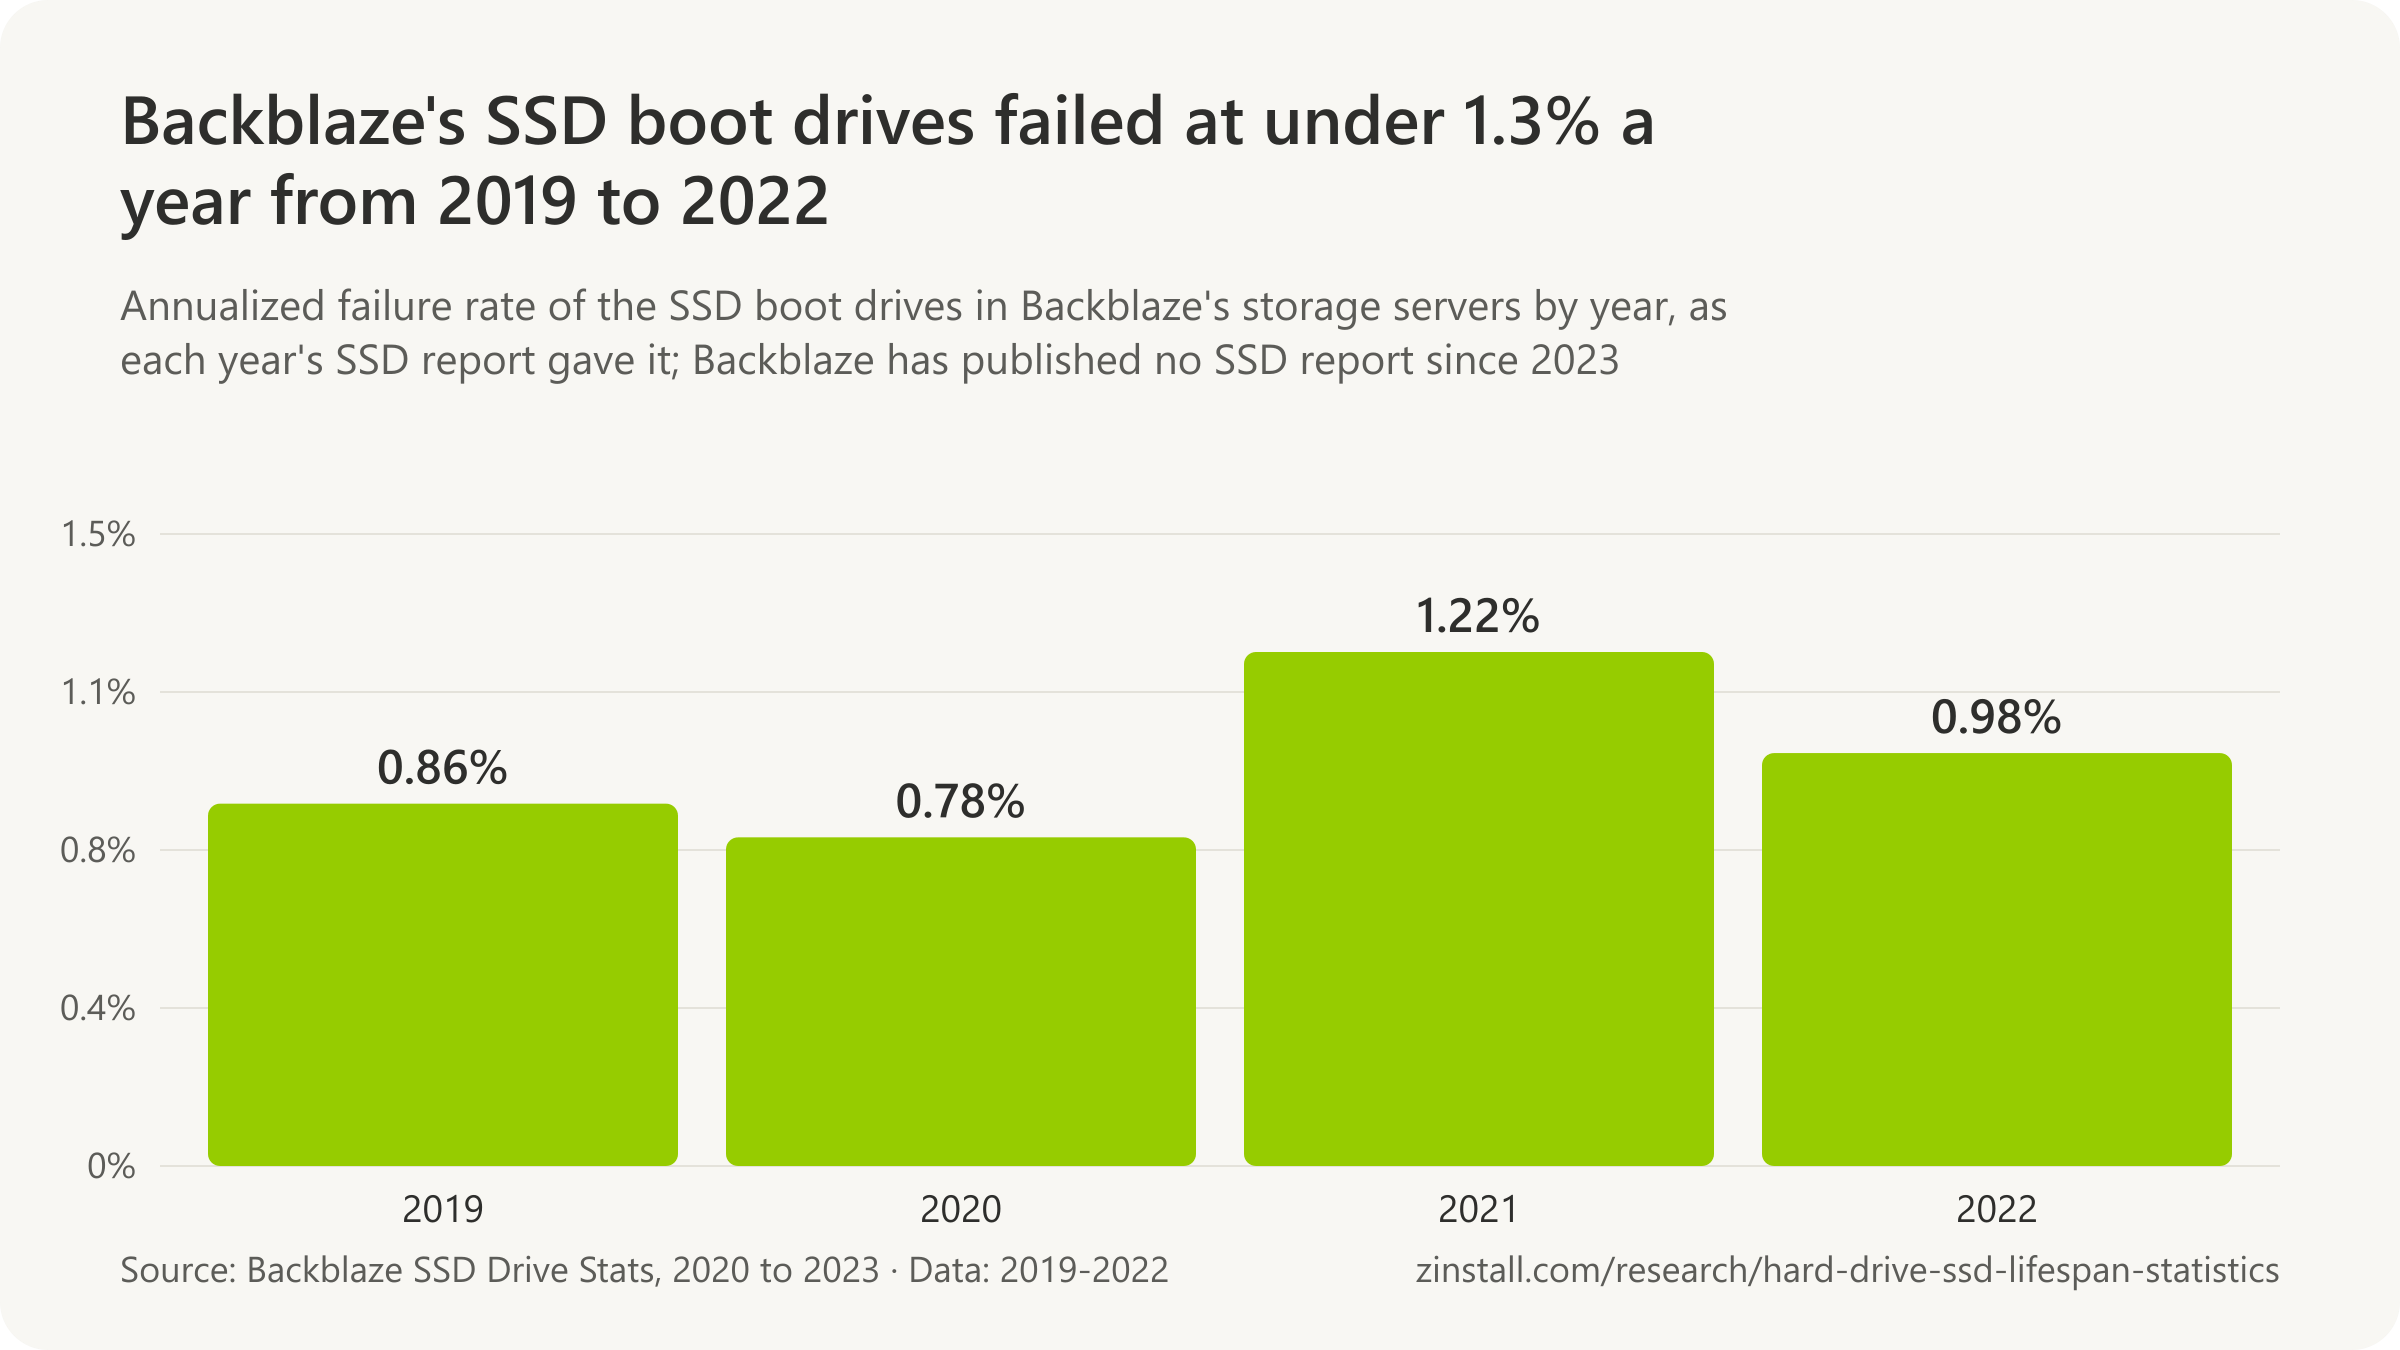
- 0.39% is the 2020 annualized failure rate of Backblaze's SSD boot drives as restated in its 2022 SSD report, against 0.78% in its 2021 SSD report (Backblaze, 2023).
- 1.05% is the 2021 annualized failure rate of Backblaze's SSD boot drives as restated in its 2022 SSD report, against 1.22% in its 2021 SSD report (Backblaze, 2023).
- 1.07% is the lifetime annualized failure rate (failures per drive-year) of Backblaze's SSD boot drives as of December 31, 2021, across 2,200 SSDs (Backblaze, 2022).
- 0.92% is the lifetime annualized failure rate (failures per drive-year) of Backblaze's SSD boot drives as of June 30, 2022, across 2,558 SSDs (Backblaze, 2022).
- 0.89% is the lifetime annualized failure rate (failures per drive-year) of Backblaze's SSD boot drives as of December 31, 2022, across 2,906 SSDs (Backblaze, 2023).
- 1.05% of Backblaze's SSD boot drives failed on an annualized basis in Q2 2023, after 0.96% in Q1 2023, within a quarterly range of 0.36% to 1.72% over three years (Backblaze, 2023).
- 14 months was the average age of the 63 SSD boot drives that had failed in Backblaze's data centres by mid-2023, when the SSD fleet averaged 25 months (Backblaze, 2023).
Workstations and laptops
- 0.74% of all the SSDs Puget Systems has sold in its workstations have failed, its combined average across every SSD model it has carried, by the builder's own records (Puget Systems, 2026).
- 0.22% of the Kingston KC3000 NVMe SSDs in Puget Systems' workstations failed in 2025, up from 0.08% in 2024, by the builder's own records (Puget Systems, 2026).
- None of the Samsung 870 QVO 8TB SATA SSDs Puget Systems sold failed in 2025, by the builder's own records (Puget Systems, 2026).
- 0.19% of the Samsung 870 QVO 8TB SATA SSDs Puget Systems has sold failed across all the years it has carried the model, by the builder's own records (Puget Systems, 2026).
- 1.6% of the storage drives (NVMe, SATA SSD and hard drives) in Puget Systems' workstations failed in 2024 on average, by the builder's own records (Puget Systems, 2025).
- 1% of the storage drives Puget Systems sold in 2024 failed after reaching the customer, two thirds of all its drive failures that year, by the builder's own records (Puget Systems, 2025).
- 0.08% of the Kingston KC3000 NVMe SSDs in Puget Systems' workstations failed in 2024 (about 1 in 1,250, among many thousands sold), by the builder's own records (Puget Systems, 2025).
- None of the more than 1,000 Samsung 870 EVO and QVO SATA SSDs Puget Systems sold in the period its 2021 review covered failed, either in its shop or in the field, by the builder's own records (Puget Systems, 2021).
- 0.18% of the storage drives Puget Systems sold in 2018 failed (about 1 in 570), and 0.05% failed after delivery to the customer, by the builder's own records (Puget Systems, 2019).
- 0.11% of the Samsung 850 and 860 SATA SSDs Puget Systems sold in 2018 failed (about 1 in 874), and none failed after delivery, by the builder's own records (Puget Systems, 2019).
- 0.08% of the Samsung 960 and 970 NVMe SSDs Puget Systems sold in 2018 failed (about 1 in 1,250), by the builder's own records (Puget Systems, 2019).
- 0.26% of the Samsung 850 EVO SSDs Puget Systems sold in 2016 failed, while its Samsung 850 Pro and 950 Pro SSDs had no failures, by the builder's own records (Puget Systems, 2016).
- 0.06% of the Samsung 850 EVO SATA SSDs Puget Systems sold in 2015 failed (a single drive), by the builder's own records (Puget Systems, 2015).
- 0.1% of the Samsung 840 Pro and 840 EVO SSDs Puget Systems sold in 2014 failed (one drive in each line), and none of its 850 Pro SSDs failed, by the builder's own records (Puget Systems, 2014).
- Only one of the Samsung SSD models Puget Systems sold in 2013 had any failures (2 drives, 0.7%), and three models had none, by the builder's own records (Puget Systems, 2013).
Sources: USENIX, Proceedings of the 14th USENIX Conference on File and Storage Technologies; ACM, Proceedings of the 9th ACM International Systems and Storage Conference; USENIX, Proceedings of the 18th USENIX Conference on File and Storage Technologies; USENIX, Proceedings of the 19th USENIX Conference on File and Storage Technologies; USENIX, Proceedings of the 2022 USENIX Annual Technical Conference; ACM / IEEE, Proceedings of the International Conference; USENIX, Proceedings of the 21st USENIX Conference on File and Storage Technologies; ACM, Proceedings of the 2015 ACM SIGMETRICS International Conference on Measurement and Modeling of Computer Systems; Backblaze (2022, 2023); Puget Systems (2013-2026)
SSD vs HDD lifespan: which lasts longer?
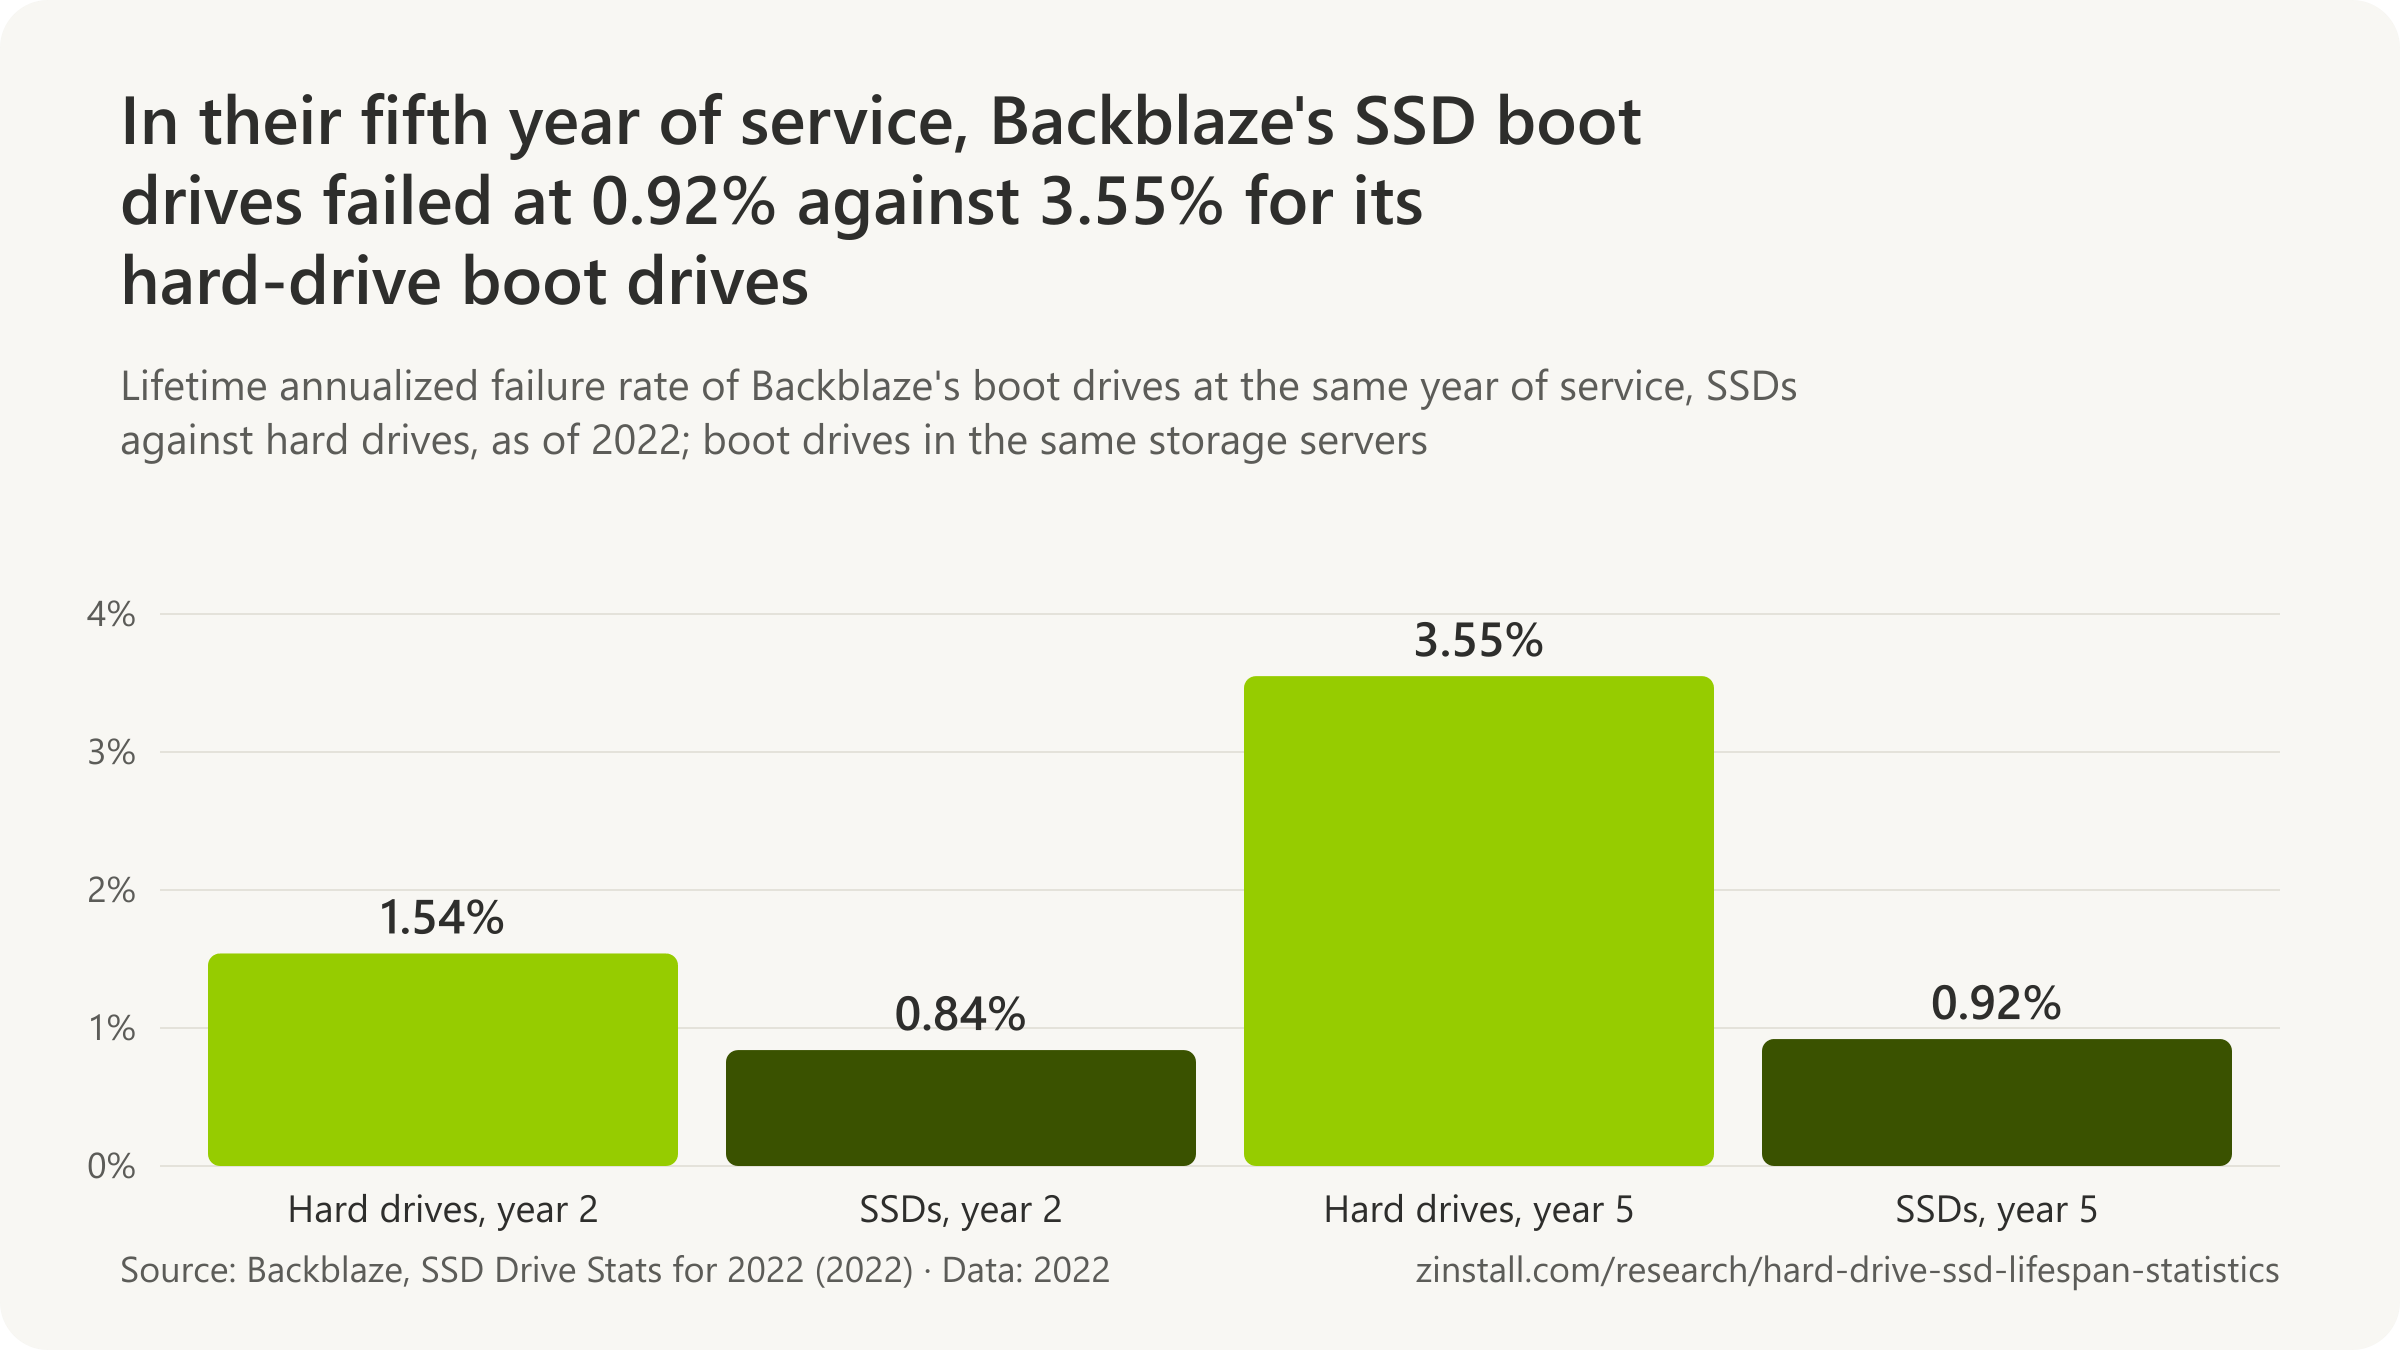
SSD boot drives failed at 0.92% a year in year five, against 3.55% for same-age hard drives (Backblaze, 2022).

- Intel's laptop SSDs failed at 0.61% a year, against 4.85% for the laptop hard drives it had used before.
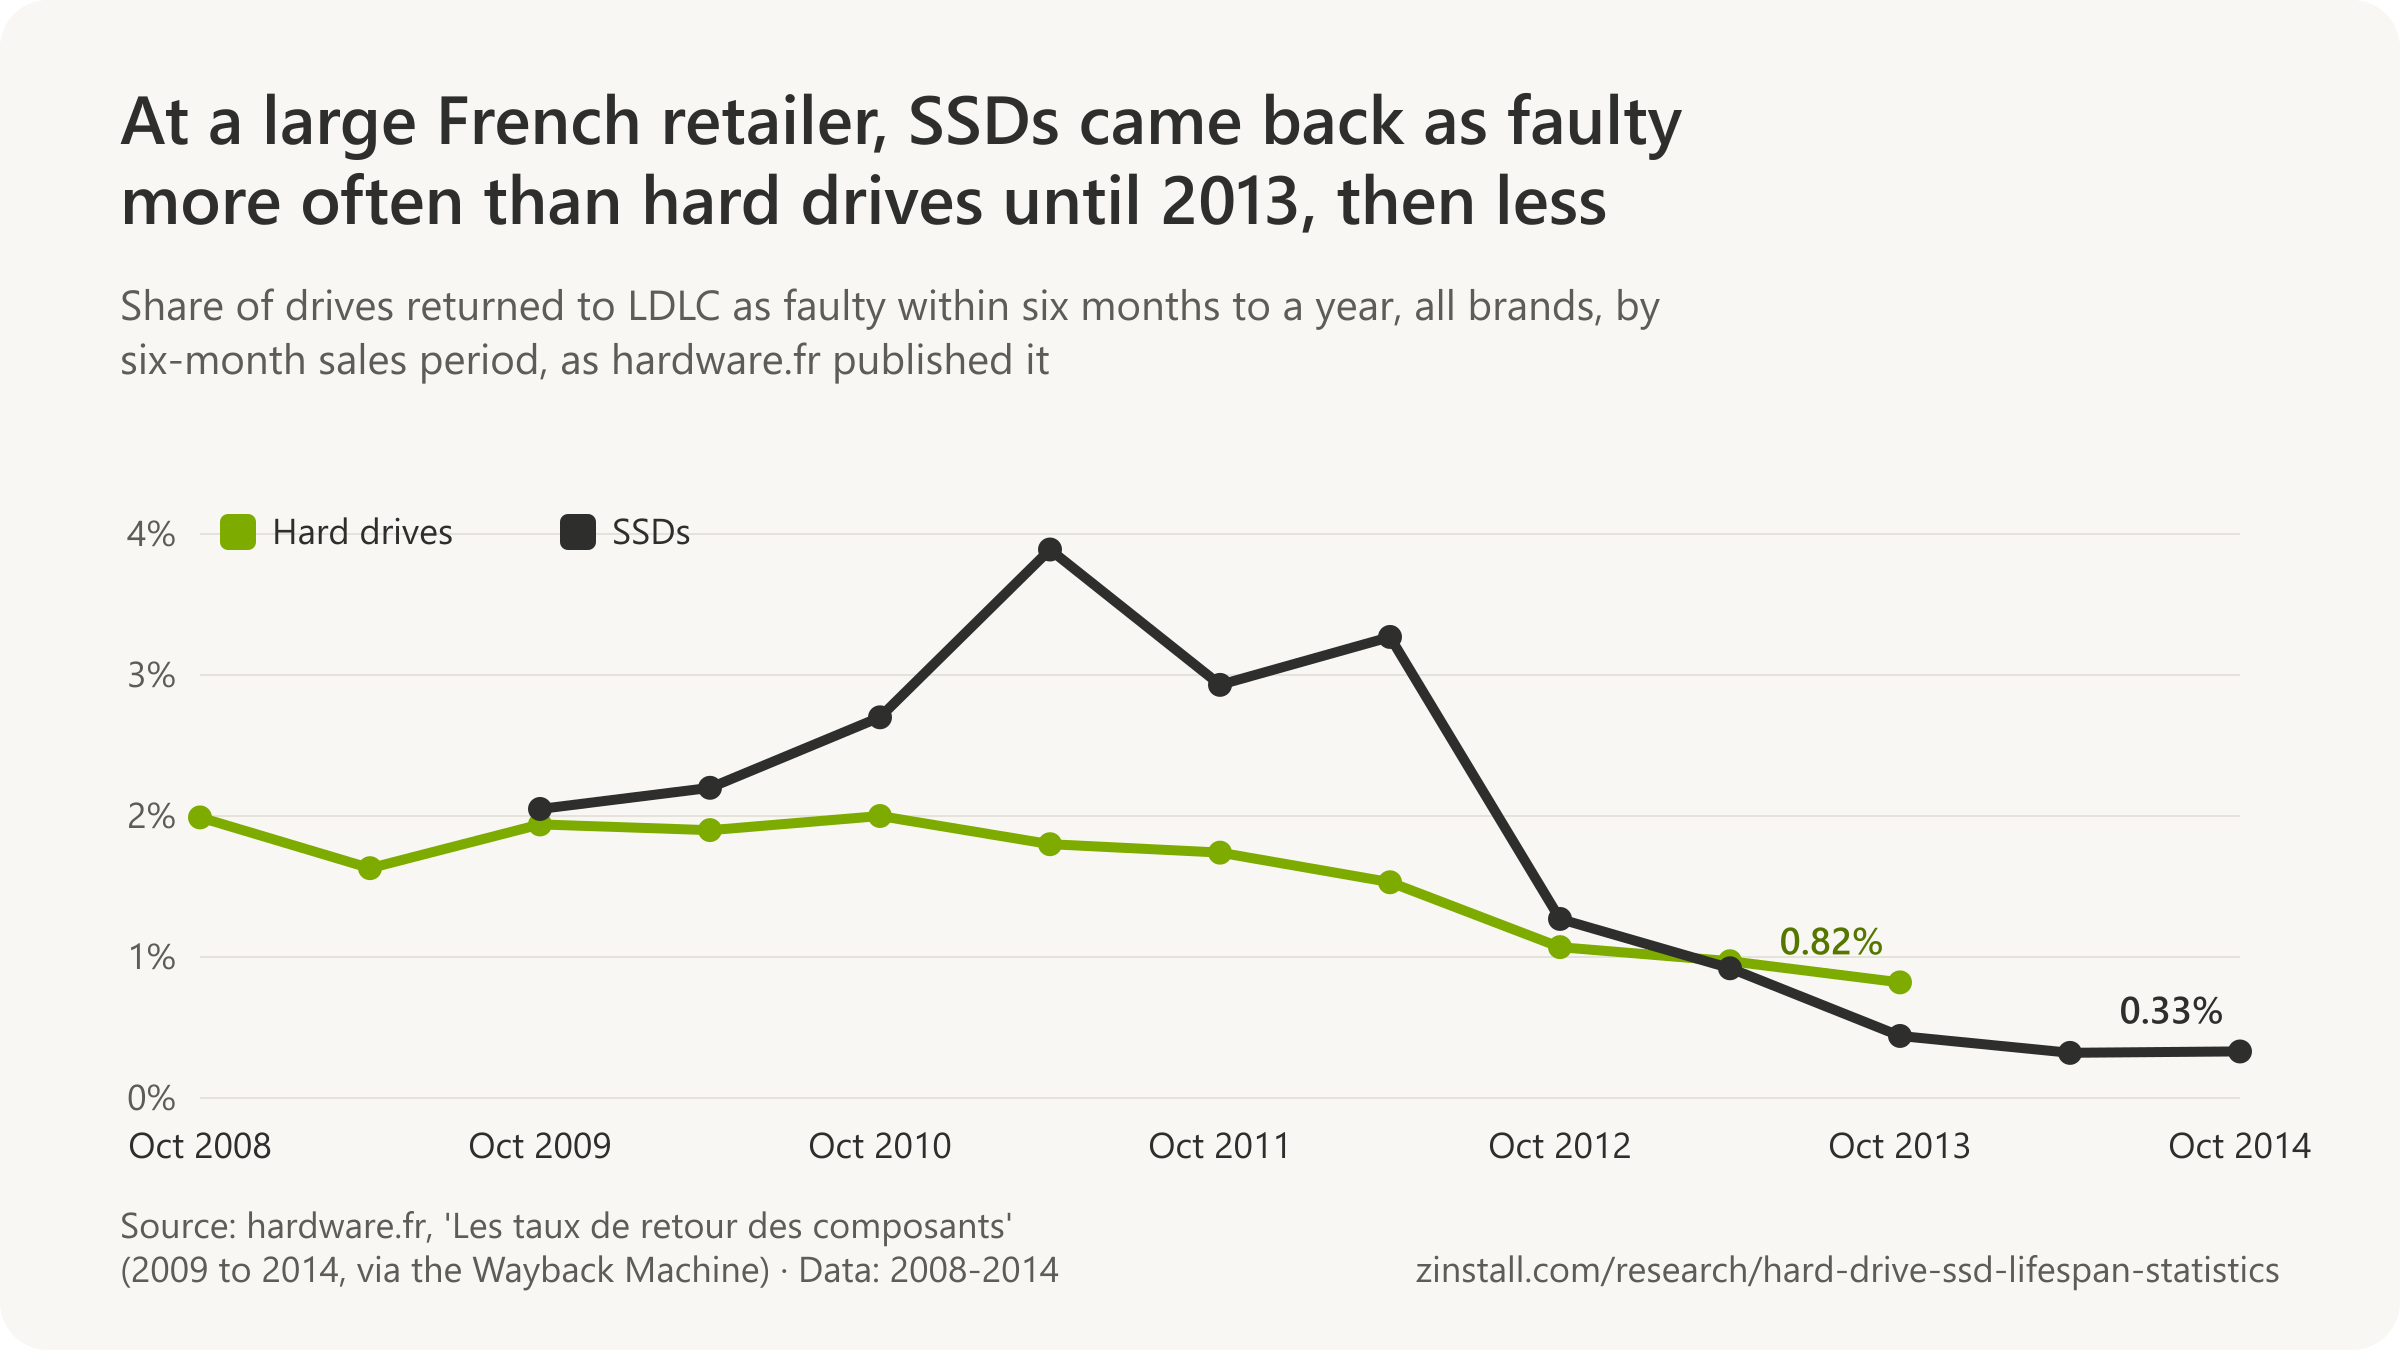
- At a French retailer, 3.89% of SSDs sold in 2011 came back faulty, against 1.80% of hard drives.
- 0.18% of one builder's Samsung SATA SSDs failed from 2013 to 2016, against 1.41% of its WD hard drives.
- 79% of SSD failure tickets in Microsoft's data centres ended in a new drive, against 11% for hard drives.
- 1.41% of Alibaba's NVMe SSDs turned slow in four months, against 0.20% of its hard drives.
| Source, measure and date | Figure |
|---|---|
| Backblaze boot drives at about 12 months: hard drives | 1.54% |
| Backblaze SSD boot drives at 14 months | 1.05% |
| Backblaze hard-drive boot drives at 14 months | 1.38% |
| French retailer: SSDs returned, late 2012 to early 2013 sales | 1.27% |
| French retailer: hard drives returned, same sales | 1.07% |
| Puget Systems: Samsung SATA SSDs failed, 2018 | 0.11% |
| Puget Systems: hard drives failed, 2018 | 0.34% |
| Alibaba: SSDs' share of hardware failure tickets | 5.6% vs 22.1% (HDD) |
| Google SSDs set against Backblaze hard drives over six years (different fleets) | 11.3% (SSD) vs 7.0% (HDD) |
| Microsoft: SSD cost per GB against hard drives, 2016 | 4x to 40x |
Sources: Backblaze (2022, 2021a, 2021b); Intel Corporation, on Intel's own fleet and Intel's own SSD product; Hardware.fr (2013, 2012); Puget Systems (2019, 2016); ACM, Proceedings of the 9th ACM International Systems and Storage Conference; USENIX, Proceedings of the 2022 USENIX Annual Technical Conference; USENIX, Proceedings of the 2019 USENIX Annual Technical Conference; IEEE, Transactions on Dependable and Secure Computing, vol. 20, no. 1, pp. 256-270
Related guides: A new PC with an SSD · Clone or transfer
More statistics (25)
Where the same organisation ran both, SSDs failed less often than hard drives of the same age: Backblaze's boot drives, Intel's laptops and a workstation builder's records all point the same way. The comparisons that set one company's SSDs against another company's hard drives, or drives of different ages, do not hold up. SSDs fail differently: more often by vanishing or locking up, rarely by wearing out.
Same servers, same age: Backblaze's boot drives

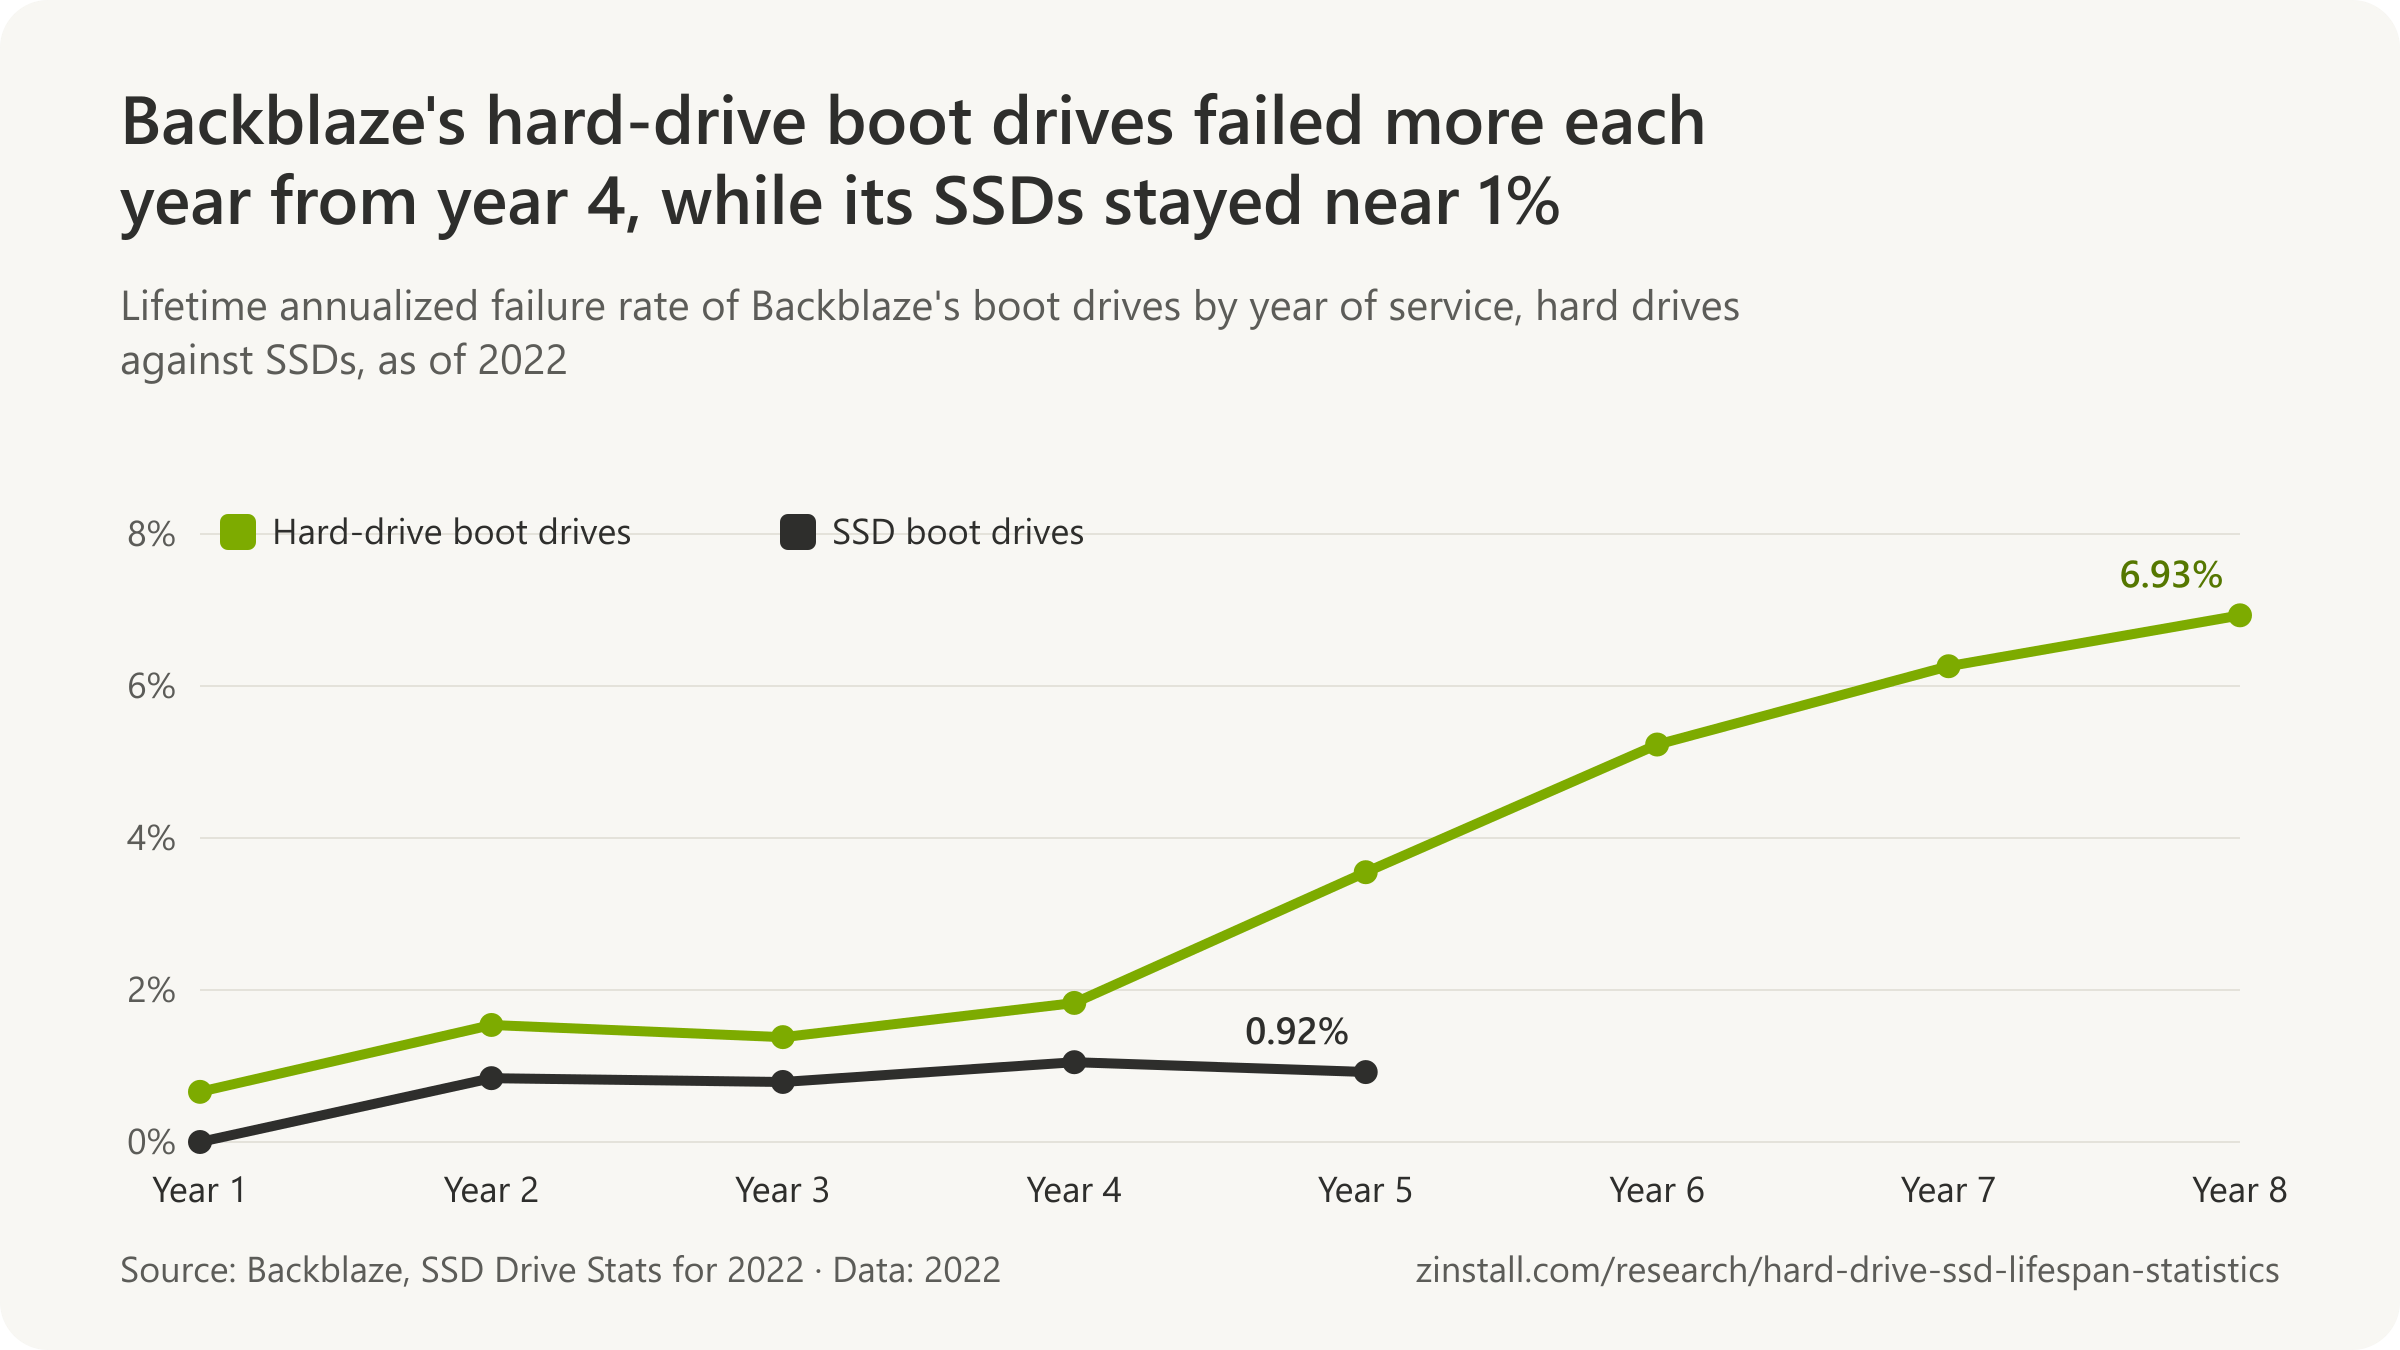
- 1.05% of Backblaze's SSD boot drives failed per year (lifetime annualized) at an average age of 14 months, against 1.38% for its hard-drive boot drives at the same age (Backblaze, 2021).
- 1.38% of Backblaze's hard-drive boot drives failed per year (lifetime annualized) at an average age of 14 months, measured as of Q4 2016 to match the SSDs' age (Backblaze, 2021).
- 6.41% of Backblaze's hard-drive boot drives failed per year (lifetime annualized) at an average age of 52 months, against 1.05% for SSD boot drives averaging 14 months, a comparison Backblaze calls misleading (Backblaze, 2021).
- 1.54% of Backblaze's hard-drive boot drives failed per year at an average age of 12.3 months, nearly twice the 0.79% of its SSD boot drives at the same age (Backblaze, 2021).
- 34.9 degrees Celsius was the average temperature of Backblaze's SSD boot drives in 2022, warmer than the 29.1 degrees of the hard drives in the same servers (Backblaze, 2023).
- 3,144 SSDs were running as boot drives in Backblaze's storage servers at mid-2023, up from 2,200 at the end of 2021 (Backblaze, 2023).
- 10.56% of Backblaze's hard-drive boot drives failed on an annualized basis in Q1 2021, against 0.58% of its SSD boot drives, the hard drives averaging 49.6 months old and the SSDs 12.7 (Backblaze, 2021).
- 6.26% is the lifetime annualized failure rate of Backblaze's hard-drive boot drives to the end of 2020, up from 1.54% at the end of 2015 as the drives aged (Backblaze, 2021).
Laptops, workstations and a retailer
- 0.34% of the hard drives (mostly WD) Puget Systems sold in 2018 failed, against 0.11% of its Samsung SATA SSDs and 0.08% of its Samsung NVMe SSDs, by the builder's own records (Puget Systems, 2019).
- About 1% of the hard drives (WD Red, Gold and RE) Puget Systems sold in 2016 failed, more than half of them after reaching the customer, by the builder's own records (Puget Systems, 2016).
- 0.18% of the Samsung SATA SSDs Puget Systems sold from 2013 to early 2016 failed (about 1 in 550), against 1.41% of its WD hard drives (about 1 in 70), by the builder's own records (Puget Systems, 2016).
- 1.41% of the WD hard drives (Blue, Green, Red, RE and SE) Puget Systems sold from 2013 to early 2016 failed, about 1 in 70, by the builder's own records (Puget Systems, 2016).
- WD hard drives failed at 42 times the rate of Samsung SATA SSDs in Puget Systems' builds in 2015, 5 times the rate in 2014 and 4 times in 2013, by the builder's own records (Puget Systems, 2016).
- 0.74% of the WD Red hard drives Puget Systems sold in 2015 failed, its best hard-drive line that year, while its Samsung 850 EVO and 850 Pro SSDs failed at 0.06% and 0.09%, by the builder's own records (Puget Systems, 2015).
- 0.67% of the WD Red and 0.4% of the WD Blue hard drives Puget Systems sold in 2014 failed (one drive each), its two best hard-drive lines that year, by the builder's own records (Puget Systems, 2014).
- Samsung SSDs (consumer EVO and PRO lines) were about three times as reliable as Intel CPUs and about 50% more reliable than ECC memory in Puget Systems' workstations over three years, by the builder's own records (Puget Systems, 2019).
- 0.61% of the Intel SSDs in Intel employees' laptops failed per year in a study ending in February 2011, against 4.85% of the hard drives in its laptops in 2007, by Intel IT's count (Intel, 2011).
- 1.06% of the Intel SSDs in Intel employees' laptops were returned per year as suspected failures, and 130 of the 227 returned drives (57%) were confirmed as failed (Intel, 2011).

Data centres
- 4% to 10% of the flash drives in Google's data centres were replaced over four years, while earlier field studies had reported 2% to 9% of hard drives replaced every year (Schroeder et al., 2016).
- 79% of SSD-related failure tickets in Microsoft's data centres ended in replacing the drive, against 11% of hard-drive-related tickets (Narayanan et al., 2016).
- SSDs cost 4 to 40 times as much per gigabyte as hard drives in Microsoft's data centres in 2016, depending on the grade, which the authors say outweighed their lower failure rates (Narayanan et al., 2016).
- SSD-related failures made up 5.6% of the more than 150,000 hardware failure tickets in Alibaba Cloud's storage systems, against 22.1% for hard drives and 34.0% for network components (Xu et al., 2019).
- 11.29% of the Google data-centre SSDs in one study failed at least once over six years, against 7.01% of the Backblaze hard drives it compared them with, although the two fleets were run and counted differently (Pinciroli et al., 2023).
- SSDs in NetApp's storage systems ran more than twice as slow as the other drives in their RAID group 0.6% of the time, against 0.2% for hard disks in the same kind of systems (Hao et al., 2016).
- 29% of the SSDs and 26% of the hard disks in NetApp's storage systems had at least one period of running more than twice as slow as their RAID peers in about 87 days of monitoring (Hao et al., 2016).
Sources: Backblaze (2021, 2022, 2023); Puget Systems (2014-2019); Intel Corporation, on Intel's own fleet and Intel's own SSD product; USENIX, Proceedings of the 14th USENIX Conference on File and Storage Technologies (2016); ACM, Proceedings of the 9th ACM International Systems and Storage Conference; USENIX, Proceedings of the 2019 USENIX Annual Technical Conference; IEEE, Transactions on Dependable and Secure Computing, vol. 20, no. 1, pp. 256-270; Hardware.fr (2010-2015)
Which hard drive brands fail the most?
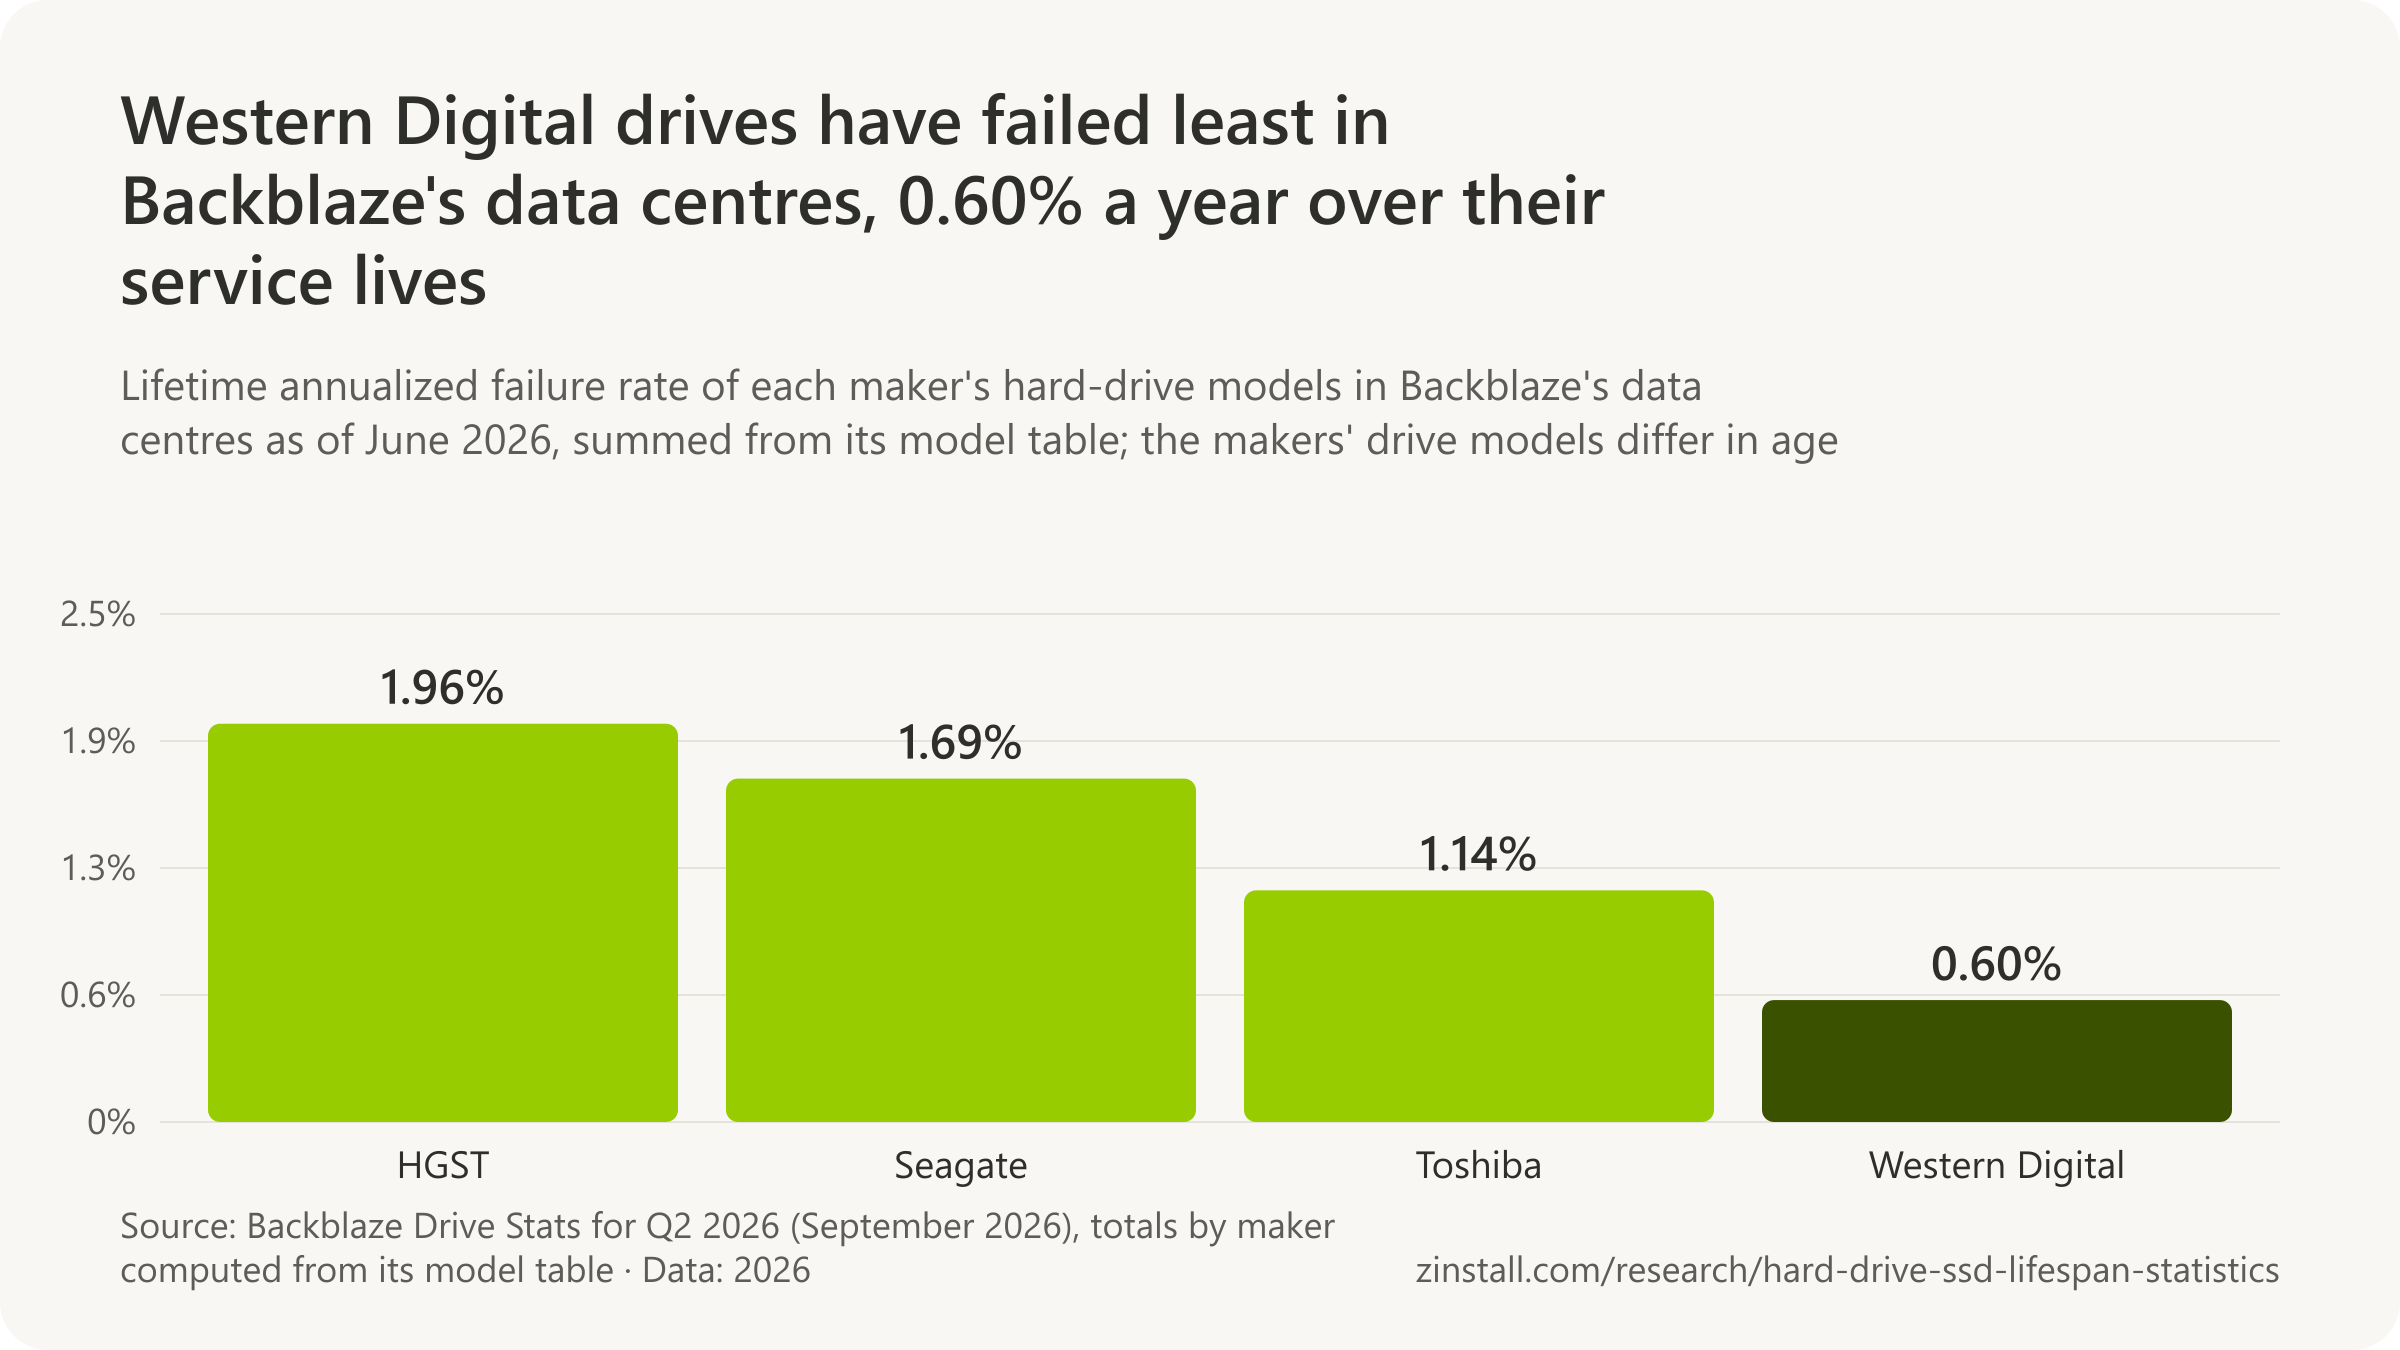
Western Digital drives failed at 0.60% a year over their service lives in one cloud fleet, HGST's at 1.96% (Backblaze, 2026).

- Holding age and capacity equal, HGST drives failed at about 41% of Seagate's rate in a 2026 analysis.
- In one cloud fleet, the worst model's lifetime failure rate was 5.88%, a Seagate 14TB drive, as of June 2026.
- One Seagate 3TB model failed at an annualized 43.1% in 2014, the worst large model in a cloud fleet that year.
- 1.26% of the Western Digital drives a French retailer sold in 2016 came back faulty, the most of any brand.
- In one cloud fleet, helium-filled drives failed at 1.03% a year, against 1.06% for air-filled 8TB drives.
| Model, measure and date | Figure |
|---|---|
| WDC 22TB (WUH722222ALE6L4), 2025: lowest | 0.47% |
| Seagate 16TB (ST16000NM001G), 2025 | 0.54% |
| HGST 12TB (HUH721212ALN604), 2025 | 3.95% |
| Toshiba 16TB (MG08ACA16TEY), 2025, inflated by firmware pulls | 6.30% |
| WDC 14TB (WUH721414ALE6L4), lifetime | 0.54% |
| Toshiba 14TB (MG07ACA14TA), lifetime | 1.07% |
| HGST 4TB: expected to be working at six years | 97% |
| Seagate 4TB: expected to be working at six years | 81% |
| Seagate Barracuda 7200.11 500GB: returned to a French retailer, 2009 | 39% |
| OCZ Octane 128GB SSD: returned to a French retailer, 2012 | 52.07% |
Sources: Backblaze (2015-2026); University of Essex and Sungkyunkwan University; Hardware.fr (2017, 2013, 2010)
Related guides: An old hard drive to a new PC · A new PC with an SSD
More statistics (51)
Brand rankings change with the models a fleet buys: every maker has had good and bad models. In Backblaze's fleet, where every drive works the same way, Western Digital's current drives have failed least and HGST's ageing drives most, while a 2026 academic analysis of the same data that held age, capacity and temperature constant found HGST's drives the least likely to fail. At a large French retailer, the four brands still sold in 2016 came back faulty at about one percent. The model matters more than the brand.
Backblaze's fleet by maker

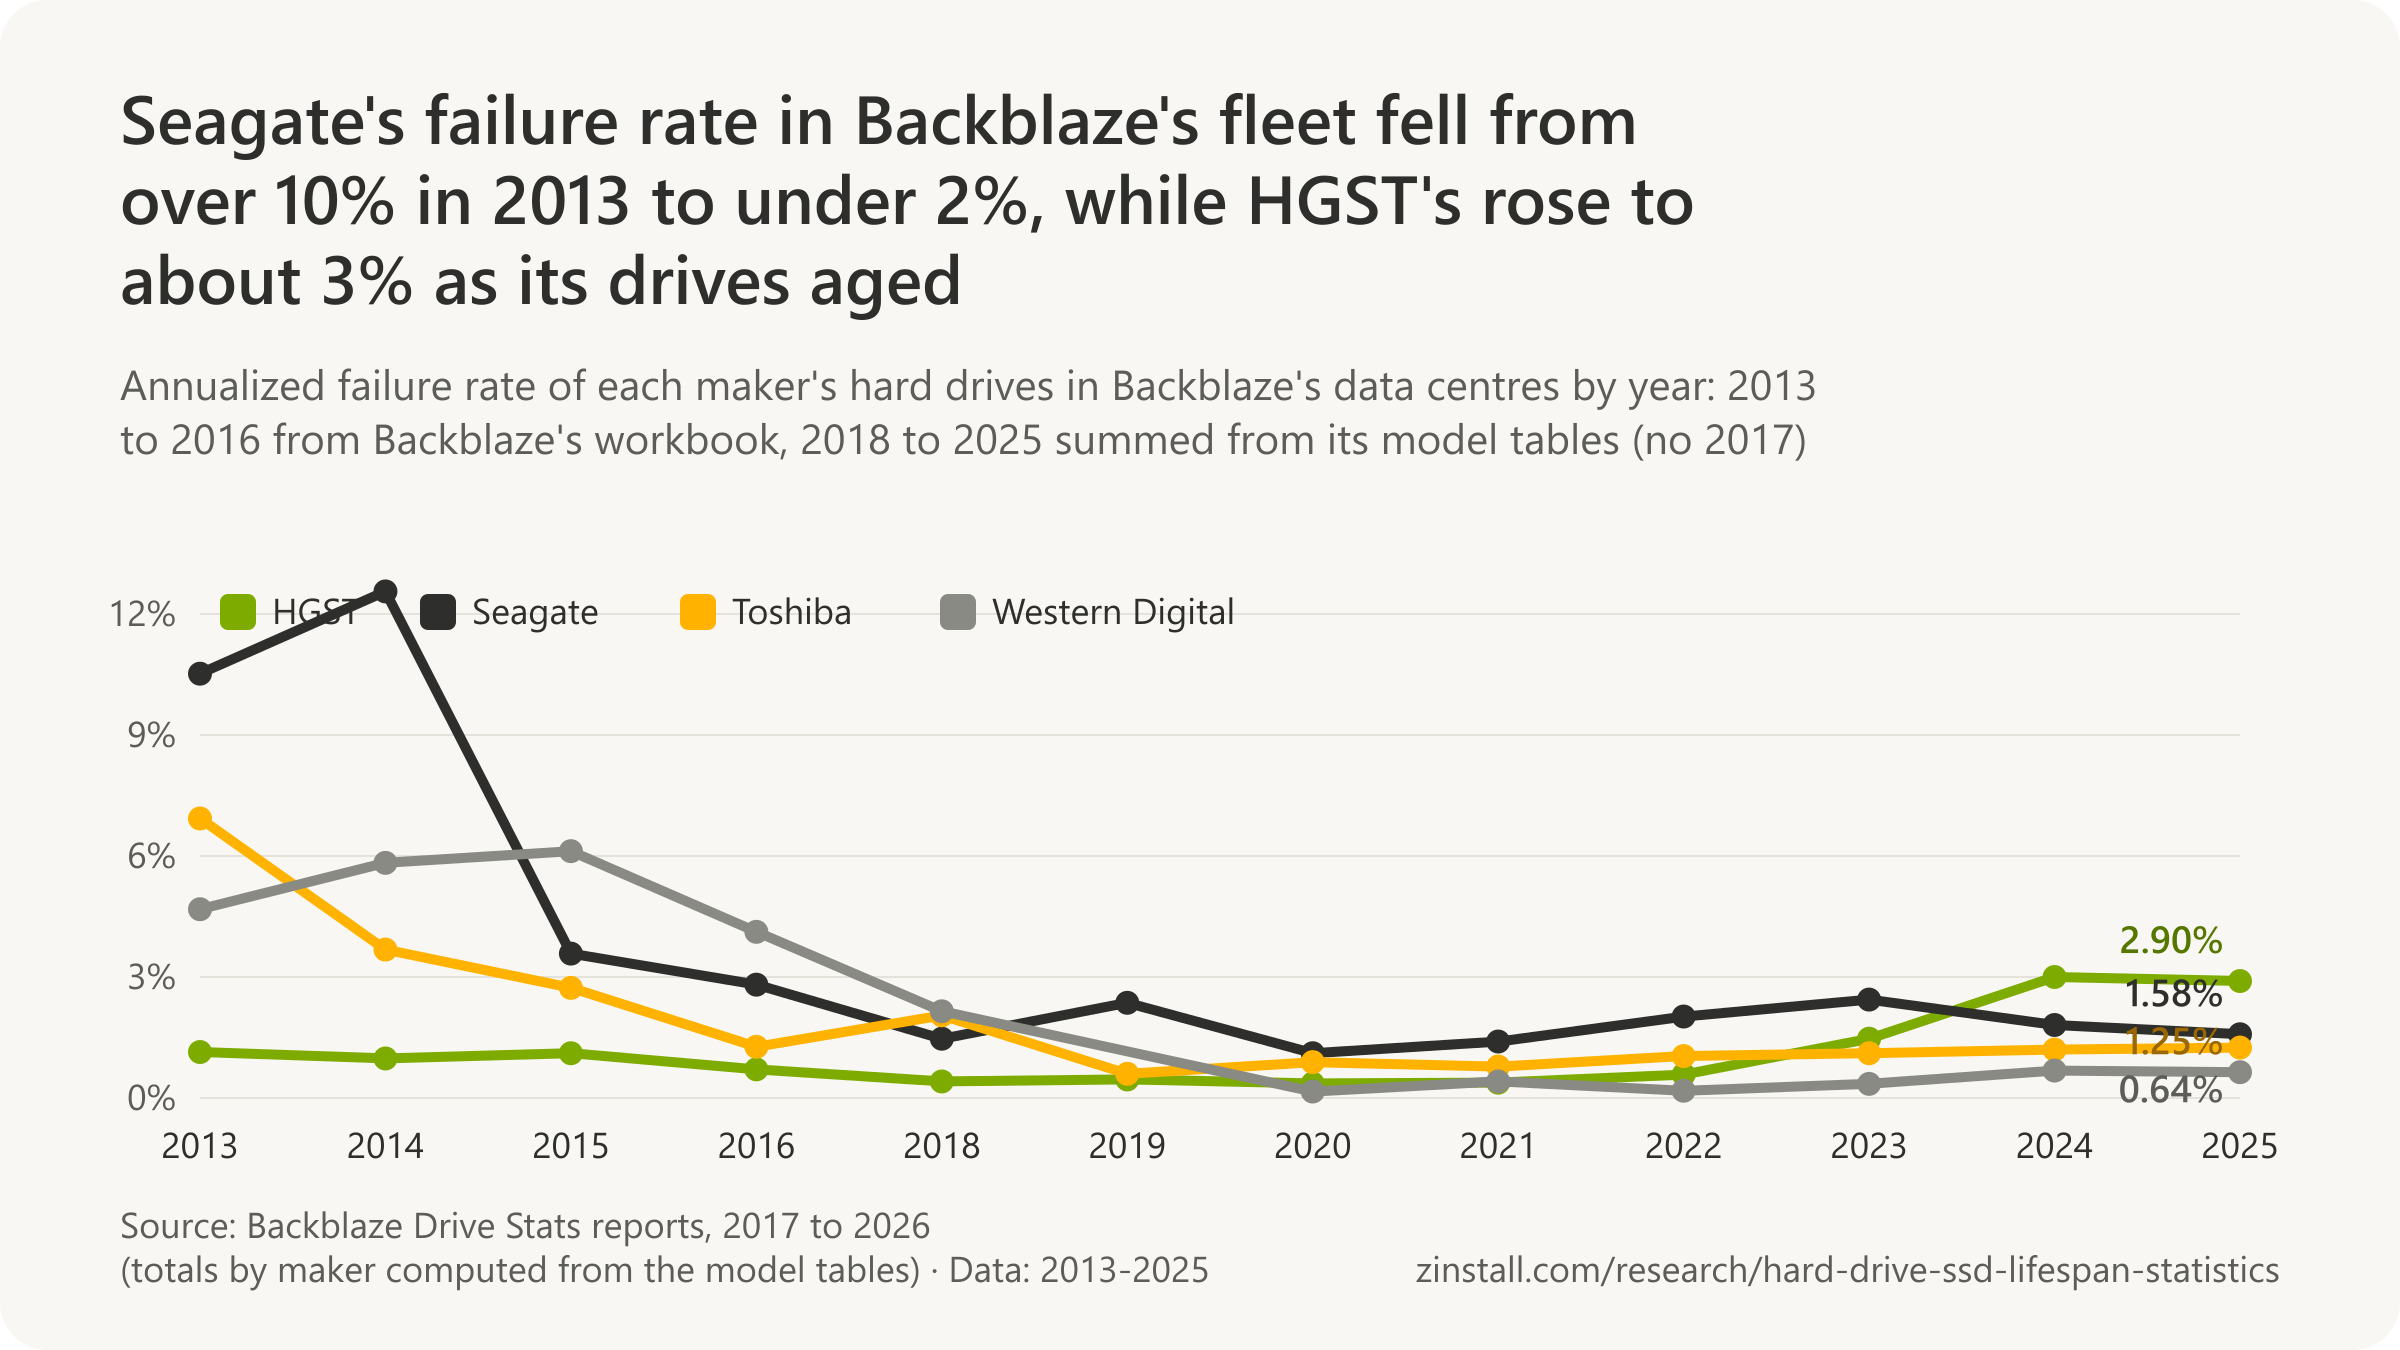
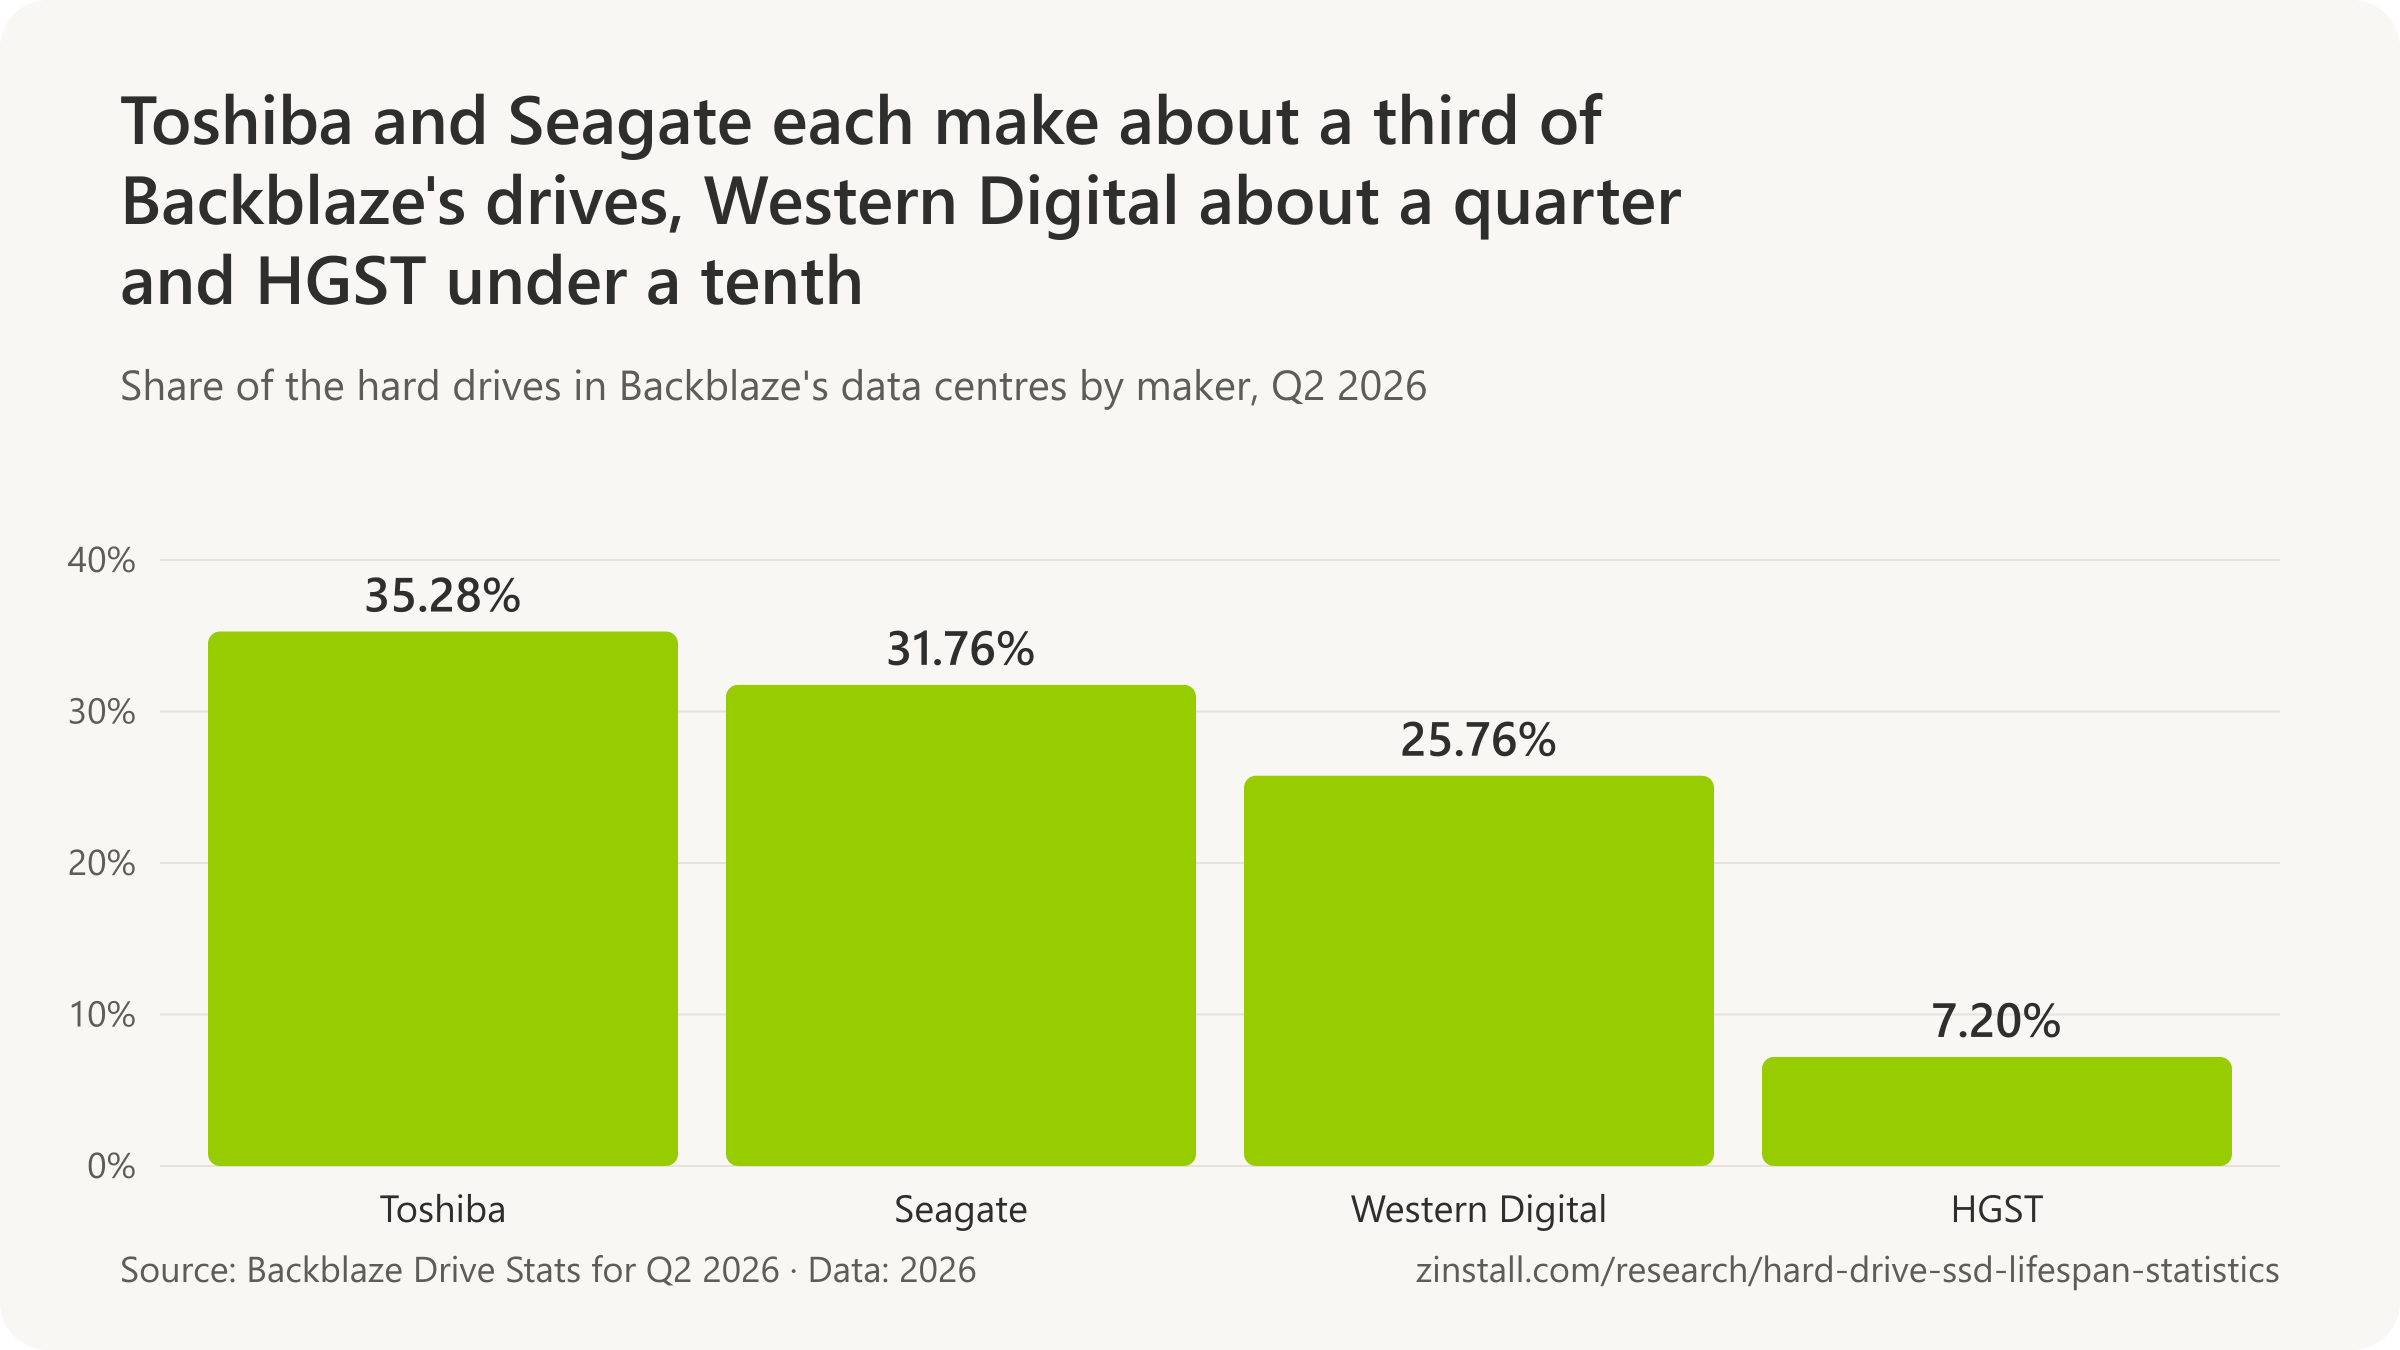
- 2.07% of Seagate hard drives in Backblaze's data centres failed in Q2 2026 on an annualized basis (failures per drive-year), 573 failures among 112,567 drives, summed from Backblaze's model table (Backblaze data, 2026).
- 4.72% of HGST (Western Digital's former Hitachi line) hard drives in Backblaze's data centres failed in Q2 2026 on an annualized basis (failures per drive-year), 296 failures among 25,489 drives, summed from Backblaze's model table (Backblaze data, 2026).
- 1.40% of Toshiba hard drives in Backblaze's data centres failed in Q2 2026 on an annualized basis (failures per drive-year), 424 failures among 125,050 drives, summed from Backblaze's model table (Backblaze data, 2026).
- 0.92% of Western Digital (WDC-branded) hard drives in Backblaze's data centres failed in Q2 2026 on an annualized basis (failures per drive-year), 205 failures among 91,309 drives, summed from Backblaze's model table (Backblaze data, 2026).

Holding age, capacity and temperature constant
- HGST hard drives failed at about 41% of Seagate's rate and Western Digital's at about 52%, while Toshiba's ran about 7% above Seagate's, holding age, capacity and temperature constant, across 443,156 drives in Backblaze's data centres (University of Essex and Sungkyunkwan University, 2026).
- Each extra terabyte of capacity lowered the failure rate by 3.4%, holding age, maker and form factor constant, across 443,156 hard drives in Backblaze's data centres (University of Essex and Sungkyunkwan University, 2026).
The best and worst models
- 6.30% of Backblaze's Toshiba MG08ACA16TEY (16TB) hard drives failed on an annualized basis in 2025, the highest among models with over a million drive days in 2025, 318 failures in 1,843,841 drive days across 5,197 drives (Backblaze, 2026).
- 3.95% of Backblaze's HGST HUH721212ALN604 (12TB) hard drives failed on an annualized basis in 2025, the highest without a known one-off cause among models with over a million drive days, 393 failures in 3,628,418 drive days across 10,195 drives (Backblaze, 2026).
- 0.47% of Backblaze's WDC WUH722222ALE6L4 (22TB) hard drives failed on an annualized basis in 2025, the lowest among models with over a million drive days, 177 failures in 13,612,879 drive days across 44,577 drives (Backblaze, 2026).
- 0.54% of Backblaze's Seagate ST16000NM001G (16TB) hard drives failed on an annualized basis in 2025, the lowest among models over three years old with over a million drive days, 182 failures in 12,381,689 drive days across 34,563 drives (Backblaze, 2026).
- 0.49% of Backblaze's HGST HMS5C4040BLE640 (4TB) hard drives failed on an annualized basis in 2025, the fleet's oldest model in 2025, at 8.6 years on average, 5 failures in 375,277 drive days across 4,121 drives (Backblaze, 2026).
- 5.66% of Backblaze's Seagate ST10000NM0086 (10TB) hard drives failed on an annualized basis in 2025, among the highest of all models in 2025, 57 failures in 367,460 drive days across 1,044 drives (Backblaze, 2026).
- 5.88% is the lifetime annualized failure rate of Backblaze's Seagate ST14000NM0138 (14TB) hard drives as of June 30, 2026, the highest lifetime rate of any listed model, 464 failures in 2,878,064 drive days (Backblaze, 2026).
- 0.54% is the lifetime annualized failure rate of Backblaze's WDC WUH721414ALE6L4 (14TB) hard drives as of June 30, 2026, the lowest lifetime rate among models with over 10 million drive days, 254 failures in 17,127,349 drive days (Backblaze, 2026).
- 1.07% is the lifetime annualized failure rate of Backblaze's Toshiba MG07ACA14TA (14TB) hard drives as of June 30, 2026, the model with the most drive days in the table, 2,293 failures in 78,387,008 drive days (Backblaze, 2026).
- 3 of 31 hard-drive models in Backblaze's Q2 2026 table were statistical outliers above a 6.95% annualized failure rate, the worst a Seagate 10TB model at 9.33% (Backblaze, 2026).
- 97% of Backblaze's HGST 4TB (HMS5C4040BLE640) drives were expected to still be working after six years, by its Kaplan-Meier survival curves (Backblaze, 2022).
- 81% of Backblaze's Seagate 4TB (ST4000DM000) drives were expected to still be working after six years, by its Kaplan-Meier survival curves (Backblaze, 2022).
- 95% of Backblaze's Seagate 8TB consumer (ST8000DM002) drives were expected to still be working after five years, by its Kaplan-Meier survival curves (Backblaze, 2022).
- 93.6% of Backblaze's Seagate 8TB enterprise (ST8000NM0055) drives were expected to still be working after five years, by its Kaplan-Meier survival curves (Backblaze, 2022).
- 98% of Backblaze's 12TB drives (three HGST and Seagate models) were expected to still be working after two years, by its Kaplan-Meier survival curves (Backblaze, 2022).
- 97% of Backblaze's Toshiba 14TB (MG07ACA14TA) drives were expected to still be working after three years, by its Kaplan-Meier survival curves (Backblaze, 2022).
The Seagate 3 TB drive

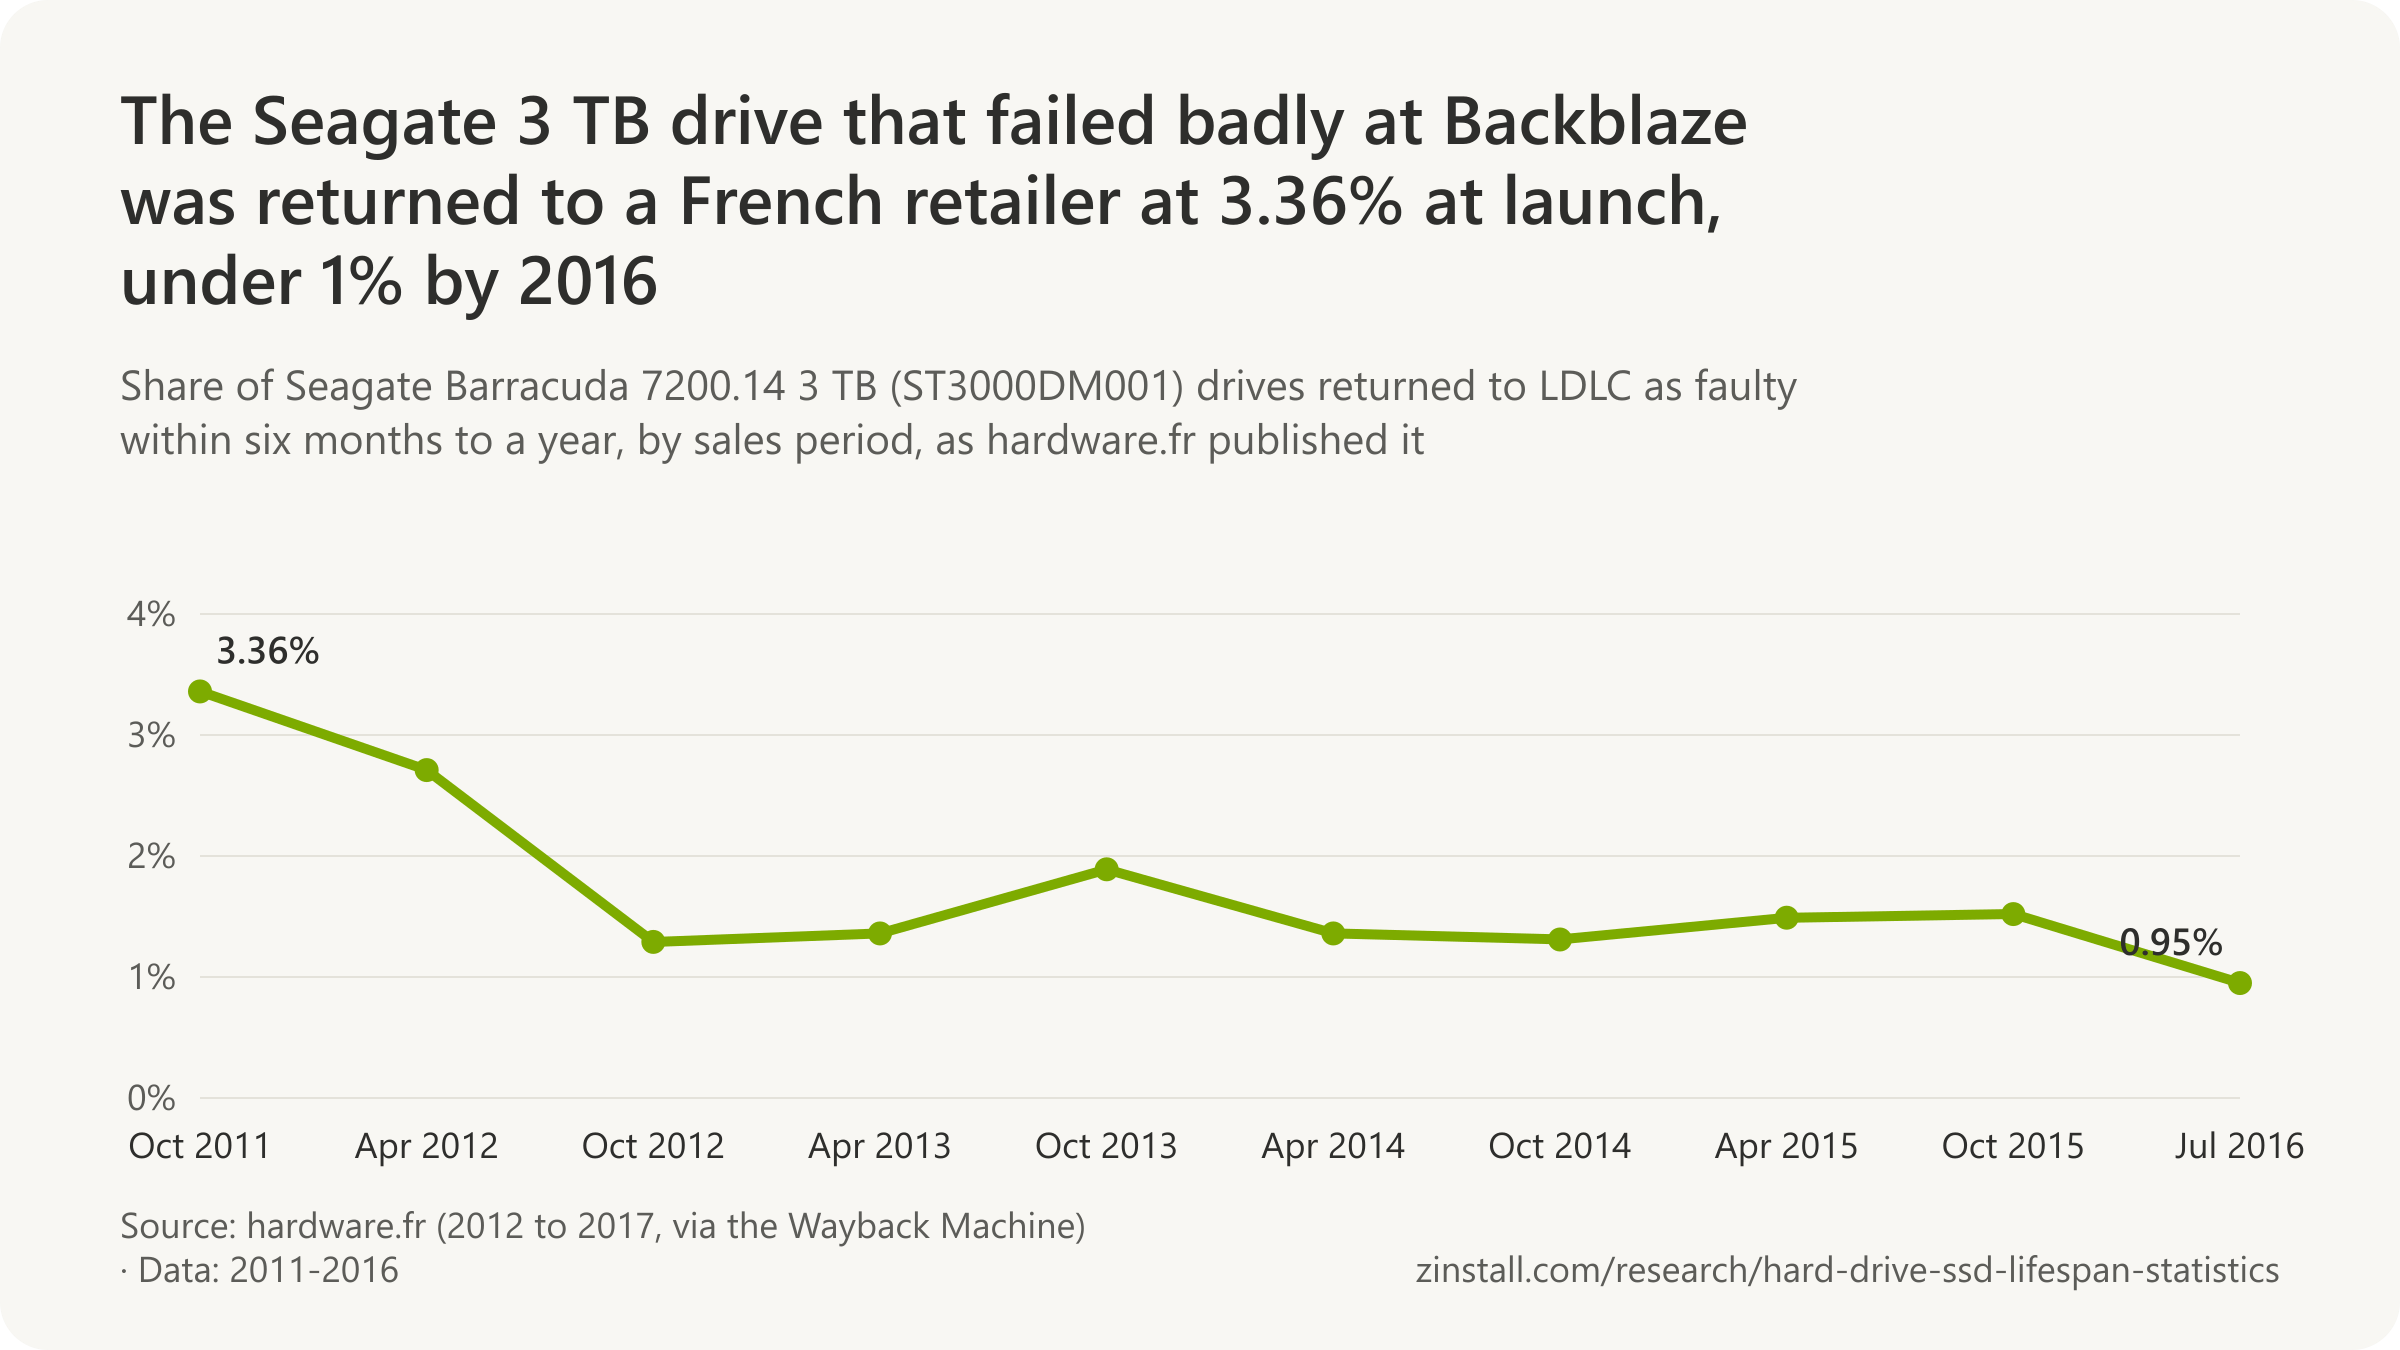
- 47.2% of the Seagate 3TB hard drives (ST3000DM001) Backblaze deployed in 2012 failed during 2014, after 2.7% in 2012 and 5.4% in 2013 (Backblaze, 2015).
- 43.1% of Backblaze's Seagate Barracuda 7200.14 3TB hard drives failed on an annualized basis in 2014, the worst large model in its 2014 table (Backblaze, 2015).
- 15.7% of Backblaze's Seagate Barracuda 7200.14 3TB hard drives were failing per year by mid-2014, up from about 9% through 2013 (Backblaze, 2014).
Drive types: capacity, helium, enterprise and shingled recording

- 2.33% of the 12TB and smaller hard drives in Backblaze's data centres failed in 2025 on an annualized basis (failures per drive-year), 1,987 failures among 89,939 drives (Backblaze data, 2026).
- 1.10% of the 14TB to 16TB hard drives in Backblaze's data centres failed in 2025 on an annualized basis (failures per drive-year), 1,919 failures among 177,041 drives (Backblaze data, 2026).
- 0.72% of the 20TB and larger hard drives in Backblaze's data centres failed in 2025 on an annualized basis (failures per drive-year), 411 failures among 77,216 drives (Backblaze data, 2026).
- 0.85% of Backblaze's newly deployed drives larger than 20TB failed on an annualized basis as a pool in Q1 2026 (Backblaze, 2026).
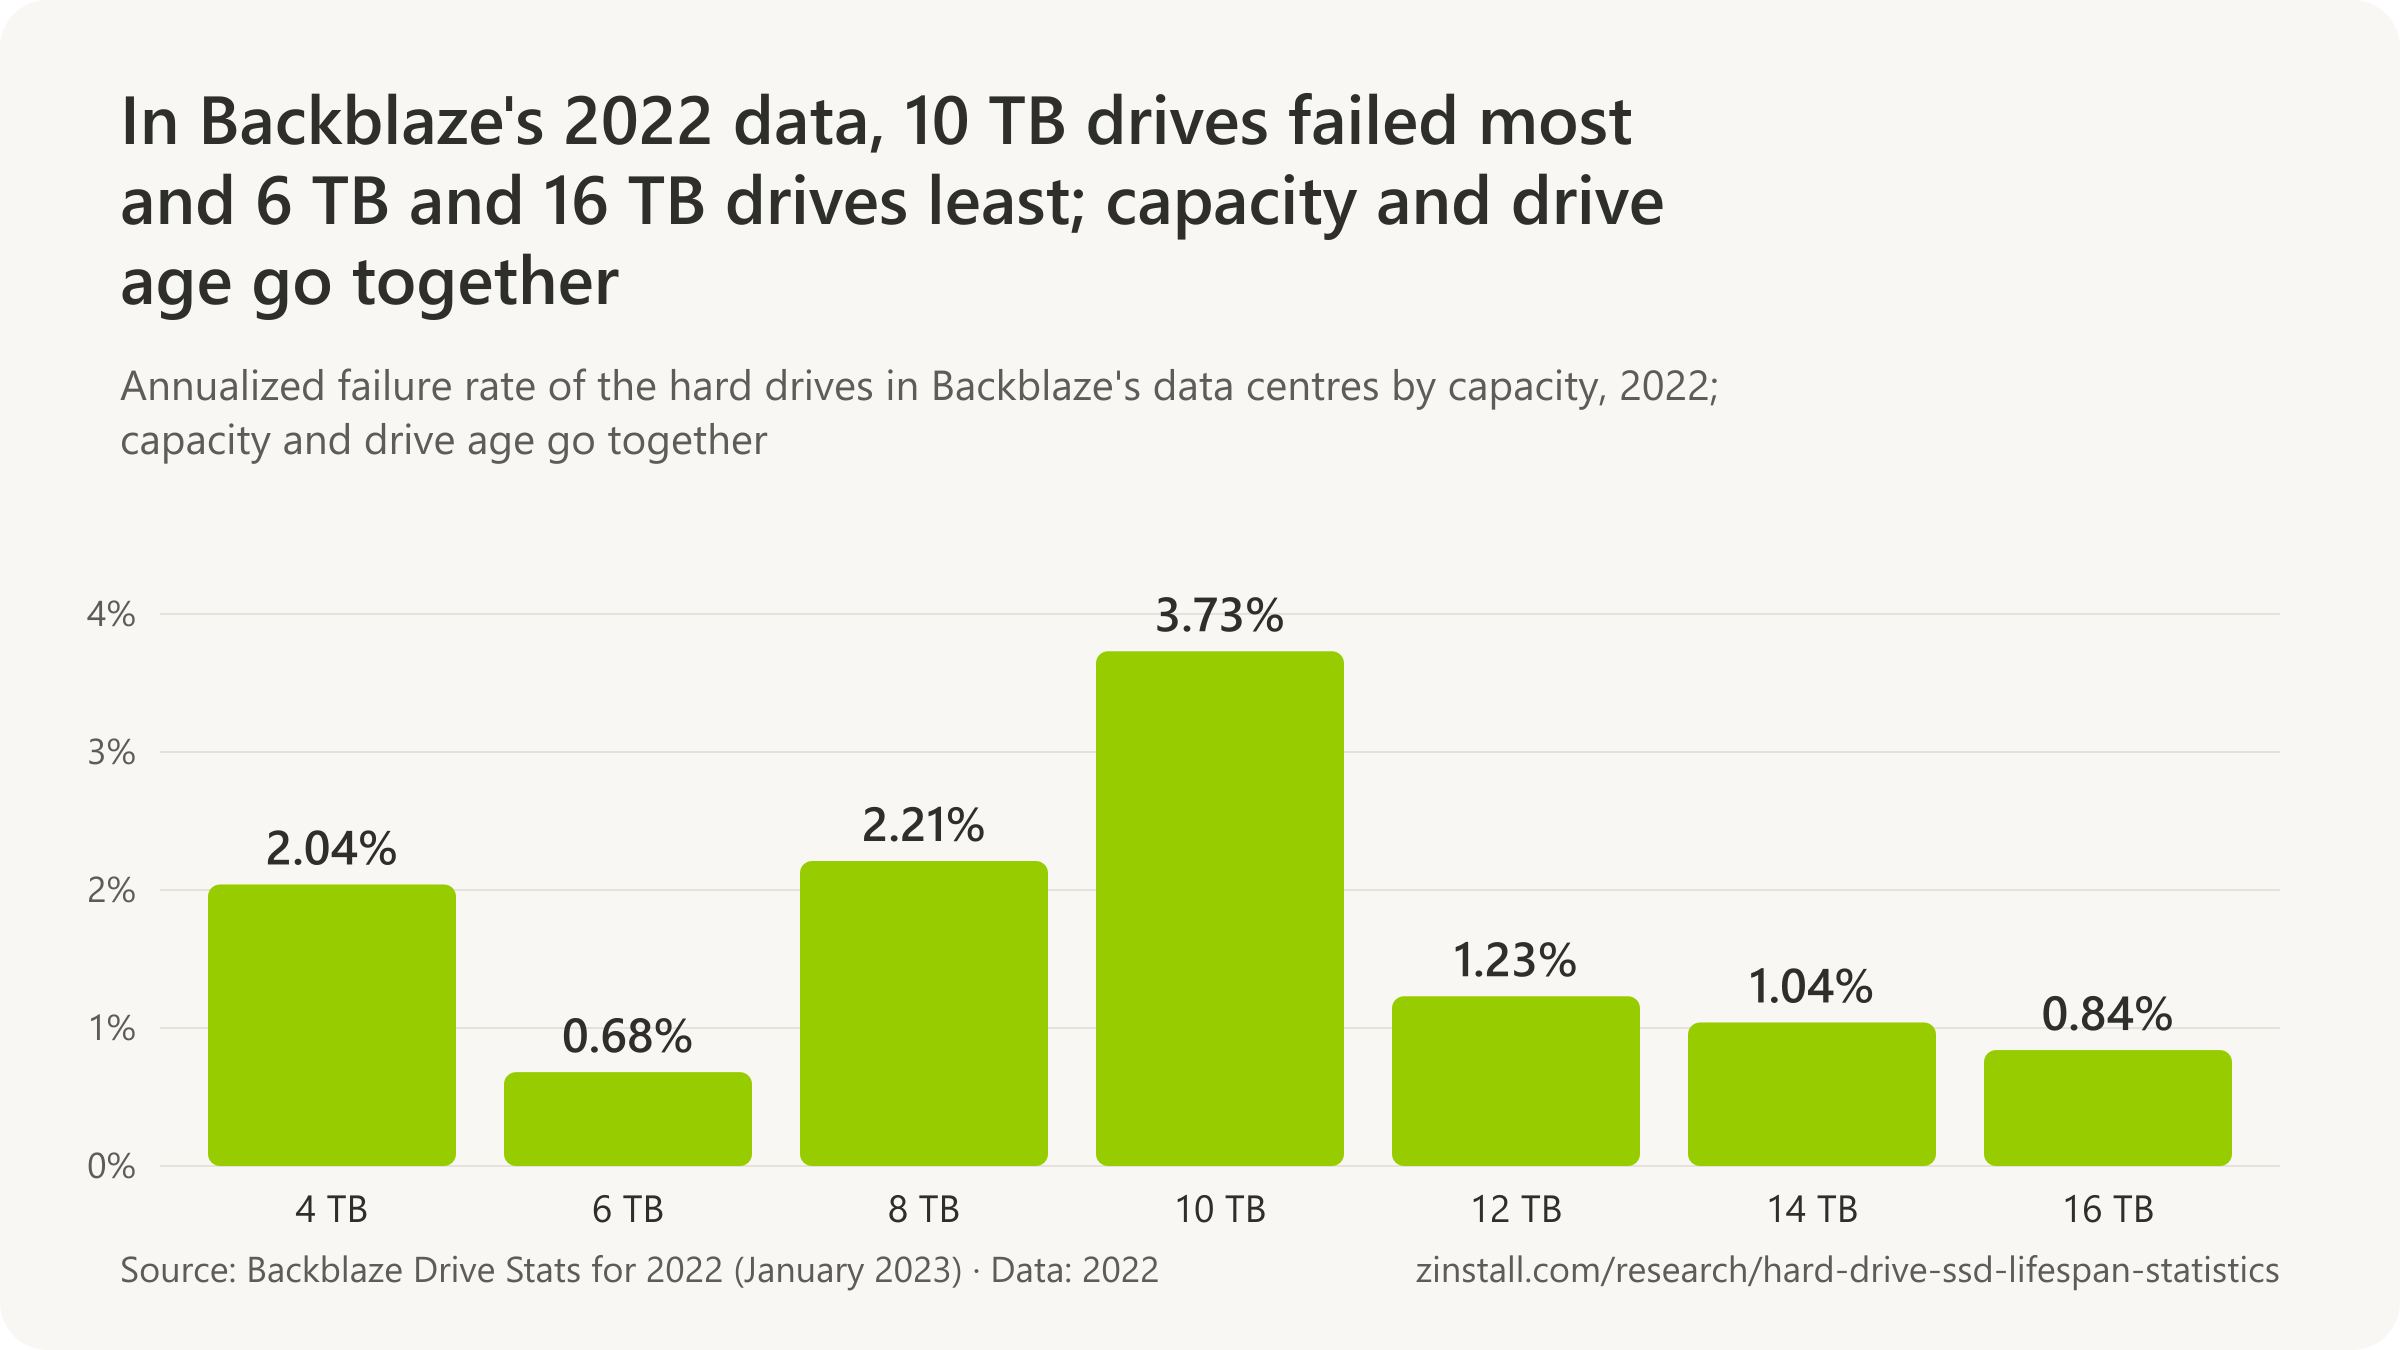
- 2.12% of Backblaze's 4TB to 10TB hard drives failed on an annualized basis in 2022, against 1.07% for its 12TB to 16TB drives, the smaller drives being far older (Backblaze, 2023).
- 1.03% of Backblaze's helium-filled 8TB to 12TB hard drives failed per year (lifetime annualized), against 1.06% for its air-filled 8TB drives (Backblaze, 2018).
- 1.61% was the annualized failure rate of Backblaze's air-filled 8TB drives when they had a similar number of drive days to its helium drives, against about 1.06% for the helium drives as Backblaze's 2018 text put it, 1.03% in its table (Backblaze, 2018).
- 4.6% of Backblaze's enterprise-class hard drives failed per year, against 4.2% of its consumer drives, in its 2013 comparison (Backblaze, 2013).
- 4.2% of the consumer-grade hard drives in Backblaze's Storage Pods failed per year in its first fleet-wide measurement, 613 failures in 14,719 drive-years (Backblaze, 2013).
- 0.97% of Backblaze's Seagate 8TB enterprise drives failed per year (lifetime annualized), against 1.03% for the consumer version of the same capacity (Backblaze, 2018).
- 0 shingled (SMR) hard drives were in Backblaze's fleet in 2026; every drive in its failure tables uses conventional (CMR) recording (Backblaze, 2026).
- Seagate rates its CMR BarraCuda 3.5-inch desktop hard drives (12 TB to 24 TB) for a workload of 120 TB a year (Seagate, 2026).
- Seagate rates its SMR BarraCuda 3.5-inch desktop hard drives (4 TB and 8 TB, 5,400 rpm) for a workload of 55 TB a year, under half the 120 TB of its CMR models (Seagate, 2026).
- Seagate states that all IronWolf NAS hard drives use conventional magnetic recording (CMR), not shingled recording (SMR) (Seagate, 2022).
- WD's WD Blue 3.5-inch desktop range lists SMR (shingled) recording for 5 of its 18 models, at 2 TB, 3 TB, 4 TB and 6 TB, alongside CMR models of the same capacities (Western Digital, 2025).
- Toshiba's P300 desktop hard drive datasheet lists SMR (shingled) recording for all three current P300 models, 2 TB, 4 TB and 6 TB (Toshiba, 2025).
- Western Digital says its data over many drive generations show failure rates close to identical for hard drives from 3 platters and 6 heads up to 10 platters and 20 heads, at a given workload (Western Digital, 2023).
Return rates at a French retailer

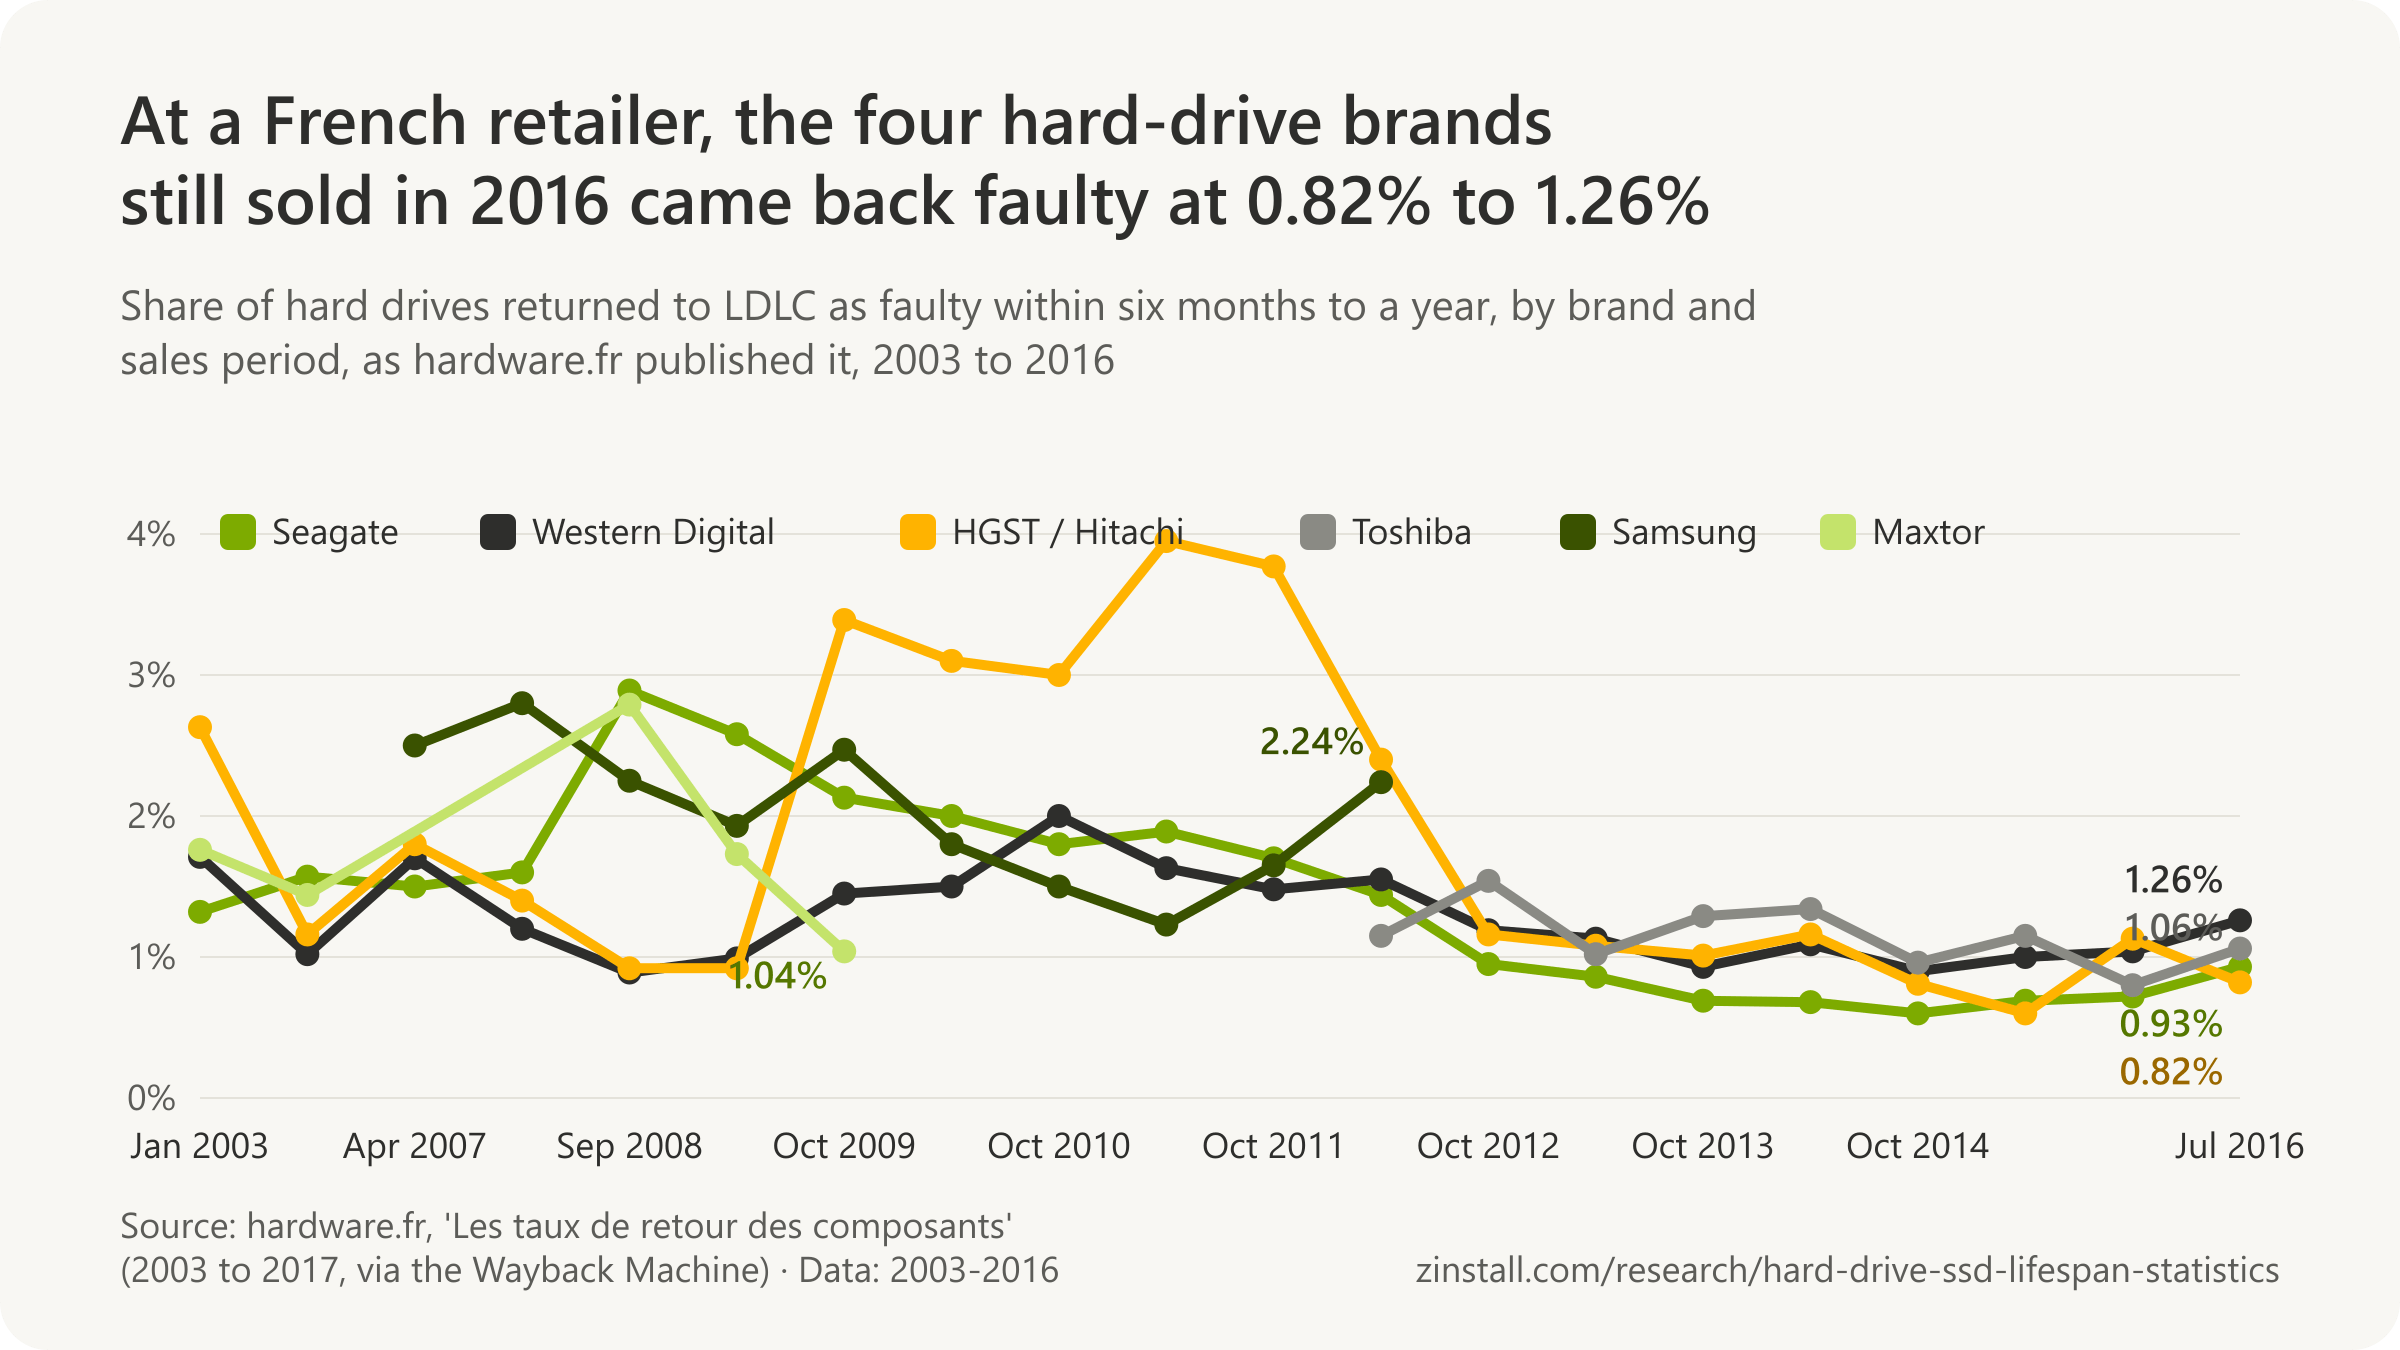

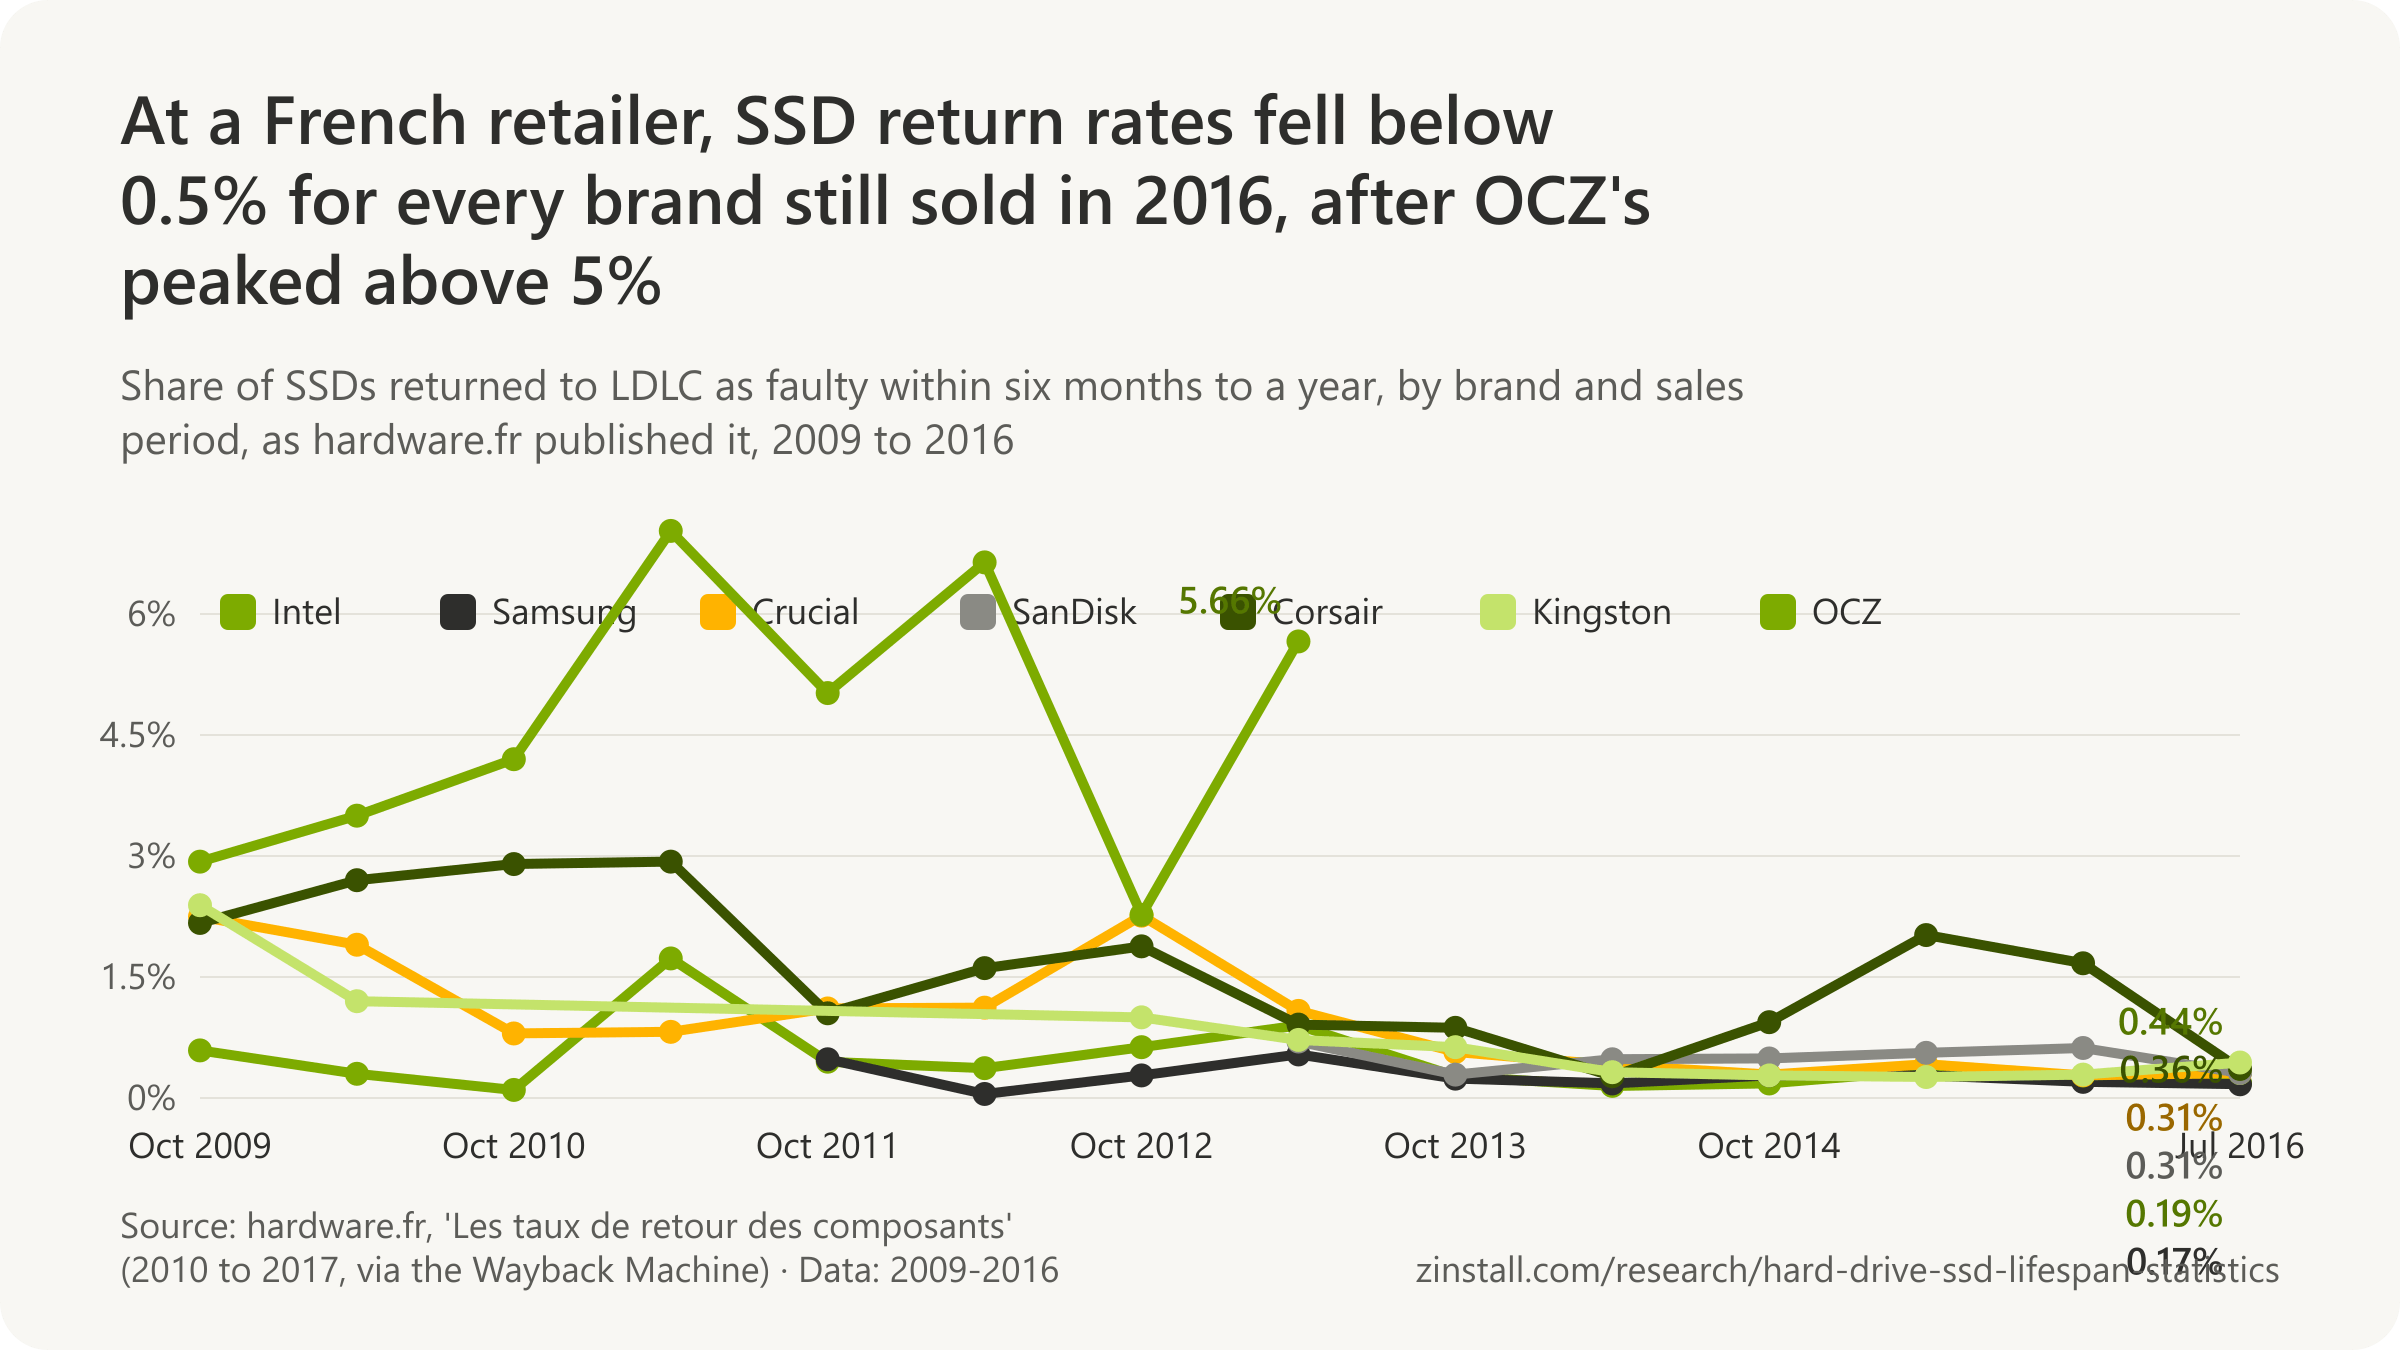
- 0.16% of the Plextor SSDs sold by a large French online retailer from April 2012 to October 2012 were returned to it as faulty within 6 to 12 months of use, by hardware.fr's count (hardware.fr, 2013).
- 39% of the Seagate Barracuda 7200.11 500GB hard drives sold by a large French online retailer from April to September 2009 were returned to it as faulty within 6 to 12 months, after the model's firmware bug (hardware.fr, 2010).
- 52.07% of the OCZ Octane SATA 2 128GB SSDs sold by a large French online retailer from April to October 2012 were returned to it as faulty within 6 to 12 months, and 45.26% of the OCZ Petrol 128GB (hardware.fr, 2013).
- 10% of the Seagate Desktop HDD 6TB drives sold by a large French online retailer in the second half of 2016 were returned to it as faulty within a year, on a sample under 200 units, the worst drive in hardware.fr's last dossier (hardware.fr, 2017).
- 9.71% of the WD Caviar Black 2TB (WD2001FASS) hard drives sold by a large French online retailer from October 2009 to April 2010 were returned to it as faulty within 6 to 12 months, the worst of the 2TB drives listed (hardware.fr, 2010).
- 1.9% of the 18,533 IDE 7200 rpm hard drives LDLC, a large French online retailer, sold in the first months of 2003 were returned to it as faulty within at most 6 months of use, by hardware.fr's count (hardware.fr, 2003).
Recovery labs' brand counts
Sources: Backblaze (2013-2026); University of Essex and Sungkyunkwan University; Seagate Technology (2022, 2026); Western Digital (2023, 2025); Toshiba Electronics Europe; Hardware.fr (2003-2017); Gillware Data Recovery
Do hard drives and SSDs warn before they fail?
23.3% of failed hard drives in a cloud fleet gave no warning in its five watched SMART attributes (Backblaze, 2016).

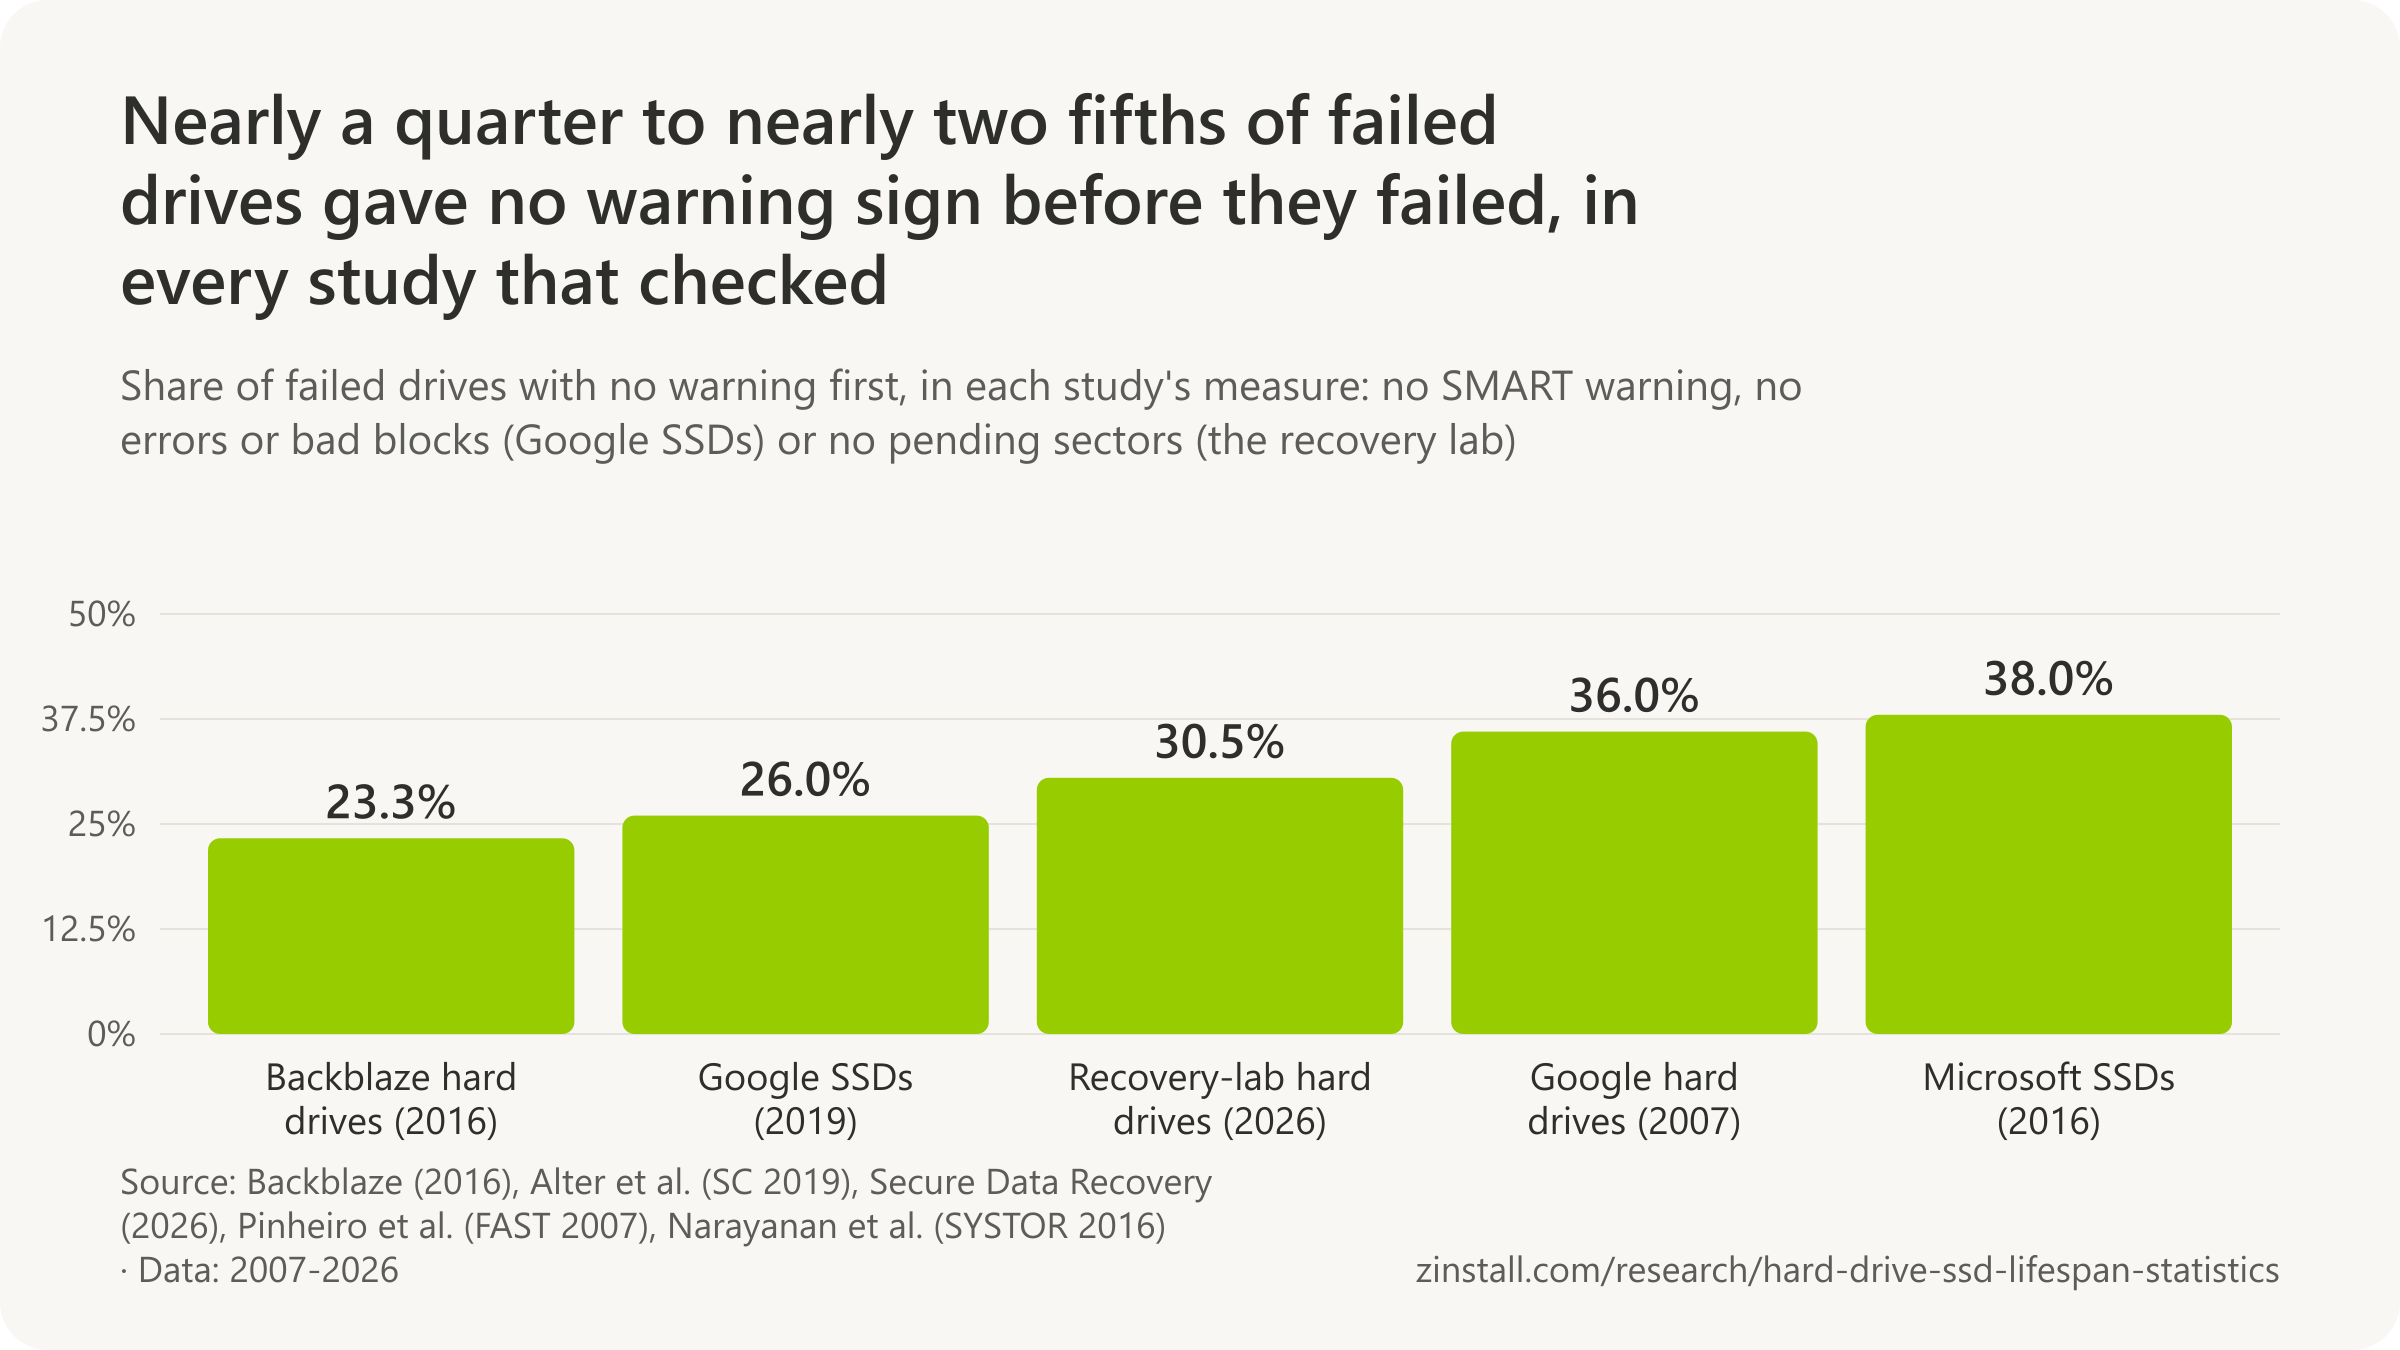
- 38% of the SSDs that failed in large data centres showed none of four SMART warning signs beforehand (Narayanan et al., 2016).
- After its first scan error, a hard drive in Google's data centres was 39 times as likely to fail within 60 days.
- Over 36% of the failed drives in Google's data centres had no SMART errors at all.
- 67.1% of NetApp drives with an unreadable sector at 12 months had developed another by 18 months.
- Half of the drives that went on to fail did so within two days of passing 200 reallocated sectors, for one model in EMC's systems.
| Source and measure | Figure |
|---|---|
| Backblaze: failed drives that showed a SMART warning | 76.7% |
| Backblaze: working drives showing the same warning | 4.2% |
| Google: failed drives with none of the four strongest signals | over 56% |
| Google: after a first reallocated sector | over 14x |
| IBM: replacements predicted a month ahead from SMART data | 73-75% |
| Microsoft: SSDs with a SMART symptom against those without | 3x to 20x |
| Google: failed SSDs with no errors or bad blocks first | 26% |
| A US recovery lab: failed drives with no pending sectors | 30.5% |
| Google: an SSD's chance of another uncorrectable error the next month | nearly 30% vs 2% |
| NetApp: drives that developed unreadable sectors in 32 months | 3.45% |
Sources: Backblaze; ACM, Proceedings of the 9th ACM International Systems and Storage Conference; Google; NetApp and University of Wisconsin-Madison; EMC Corporation and Datrium; IBM Research Zurich; ACM / IEEE, Proceedings of the International Conference; Secure Data Recovery Services; USENIX, Proceedings of the 14th USENIX Conference on File and Storage Technologies
Related guides: Windows detected a hard disk problem · A hard drive with bad sectors
More statistics (39)
Often, but not reliably. SMART, the self-monitoring every drive reports, flags most failing drives in advance, and a drive's first bad sector or scan error multiplies its chance of failing soon. But in every large study a quarter to two fifths of the drives that failed gave no warning at all, for hard drives and SSDs alike.
Failed drives that gave no warning
- 76.7% of the hard drives that failed in Backblaze's data centre had at least one of five warning SMART attributes above zero, against 4.2% of working drives (Backblaze, 2016).
- 4.2% of the working hard drives in Backblaze's data centre showed at least one of the five warning SMART attributes above zero (Backblaze, 2016).
- Over 56% of the hard drives that failed had no count in any of the four SMART signals most tied to failure (scan errors, reallocations, offline reallocations, probational counts), in Google's data centres (Google, 2007).
Hard drives: what SMART and bad sectors predict
- 47.0% of failed hard drives in Backblaze's data centre had recorded high-fly writes (SMART 189), against 16.4% of working drives (Backblaze, 2016).
- 5 of the more than 70 SMART statistics are the ones Backblaze used in 2014 to flag hard drives for replacement, because they are consistent across makers and predict failure (Backblaze, 2014).
- About 40% of the hard drives that failed had a reallocated-sector count, the most common SMART warning among them, ahead of seek errors (about 30%) and offline reallocations (about 27%), in Google's data centres (Google, 2007).
- Hard drives were 39 times more likely to fail within 60 days after their first SMART scan error than drives without scan errors, in Google's data centres (Google, 2007).
- Hard drives with one or more SMART scan errors were ten times more likely to fail than drives without, measured as annualized failure rates in Google's data centres (Google, 2007).
- A little over 70% of hard drives were still working eight months after their first SMART scan error, in Google's data centres (Google, 2007).
- About 9% of hard drives had a reallocated-sector count above zero, in Google's data centres (Google, 2007).
- Hard drives were over 14 times more likely to fail within 60 days after their first reallocated sector than drives with none, in Google's data centres (Google, 2007).
- About 85% of hard drives were still working eight months after their first reallocated sector, in Google's data centres (Google, 2007).
- Hard drives were over 21 times more likely to fail within 60 days after their first offline reallocation (a bad sector found by background scanning) than drives with none, in Google's data centres (Google, 2007).
- Hard drives were 16 times more likely to fail within 60 days after their first probational (suspect-sector) count than drives with none, in Google's data centres (Google, 2007).
- More than 50% of hard drives failed once their reallocated-sector count passed 40, against 1.7% of drives with no reallocated sectors, for one SATA model in EMC backup appliances (EMC, 2015).
- Half of the hard drives that went on to fail did so within two days once their reallocated-sector count passed 200, for one SATA model in EMC backup appliances (EMC, 2015).
- 73% to 75% of hard drive replacements were predicted a month in advance from SMART data by IBM's model, for two drive models in Backblaze's data centres (IBM Research, 2016).
- 3.45% of hard drives (53,820 of 1.53 million) developed at least one unreadable sector (latent sector error) over 32 months in NetApp storage systems at customer sites (NetApp, 2007).
- 8.5% of nearline (desktop-class ATA) hard drives developed unreadable sectors over 32 months, against 1.9% of enterprise-class drives, in NetApp storage systems (NetApp, 2007).
- 3.2% of nearline hard drives developed at least one unreadable sector within 12 months of shipping, against 1.5% of enterprise-class drives, in NetApp storage systems (NetApp, 2007).
- Almost 20% of the drives of one nearline hard drive model developed unreadable sectors within 24 months of shipping, while nearline models ranged from 5% to 20% (NetApp, 2007).
- 67.1% of hard drives that had an unreadable sector by 12 months of age developed at least one more by 18 months, while only 1.8% of all drives developed a first one in that span, in NetApp storage systems (NetApp, 2007).
- Over 60% of unreadable sectors on hard drives were found by background media scrubbing rather than by users' reads, in NetApp storage systems that scan every drive at least every two weeks (NetApp, 2007).
- 9.5% of nearline hard drives a year developed unreadable sectors on average, against 1.4% of enterprise drives, in NetApp storage systems (University of Wisconsin and NetApp, 2008).
- 0.6% to 1.8% of hard drives a month developed unreadable sectors, depending on the model, among 72,878 drives of three models in seven Google data centres (University of Toronto, 2012).
- 25.2% of Seagate ST3000DM001 3 TB hard drives had reallocated sectors, against 0.24% to 11.8% for six other common models, among Backblaze's drives as analysed by the University of Toronto (University of Toronto, 2017).
SSDs: errors, bad blocks and warnings


- 65% of hard drive failures in a hot but dry Microsoft data centre showed SMART 'pre-fail' errors (such as reallocated sectors), 2% 'old-age' errors and 33% controller or connection faults (Microsoft and Rutgers University, 2016).
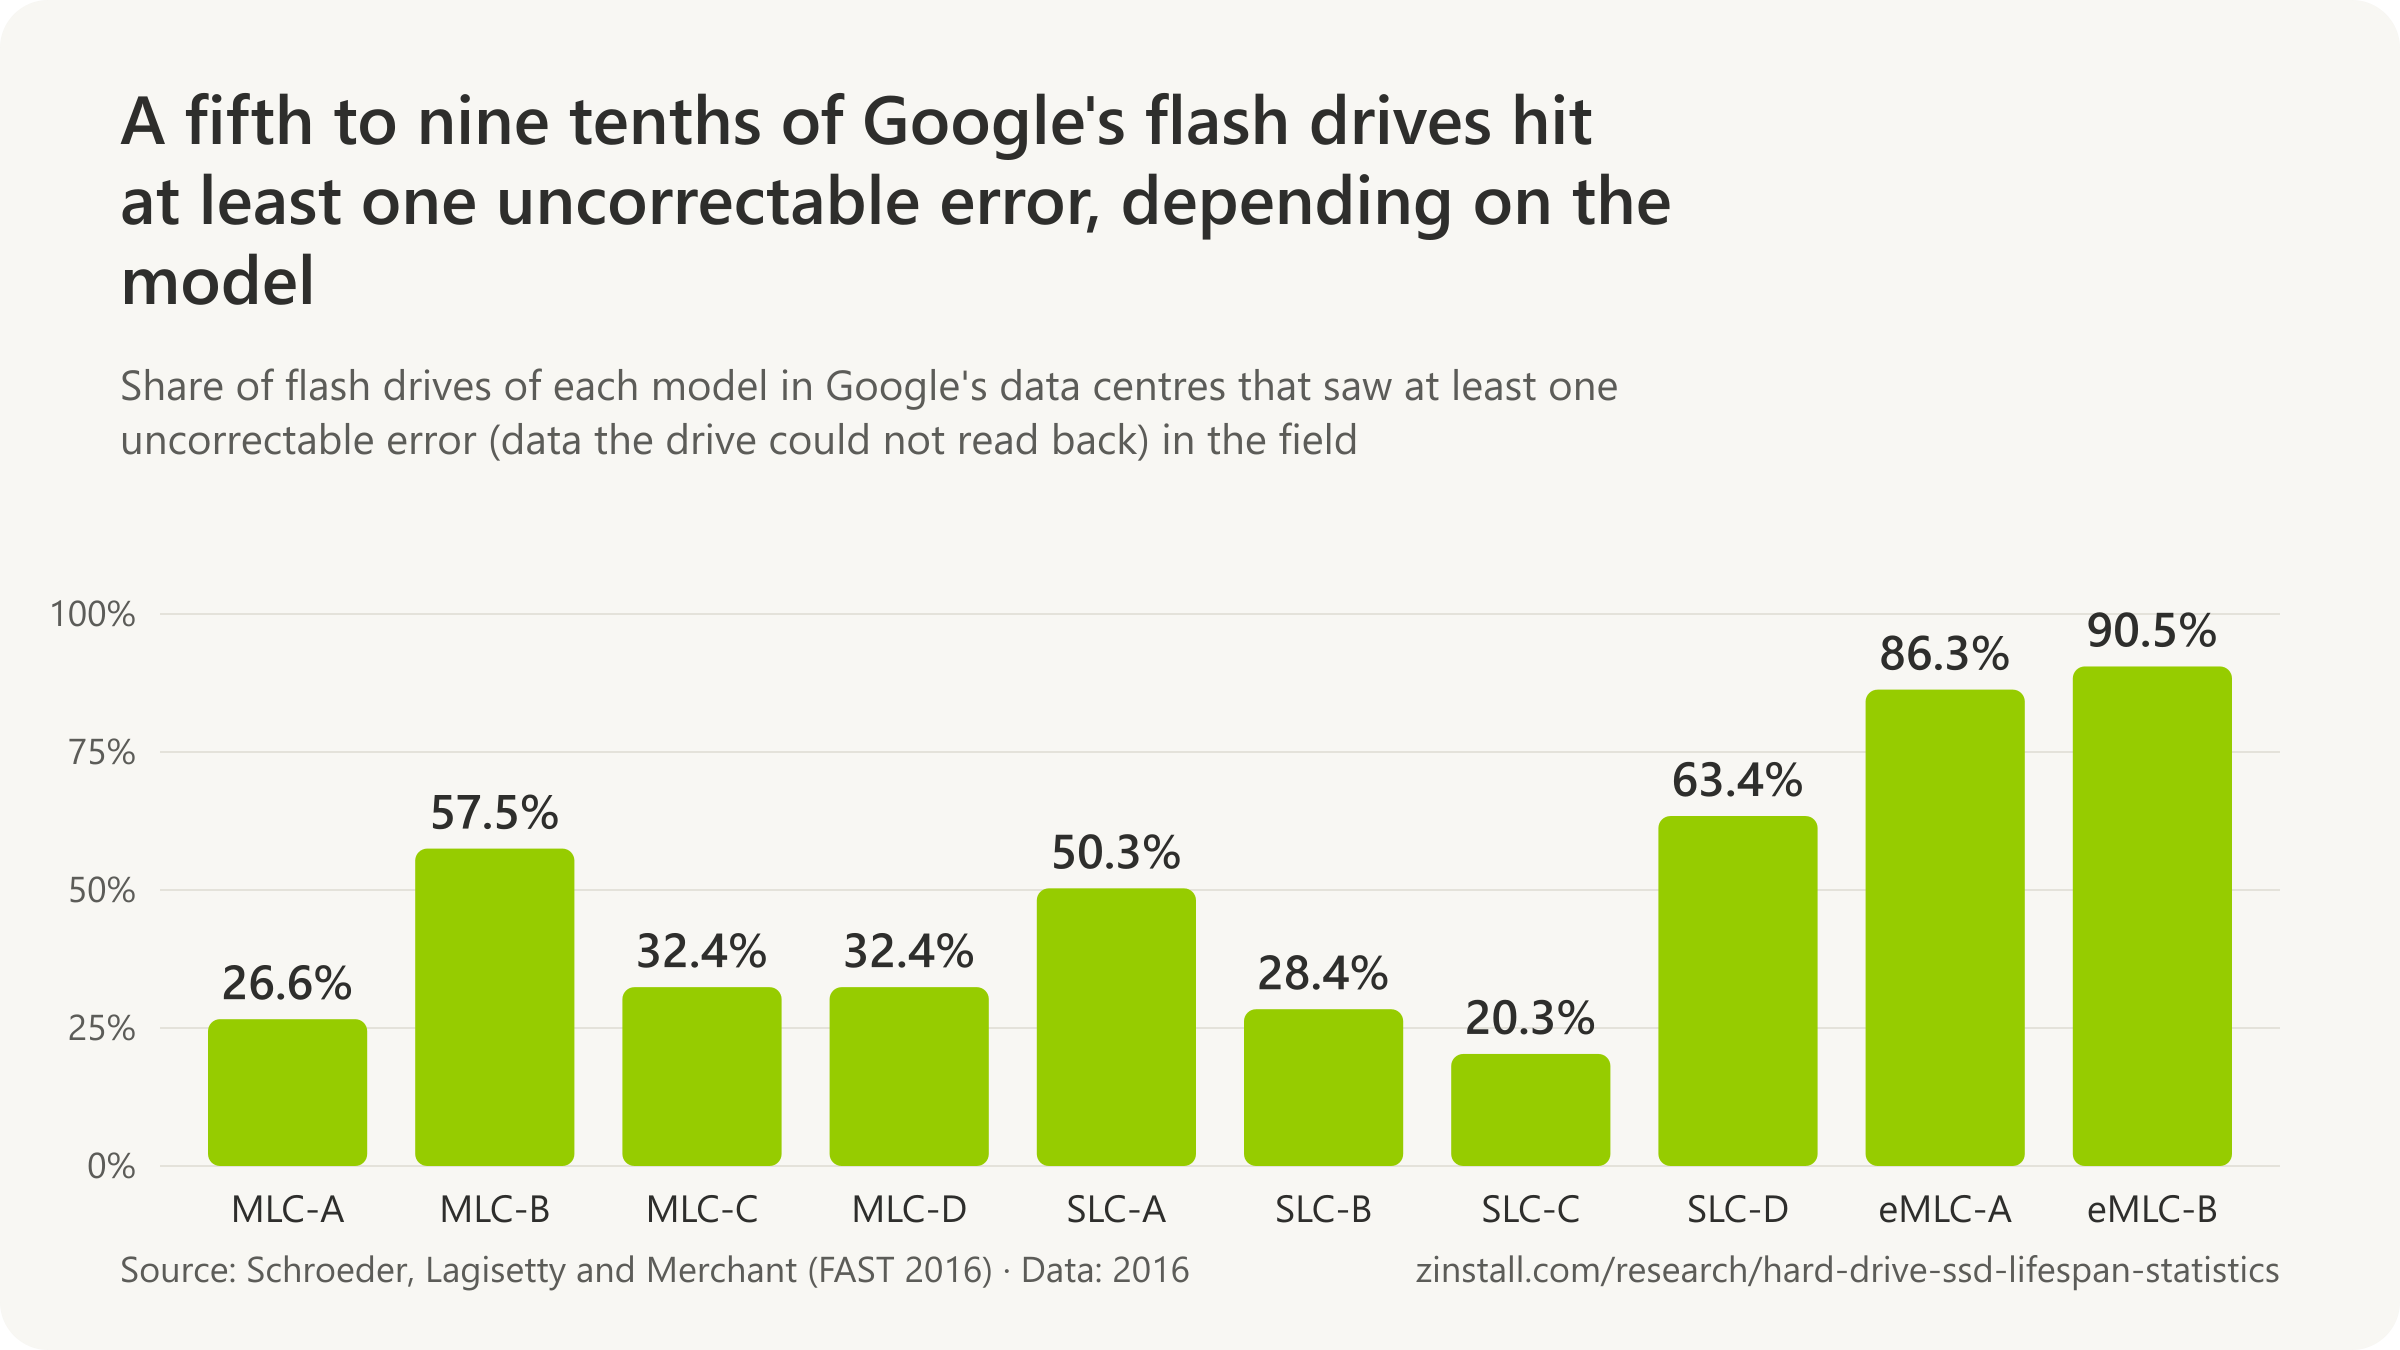
- More than 80% of the newer enterprise-grade eMLC flash drives in Google's data centres developed uncorrectable errors in the field, although none did in Google's accelerated tests before 15,000 program-erase cycles (Schroeder et al., 2016).
- 2 to 6 of every 1,000 days of operation of a Google data-centre flash drive saw an uncorrectable error, depending on the model (Schroeder et al., 2016).
- Once 2 to 4 bad blocks had appeared on a flash drive in Google's data centres, there was a 50% chance that hundreds more would follow (Schroeder et al., 2016).
- 2% to 7% of the flash drives in Google's data centres developed a failed flash chip in their first four years, depending on the model (Schroeder et al., 2016).
- 6% to 9% of the flash drives of most models in Google's data centres needed a technician's repair at some point in their first four years, and 26% to 30% of the two worst models (Schroeder et al., 2016).
- A Google data-centre flash drive had a nearly 30% chance of an uncorrectable error in the month after one, against a 2% chance in a random month (Schroeder et al., 2016).
- About two thirds of the flash chips declared bad in Google's data-centre drives had more than 5% of their blocks fail, beyond the chip makers' guarantee of at most 2% within the rated program-erase cycles (Schroeder et al., 2016).
- 4.2% to 34.1% of the flash SSDs in Facebook's servers had reported at least one uncorrectable error by November 2014, depending on the server platform (Meza et al., 2015).
- SSDs in Microsoft's data centres that showed a SMART warning sign failed 3 to 20 times as often as those that did not, with data errors the strongest sign (Narayanan et al., 2016).
- 8% to 22% of Microsoft's data-centre SSDs failed within nine months of first reporting a data error, depending on the model (Narayanan et al., 2016).
- Enterprise SSDs in NetApp's storage systems that had logged even one unrecoverable block error were replaced significantly more often than the 99.04% of drives that had logged none (Maneas et al., 2020).
Sources: Backblaze (2014, 2016); Google; EMC Corporation and Datrium; IBM Research Zurich; NetApp and University of Wisconsin-Madison; University of Wisconsin-Madison, NetApp and University of Toronto; University of Toronto, with Google data; University of Toronto and Microsoft Research; Rutgers University, GoDaddy and Microsoft; USENIX, Proceedings of the 14th USENIX Conference on File and Storage Technologies; ACM, Proceedings of the 2015 ACM SIGMETRICS International Conference on Measurement and Modeling of Computer Systems; ACM, Proceedings of the 9th ACM International Systems and Storage Conference; USENIX, Proceedings of the 18th USENIX Conference on File and Storage Technologies; USENIX, Proceedings of the 2019 USENIX Annual Technical Conference
What makes hard drives fail sooner?
Each extra 1 °C of drive temperature raised the failure rate by 2.1%, across 443,156 data-centre drives (University of Essex, 2026).

- Hard drives failed up to 260% more often in humid, outside-air-cooled data centres than in a dry one.
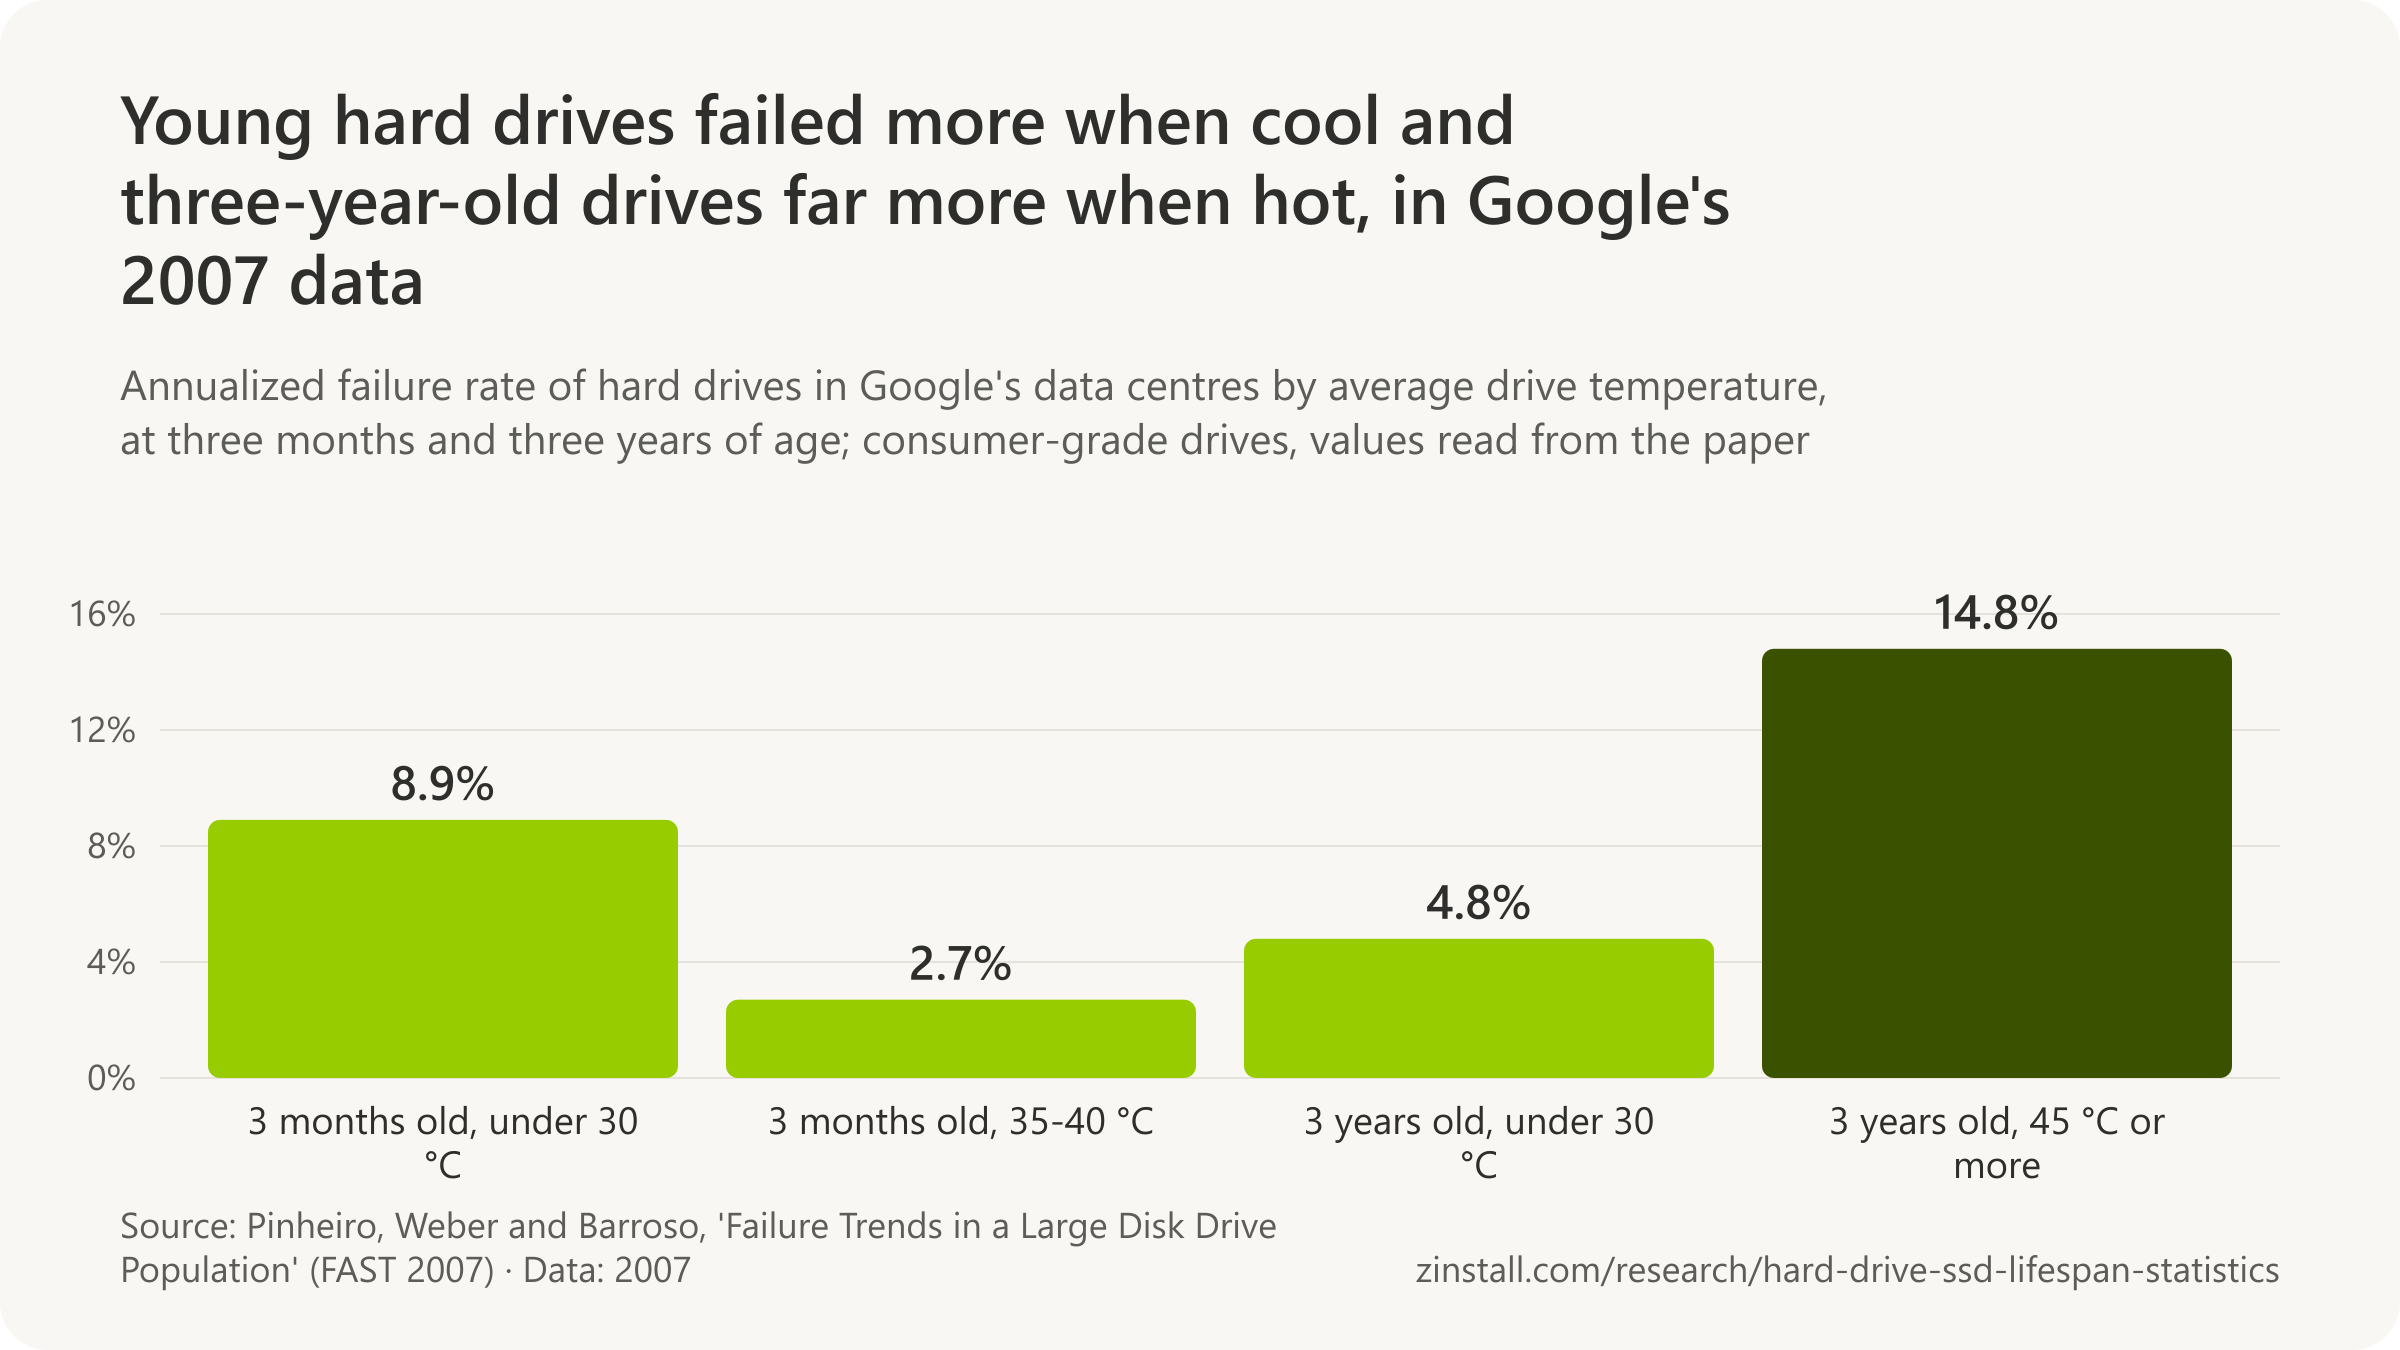
- Heavily used new drives in Google's data centres failed at about 10.4% a year in their first three months, lightly used ones at 3.8%.
- 63% to 66% of the failed drives of three models in EMC's systems failed in their fourth year: drives installed together failed together.
- Sound of 110 decibels or more can damage hard disks, and a fire-suppression nozzle reaches about 130.
- 81.97% of hard-drive cases at one US recovery lab involved physical damage, against 18.03% software problems.
| Source and finding | Figure |
|---|---|
| Backblaze: correlation of temperature and failure, 2014 | 0.0 |
| Toronto: rise in monthly failures per degree, 2012 | 0.001 points per °C |
| Microsoft: controller or connection failures at a humid site | 66% |
| Carnegie Mellon: two failures within an hour, against the model | 4x |
| Facebook: the second SSD in a server failed too | 39.8-59.9% |
| NetApp: a second SSD replaced in the same RAID group within a week | 9.39% (over 180x normal) |
| Backblaze: drives in older against newer storage servers | 0.99% |
| Microsoft: the same SSD model in two server designs | 14x |
| Gillware: recovery cases with a mechanical failure | 48.7% |
| ING, Bucharest: data centre offline after a fire-suppression test | 10 hours |
Sources: University of Essex and Sungkyunkwan University; Rutgers University, GoDaddy and Microsoft; Google; EMC Corporation and Datrium; Siemens AG, released; Secure Data Recovery Services; Backblaze (2024, 2014); University of Toronto, with Google data; Carnegie Mellon University; ACM, Proceedings of the 2015 ACM SIGMETRICS International Conference on Measurement and Modeling of Computer Systems; USENIX, Proceedings of the 18th USENIX Conference on File and Storage Technologies; ACM, Proceedings of the 9th ACM International Systems and Storage Conference; Gillware Data Recovery; Motherboard, quoting ING Bank Romania's press release and spokeswoman
Related guides: Windows detected a hard disk problem · Back up to an external hard drive
More statistics (45)
Heat, humidity, heavy use and the server around a drive all moved failure rates in the large studies, though not always in the expected direction: in Google's data young drives failed more when cool. Failures also come in batches, since drives bought together tend to fail together. Recovery labs, which see the drives people send them, find mostly physical damage: failed heads, bad sectors and damaged platters.
Temperature and humidity
- 0.0 was the correlation Backblaze found between operating temperature and failure across more than 34,000 data-centre hard drives (Backblaze, 2014).
- 34.6% of one Seagate 1.5TB model's drives failed per year when running warmer than the model's average, against 15.6% when cooler, the one clear heat effect in Backblaze's 2014 study (Backblaze, 2014).
- 354 of Backblaze's 259,533 data drives exceeded their maker's maximum temperature for at least a day in the record-hot summer of 2023, and 2 of them failed in the quarter (Backblaze, 2023).
- About one thousandth of a percent more hard drives a month were expected to fail for each 1 °C rise in temperature below 50 °C, against typical monthly failure rates of 0.1% to 0.2%, in Google data centres (University of Toronto, 2012).
- Swings in temperature had a stronger and more consistent link to hard drives developing unreadable sectors than average temperature, in all three drive models studied in Google data centres (University of Toronto, 2012).
- Hard drives in humid free-cooled Microsoft data centres had an annualized failure rate up to 260% higher (5.4% against 1.5%) than in a dry chiller-cooled one, while hot but dry sites stayed near 2% (Microsoft and Rutgers University, 2016).
- 66% of hard drive failures in a humid free-cooled Microsoft data centre were controller-board or connection failures, against 33% in a hot but dry one, which the authors link to condensation and corrosion (Microsoft and Rutgers University, 2016).
- Each extra 1 °C of average drive temperature raised the failure rate by 2.1%, or about 23% for 10 °C, across 443,156 hard drives in Backblaze's data centres (University of Essex and Sungkyunkwan University, 2026).
- Hotter flash SSDs failed more often in Facebook's servers, but drives that throttled themselves when hot largely avoided the effect (Meza et al., 2015).
- Idle SSDs heated by up to 28 °C by busy neighbouring drives in Alibaba's racks showed 57% more device errors after 128 hours in Alibaba's tests (Xu et al., 2019).
Workload and power cycles
- 27.7 power cycles on average had been logged by Backblaze's failed hard drives, against 10.2 for its working drives, a link Backblaze said it could not yet explain (Backblaze, 2016).
- About 10.4% of heavily used hard drives failed in their first three months on an annualized basis, against about 3.8% of lightly used drives, in Google's data centres (Google, 2007).
- About 5.2% of lightly used three-year-old hard drives failed on an annualized basis, slightly more than the 4.6% of heavily used ones, in Google's data centres (Google, 2007).
- High power-cycle counts raised the annualized failure rate of hard drives three years and older by over 2 percentage points, while younger drives showed no link, in Google's data centres (Google, 2007).
- Reading data did not measurably wear out Facebook's server SSDs: the drives that had read the most data showed no statistically significant rise in failures (Meza et al., 2015).
- Older SSD models in Microsoft's data centres failed 2 to 4 times as often when written heavily as when written lightly, while a newer, larger model showed no clear link with writes (Narayanan et al., 2016).
- The most heavily used 15% to 20% of SSDs in one Alibaba Cloud storage service had up to 77.3% more device errors and an up to 18.7% higher failure rate than evenly used drives (Xu et al., 2019).
- Data-analytics and network-storage applications ran on 3.2% of Alibaba's data-centre SSDs but accounted for 9.5% of failed SSDs in 2018 and 2019 (Han et al., 2021).
Failures in batches
- Two hard drives failing within the same hour in a 765-node cluster was four times as likely as the standard model predicts, a risk for RAID rebuilds (Carnegie Mellon University, 2007).
- About one third of hard drive failures came in bursts, 90% of them spread across several racks, among 32,000+ drives in the Summit supercomputer's storage system over 2.75 years (Oak Ridge National Laboratory, 2023).
- The 10% of Facebook's server SSDs with the most errors accounted for over 80% of all uncorrectable errors on every platform (Meza et al., 2015).
- 99.8% of Facebook's server SSDs that had an error in one week also had an error the following week (Meza et al., 2015).
- When one of the two SSDs in a Facebook server failed, the other had also failed in 39.8% to 59.9% of cases, depending on the platform, against 27.3% expected on one platform if failures were independent (Meza et al., 2015).
- After one SSD was replaced in a NetApp RAID group, there was a 9.39% chance of another replacement in the same group within a week, over 180 times the chance in a random week (Maneas et al., 2020).
The server around the drive
- 0.99% of the hard drives in Backblaze's older Storage Pod 5.0 vaults failed on an annualized basis in Q3 2023, against 2.14% in its newer 6.0 vaults, although the 5.0 drives were about twice as old (Backblaze, 2024).
- The same SSD model failed 14 times as often in one Microsoft server design as in another, showing that the server around a drive affects its failure rate (Narayanan et al., 2016).
Noise and vibration
- Hard disks can be damaged by sound levels of 110 decibels or more and the vibrations they cause, according to experiments by Siemens Corporate Technology on noise from gas fire-suppression nozzles in data centres (Siemens, 2016).
- About 130 decibels, as loud as a fighter jet taking off, is the noise of a conventional gas fire-extinguishing nozzle by Siemens' measurements, against the under-100 decibels its quieter nozzle is designed for (Siemens, 2016).
- ING Bank's main data centre in Bucharest took 10 hours to restart after the noise of an inert-gas fire-suppression test damaged several servers and storage equipment on 10 September 2016, cutting card and online banking for that time (Motherboard, 2016).
- The noise of an inert-gas fire-suppression release at DigiPlex's data centre near Stockholm on 18 April 2018 destroyed server disk drives and took the Nasdaq Nordic exchanges offline until the afternoon (The Register, 2018).
Failure modes and what recovery labs see

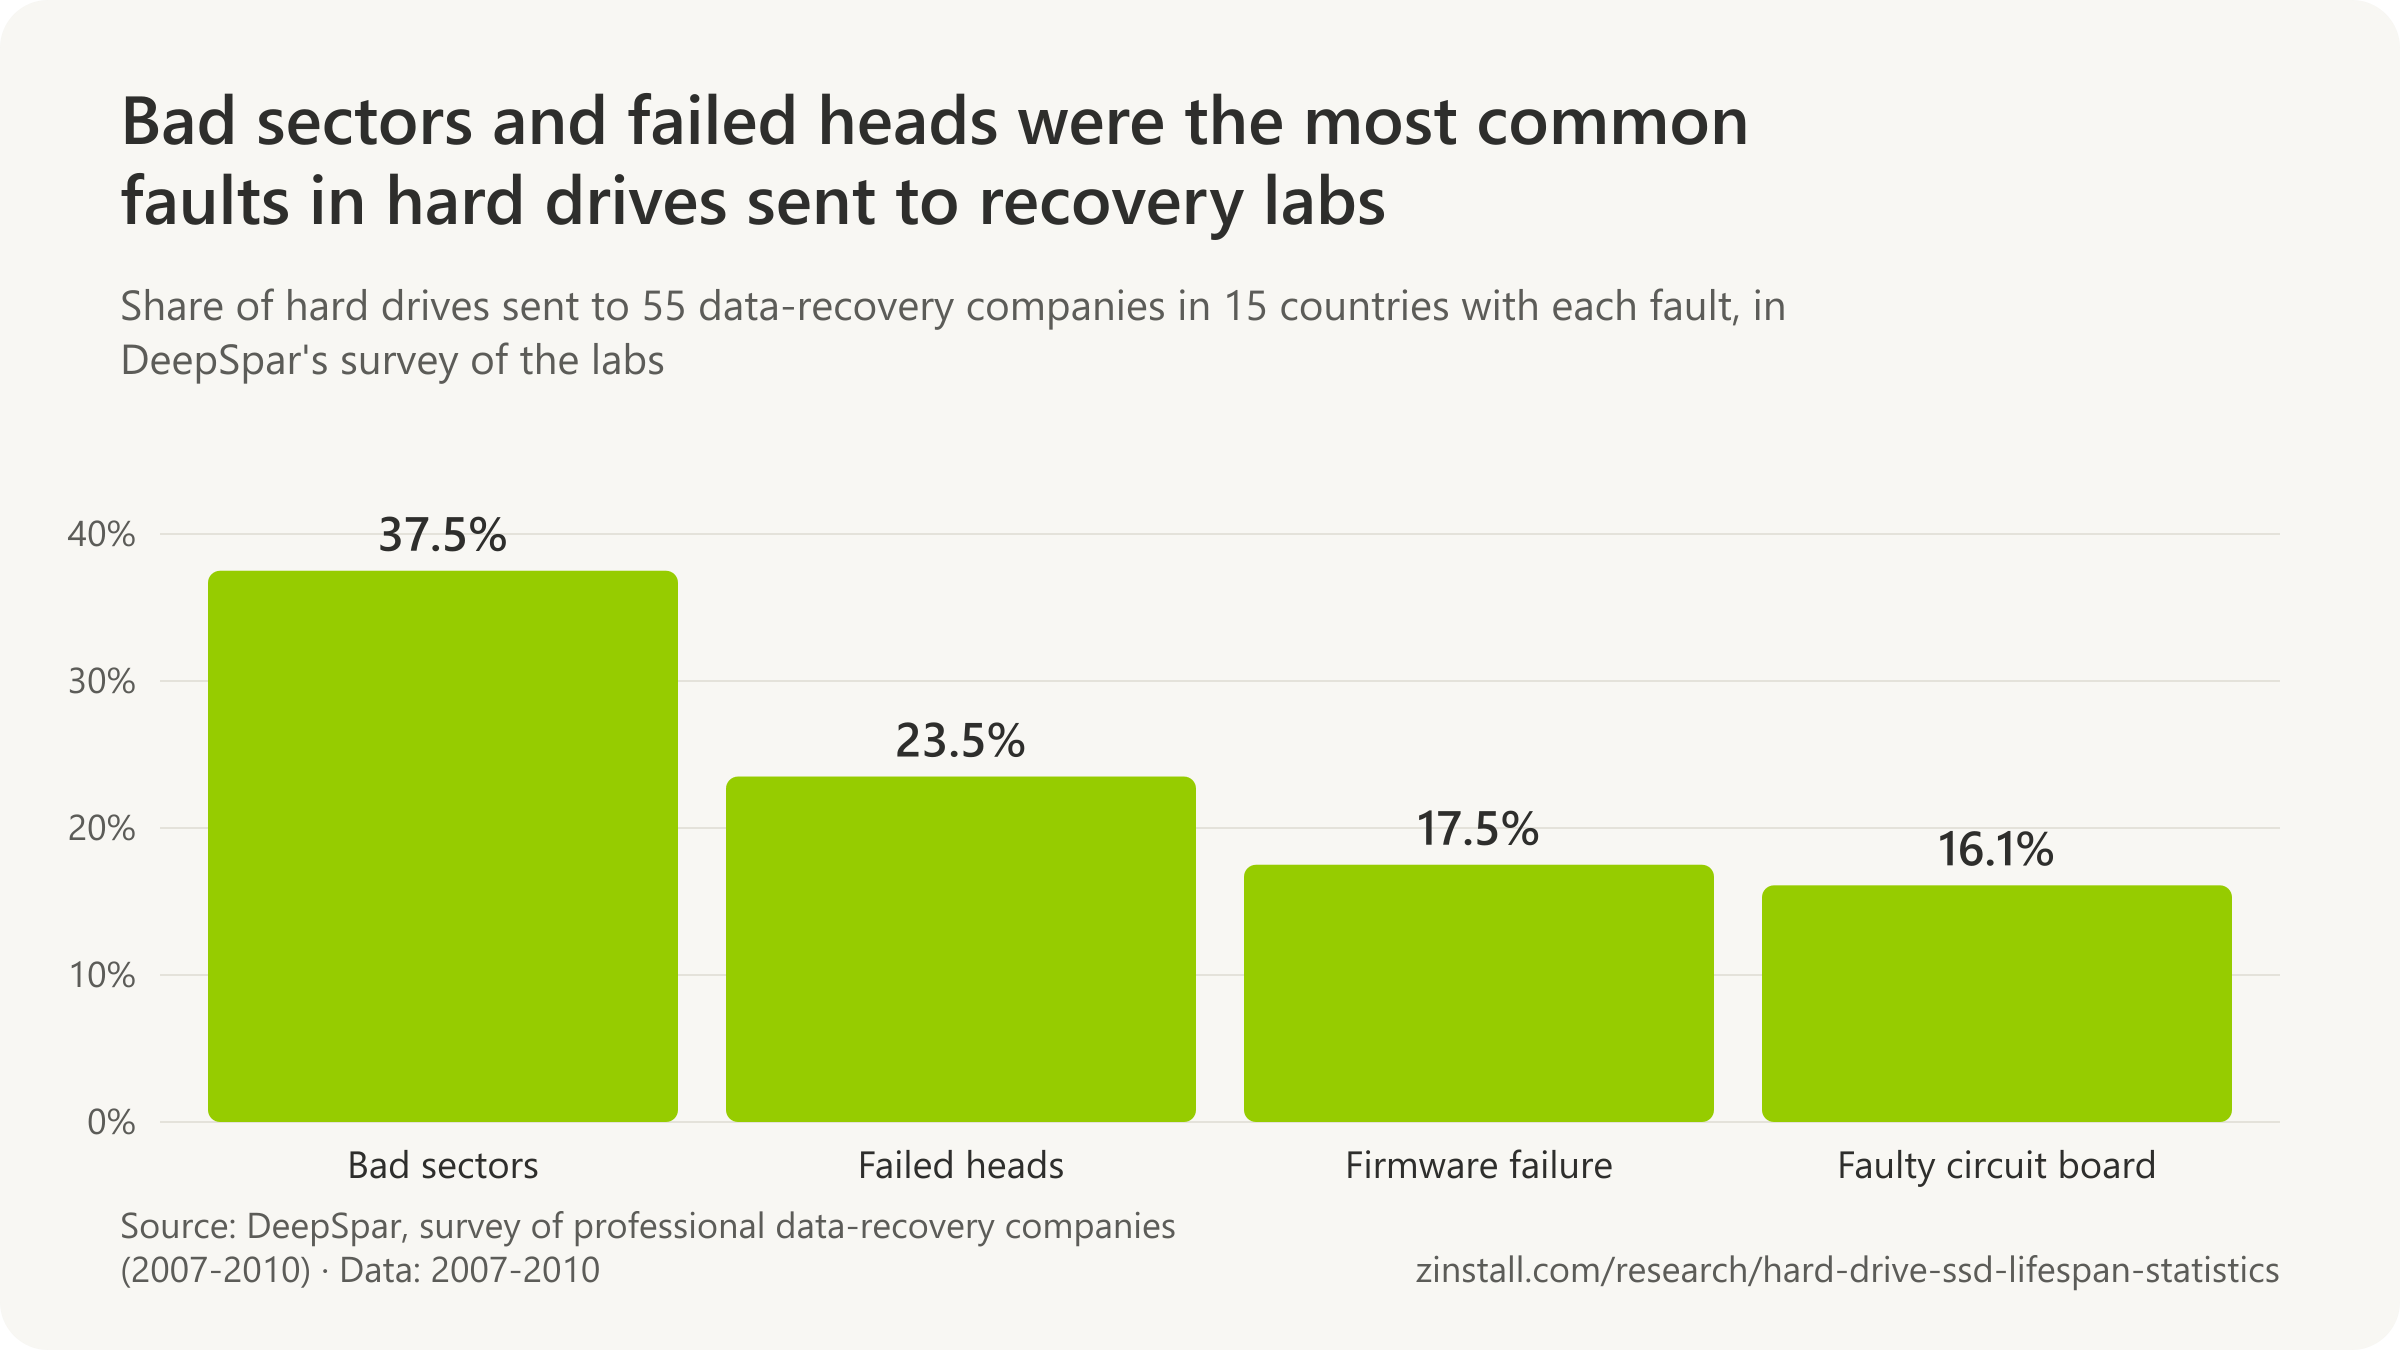
- 0.86% of nearline SATA hard drives developed silent data corruption (blocks whose checksum no longer matched) over 41 months, against 0.065% of enterprise drives, in NetApp storage systems (University of Wisconsin and NetApp, 2008).
- 8% of the silent data corruptions on hard drives were discovered during RAID reconstruction, when data can be lost, among more than 400,000 cases in NetApp storage systems (University of Wisconsin and NetApp, 2008).
- 44.1% of failures of the most common hard drive model were data corruptions and 19.1% failed I/O requests, while for the second model I/O request errors led at 45.5%, in Alibaba Cloud data centres (Chinese University of Hong Kong and Alibaba, 2019).
- 0.22% of the time a hard drive ran at least twice as slow as its peers in the same RAID group, across 458,482 drives in NetApp customer systems (University of Chicago and NetApp, 2016).
- 26% of hard drives had at least one spell of running twice as slow as their RAID peers in about 87 days, across 458,482 drives in NetApp customer systems (University of Chicago and NetApp, 2016).
- 88.14% of the recovery cases logged by Gillware over a few weeks in 2016 were hard drives and 2.03% SSDs, among 295 cases, by the firm's own count (Gillware, 2016).
- 48.66% of the recovery cases logged by Gillware in 2016 involved a mechanical failure, 21.14% firmware, 15.44% magnetic media degradation and 12.75% electrical failure, against 1.01% logical, by the firm's own count (Gillware, 2016).
- 70% of the hard-drive failures DriveSavers saw in its recovery labs were media damage, including head crashes, 18% circuit-board failures, 11% stuck heads (stiction) and 1% motor failures, by DriveSavers' count published by Backblaze (Backblaze, 2019).
- 18% of the hard-drive failures DriveSavers saw in its recovery labs were circuit-board failures, by DriveSavers' count published by Backblaze (Backblaze, 2019).
- 81.97% of the hard-drive recovery cases in a Secure Data Recovery sample involved physical damage and 18.03% software (logical) issues, by the firm's own count (Secure Data Recovery, 2024).
- 60.62% of the SSD recovery cases in a Secure Data Recovery sample involved physical damage and 39.38% software (logical) issues, by the firm's own count (Secure Data Recovery, 2024).
- 50% of the hard-drive failures among about 30,000 drives sent to Payam Data Recovery in Australia from 2020 to 2025 came from physical damage such as drops, and 50% from mechanical or electronic faults (Payam Data Recovery, 2025).
- The Seagate ST2000LM007 and Western Digital WD20SDRW, 2TB drives common in portable and external drives, topped all three failure lists (head crashes, head failures, bad sectors) among the drives sent to Payam Data Recovery from 2020 to 2025 (Payam Data Recovery, 2025).
- Ontrack's senior manager for data recovery said in 2016 that failure rates of SSDs and hard drives are consistent, though they fail in different ways (Ontrack, 2016).
Sources: Backblaze (2014-2024); University of Toronto, with Google data; Rutgers University, GoDaddy and Microsoft; University of Essex and Sungkyunkwan University; ACM, Proceedings of the 2015 ACM SIGMETRICS International Conference on Measurement and Modeling of Computer Systems; USENIX, Proceedings of the 2019 USENIX Annual Technical Conference; Google; ACM, Proceedings of the 9th ACM International Systems and Storage Conference; USENIX, Proceedings of the 19th USENIX Conference on File and Storage Technologies; Carnegie Mellon University; Oak Ridge National Laboratory; USENIX, Proceedings of the 18th USENIX Conference on File and Storage Technologies; Siemens AG, released; Motherboard, quoting ING Bank Romania's press release and spokeswoman; The Register; University of Wisconsin-Madison, NetApp and University of Toronto; The Chinese University of Hong Kong and Alibaba; University of Chicago and NetApp; Gillware Data Recovery; Secure Data Recovery Services; Payam Data Recovery; Ontrack; DeepSpar Data Recovery Systems
How many terabytes can an SSD write before it wears out?
A Samsung 850 Pro 256 GB SSD wrote about 9.1 PB before failing, 60 times its rating (c't, 2017).

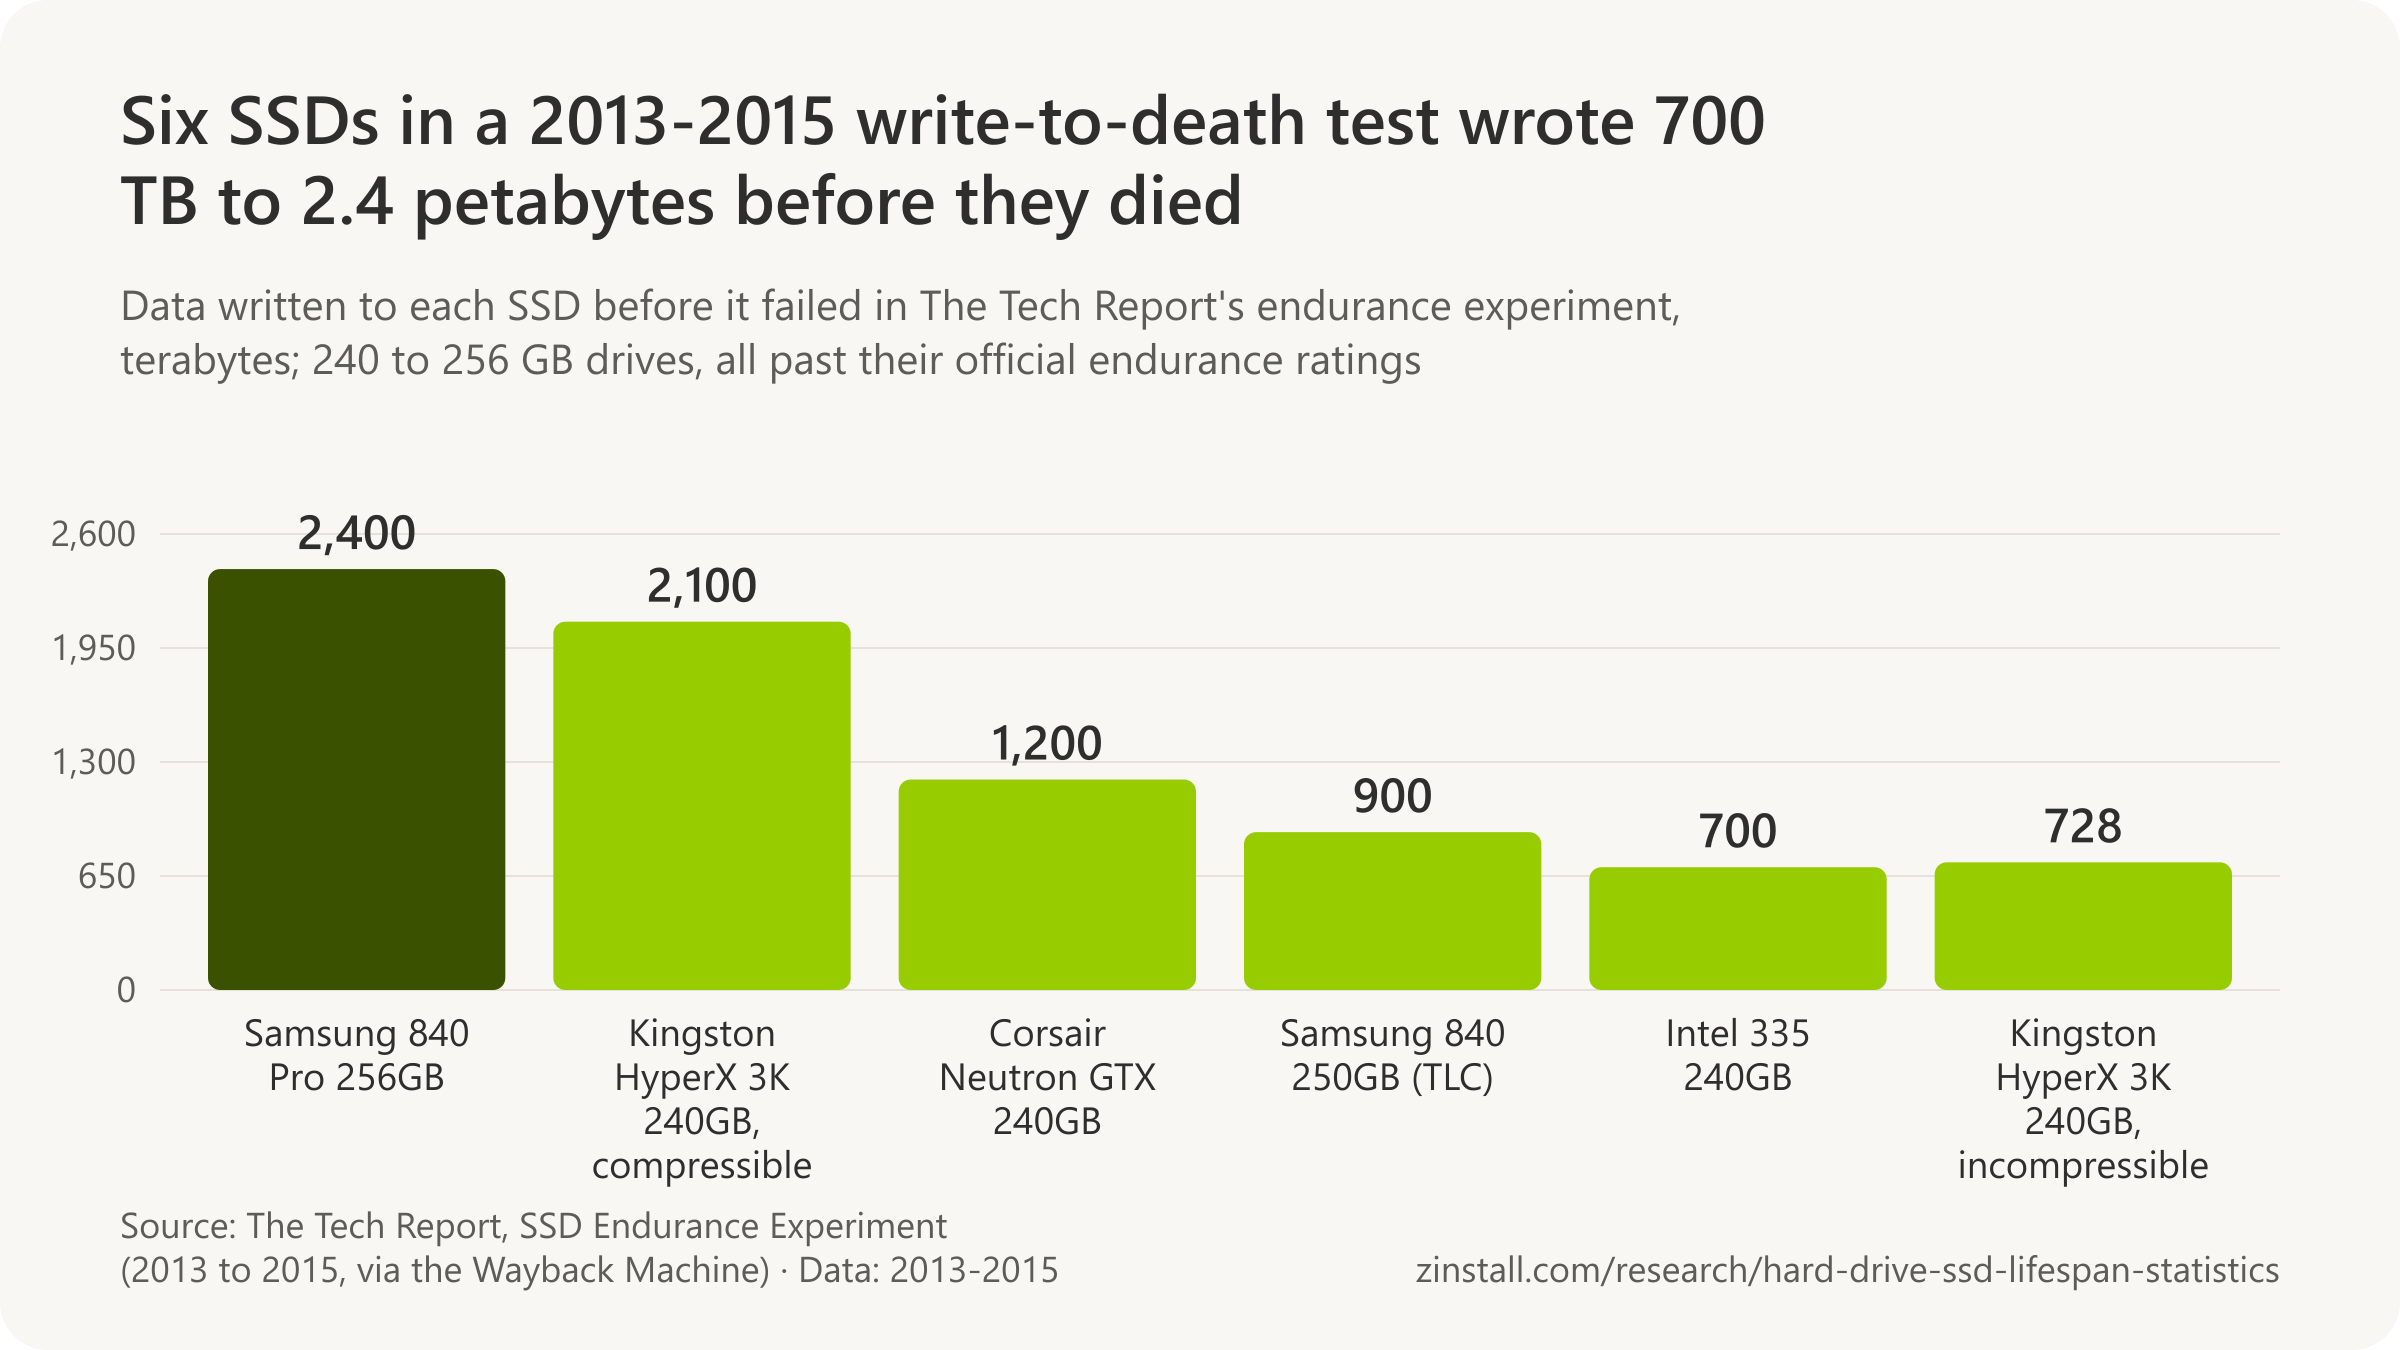
- All six SSDs in a 2013-2015 write-to-death test wrote hundreds of terabytes past their official ratings.
- 60% of the enterprise SSDs in NetApp's systems used less than 1% of their rated wear a year.
- A 600 TBW rating over five years allows about 329 GB of writes a day.
- Intel's assumed 20 GB a day for five years totals 36.5 TB, about 6% of a 600 TBW rating.
- 1 TB consumer SSDs are rated for 220 to 800 TBW, an almost fourfold range.
| Drive or source and measure | Figure |
|---|---|
| Samsung 990 PRO 2 TB | 1,200 TBW |
| Samsung 990 PRO 4 TB | 2,400 TBW |
| Samsung 860 PRO 1 TB (older model) | 1,200 TBW |
| Samsung 850 PRO 1 TB (older model, ten-year warranty) | 10 years |
| Micron 7450 PRO data-centre SSD | 1 DWPD |
| Intel SSD 320: its assumed writes a day, 2011 | up to 20 GB a day |
| What Sandisk says a home user writes a day (no measurement cited) | 20-40 GB a day |
| JEDEC: SSDs allowed to fail by the end of their rated endurance | 3% |
| c't: flash past its specified write cycles | 3 to 30 times |
| Google: rated write cycles its MLC SSDs had used | 18-32% of rated wear (MLC) |
Sources: heise online / c't magazin (2021, 2017); The Tech Report (2015a, 2015b); USENIX, Proceedings of the 20th USENIX Conference on File and Storage Technologies; Samsung Electronics (2026, 2022); Intel Corporation; Crucial, Kingston, Samsung, Sandisk, SK hynix; Micron Technology; Sandisk; JEDEC Solid State Technology Association; USENIX, Proceedings of the 14th USENIX Conference on File and Storage Technologies
Related guides: A new PC with an SSD · Clone or transfer
More statistics (65)
Every SSD is rated for a total amount of data written, its TBW, which is the limit of its warranty rather than a forecast of its death. Write-to-death tests ran drives far past their ratings, and in data centres drives used a small part of their rated endurance before they were retired. Nobody publishes how much a typical PC writes in a year: the makers' assumptions are all there is.
Write-to-death tests

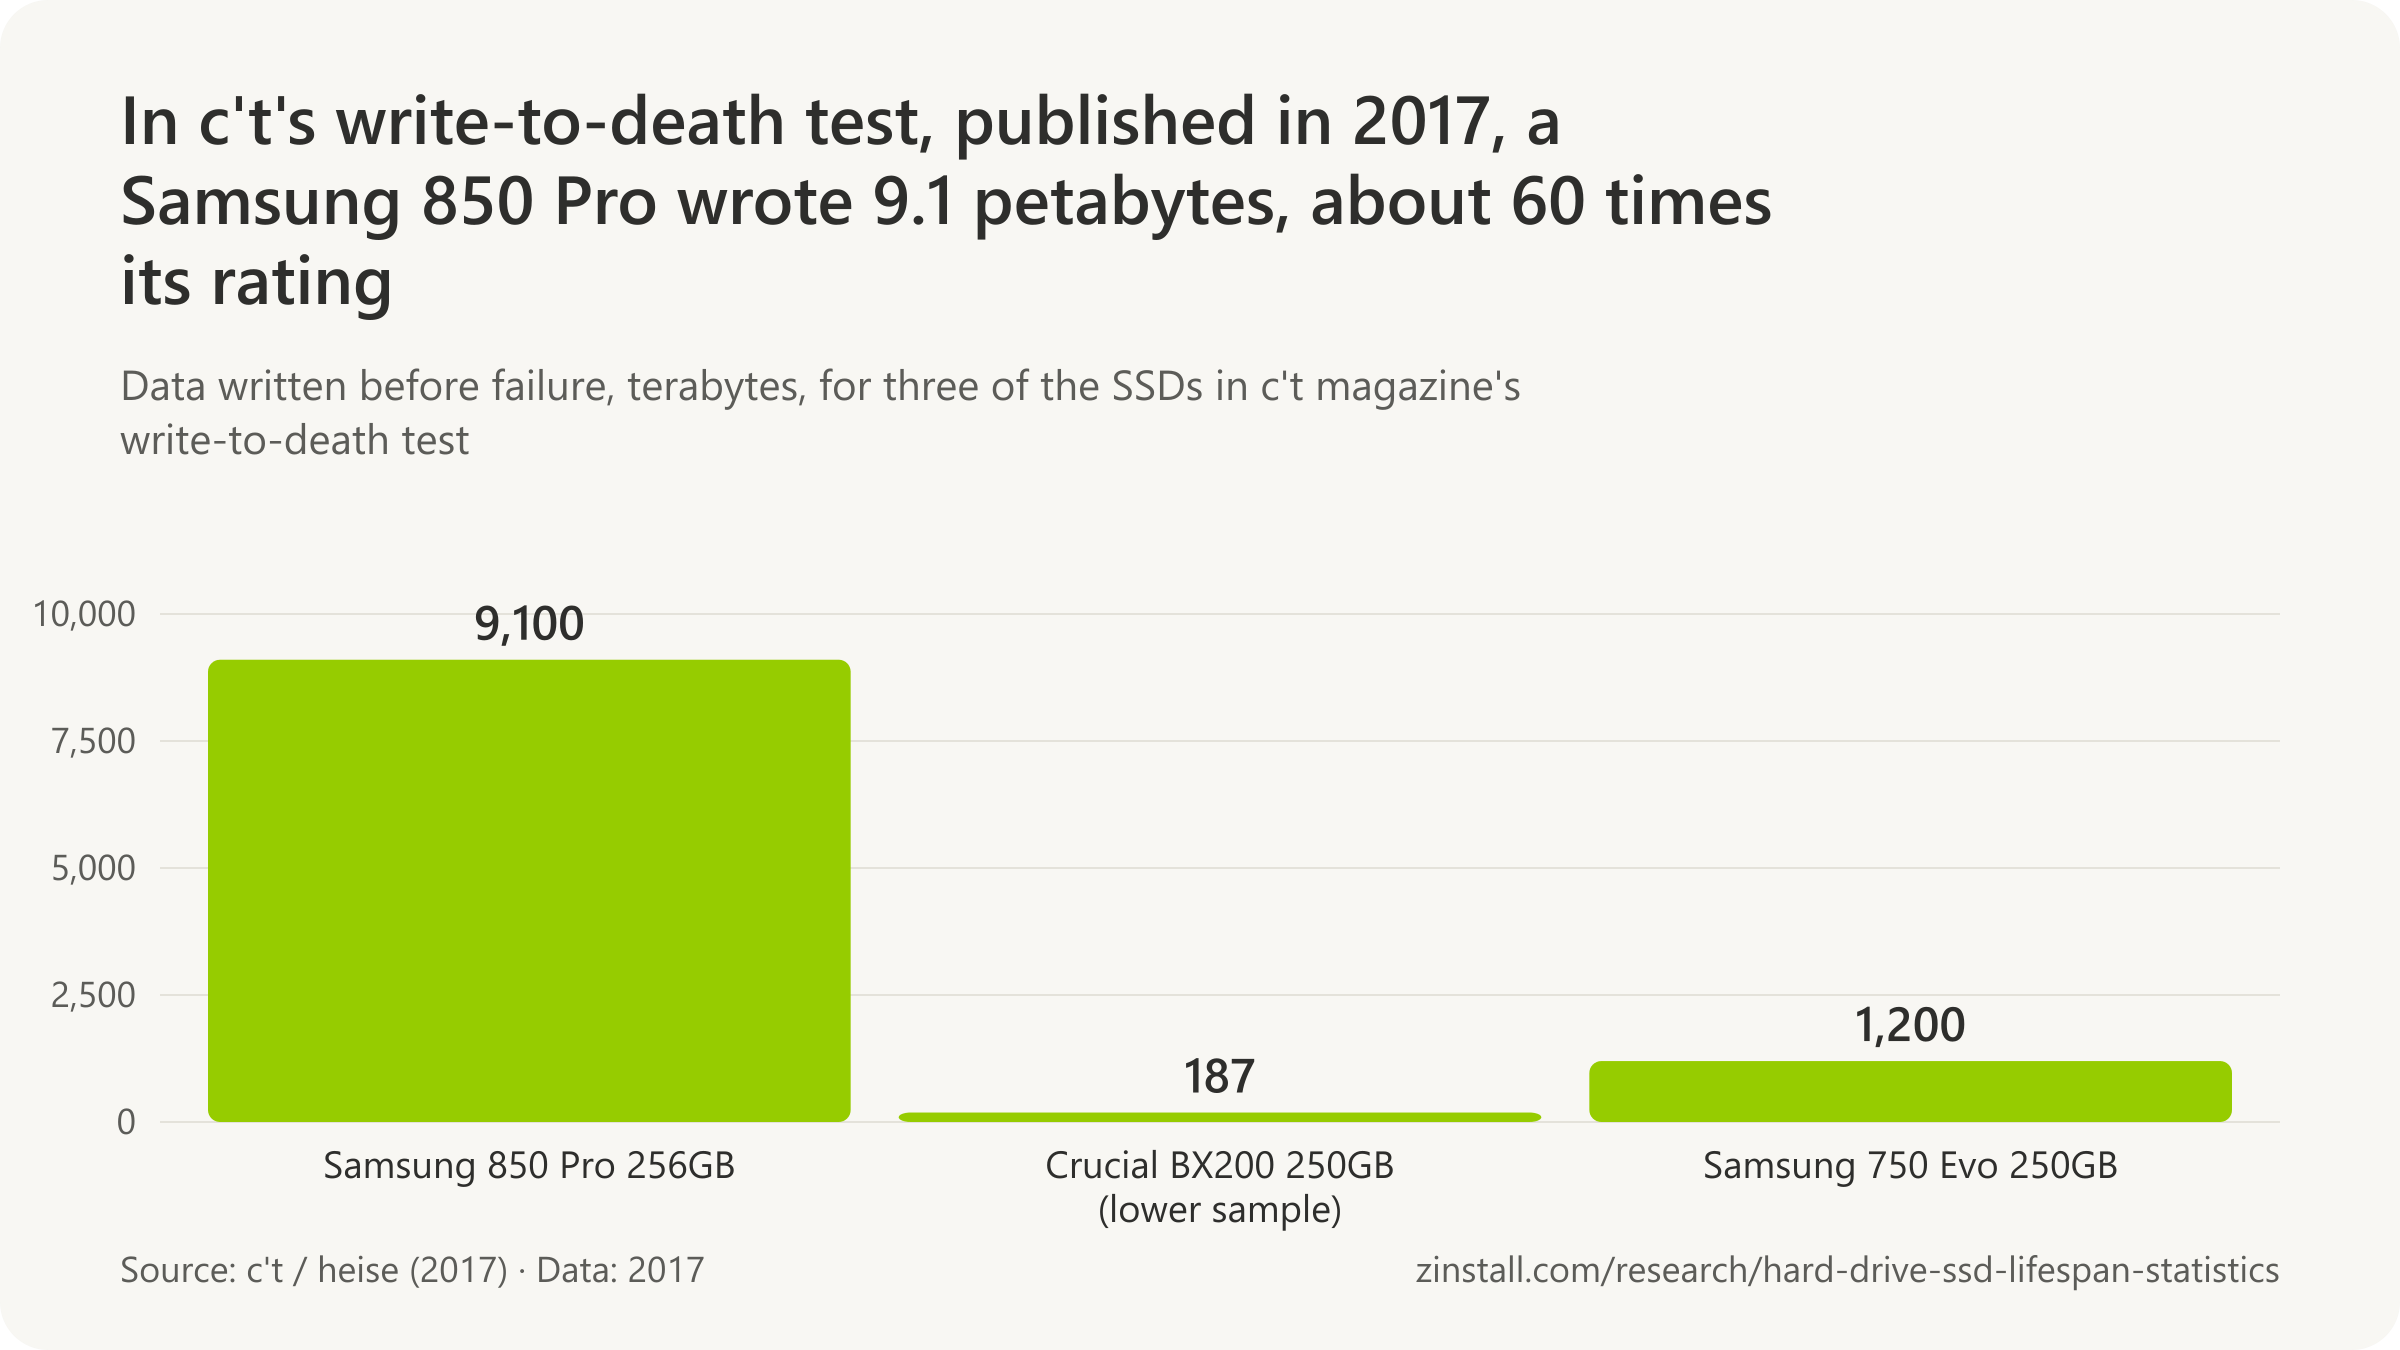
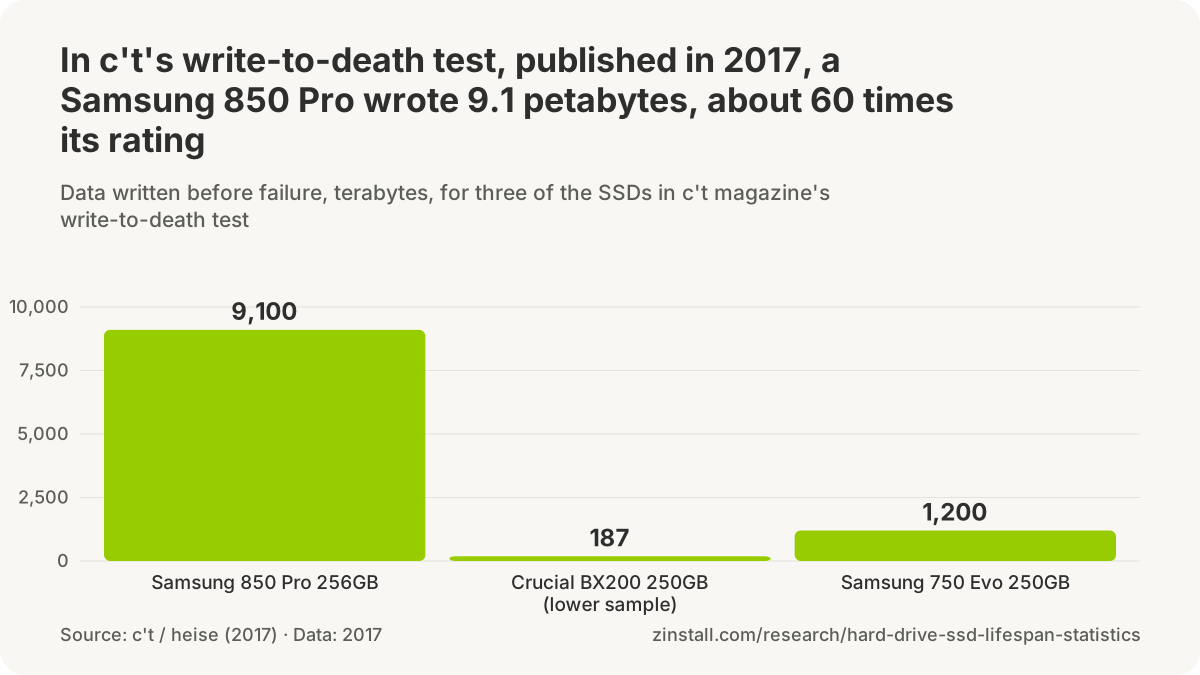
- All six SSDs in The Tech Report's 2013-2015 write-to-death test wrote hundreds of terabytes beyond their official endurance specifications before failing (The Tech Report, 2015).
- In c't's write-to-death test, none of the premium SSDs (Samsung 850 Pro, SanDisk Extreme Pro) failed before 2.2 PB written (c't, 2017).
- Two of the 12 SSDs in c't's write-to-death test died from a voltage spike when a test system failed, not from flash wear (c't, 2017).
- SSDs can exceed their flash's specified program/erase cycles 3 to 30 times before failing a write or read test, but data written that late may not survive unpowered storage, c't reported (c't, 2021).
Rated endurance (TBW) of popular SSDs

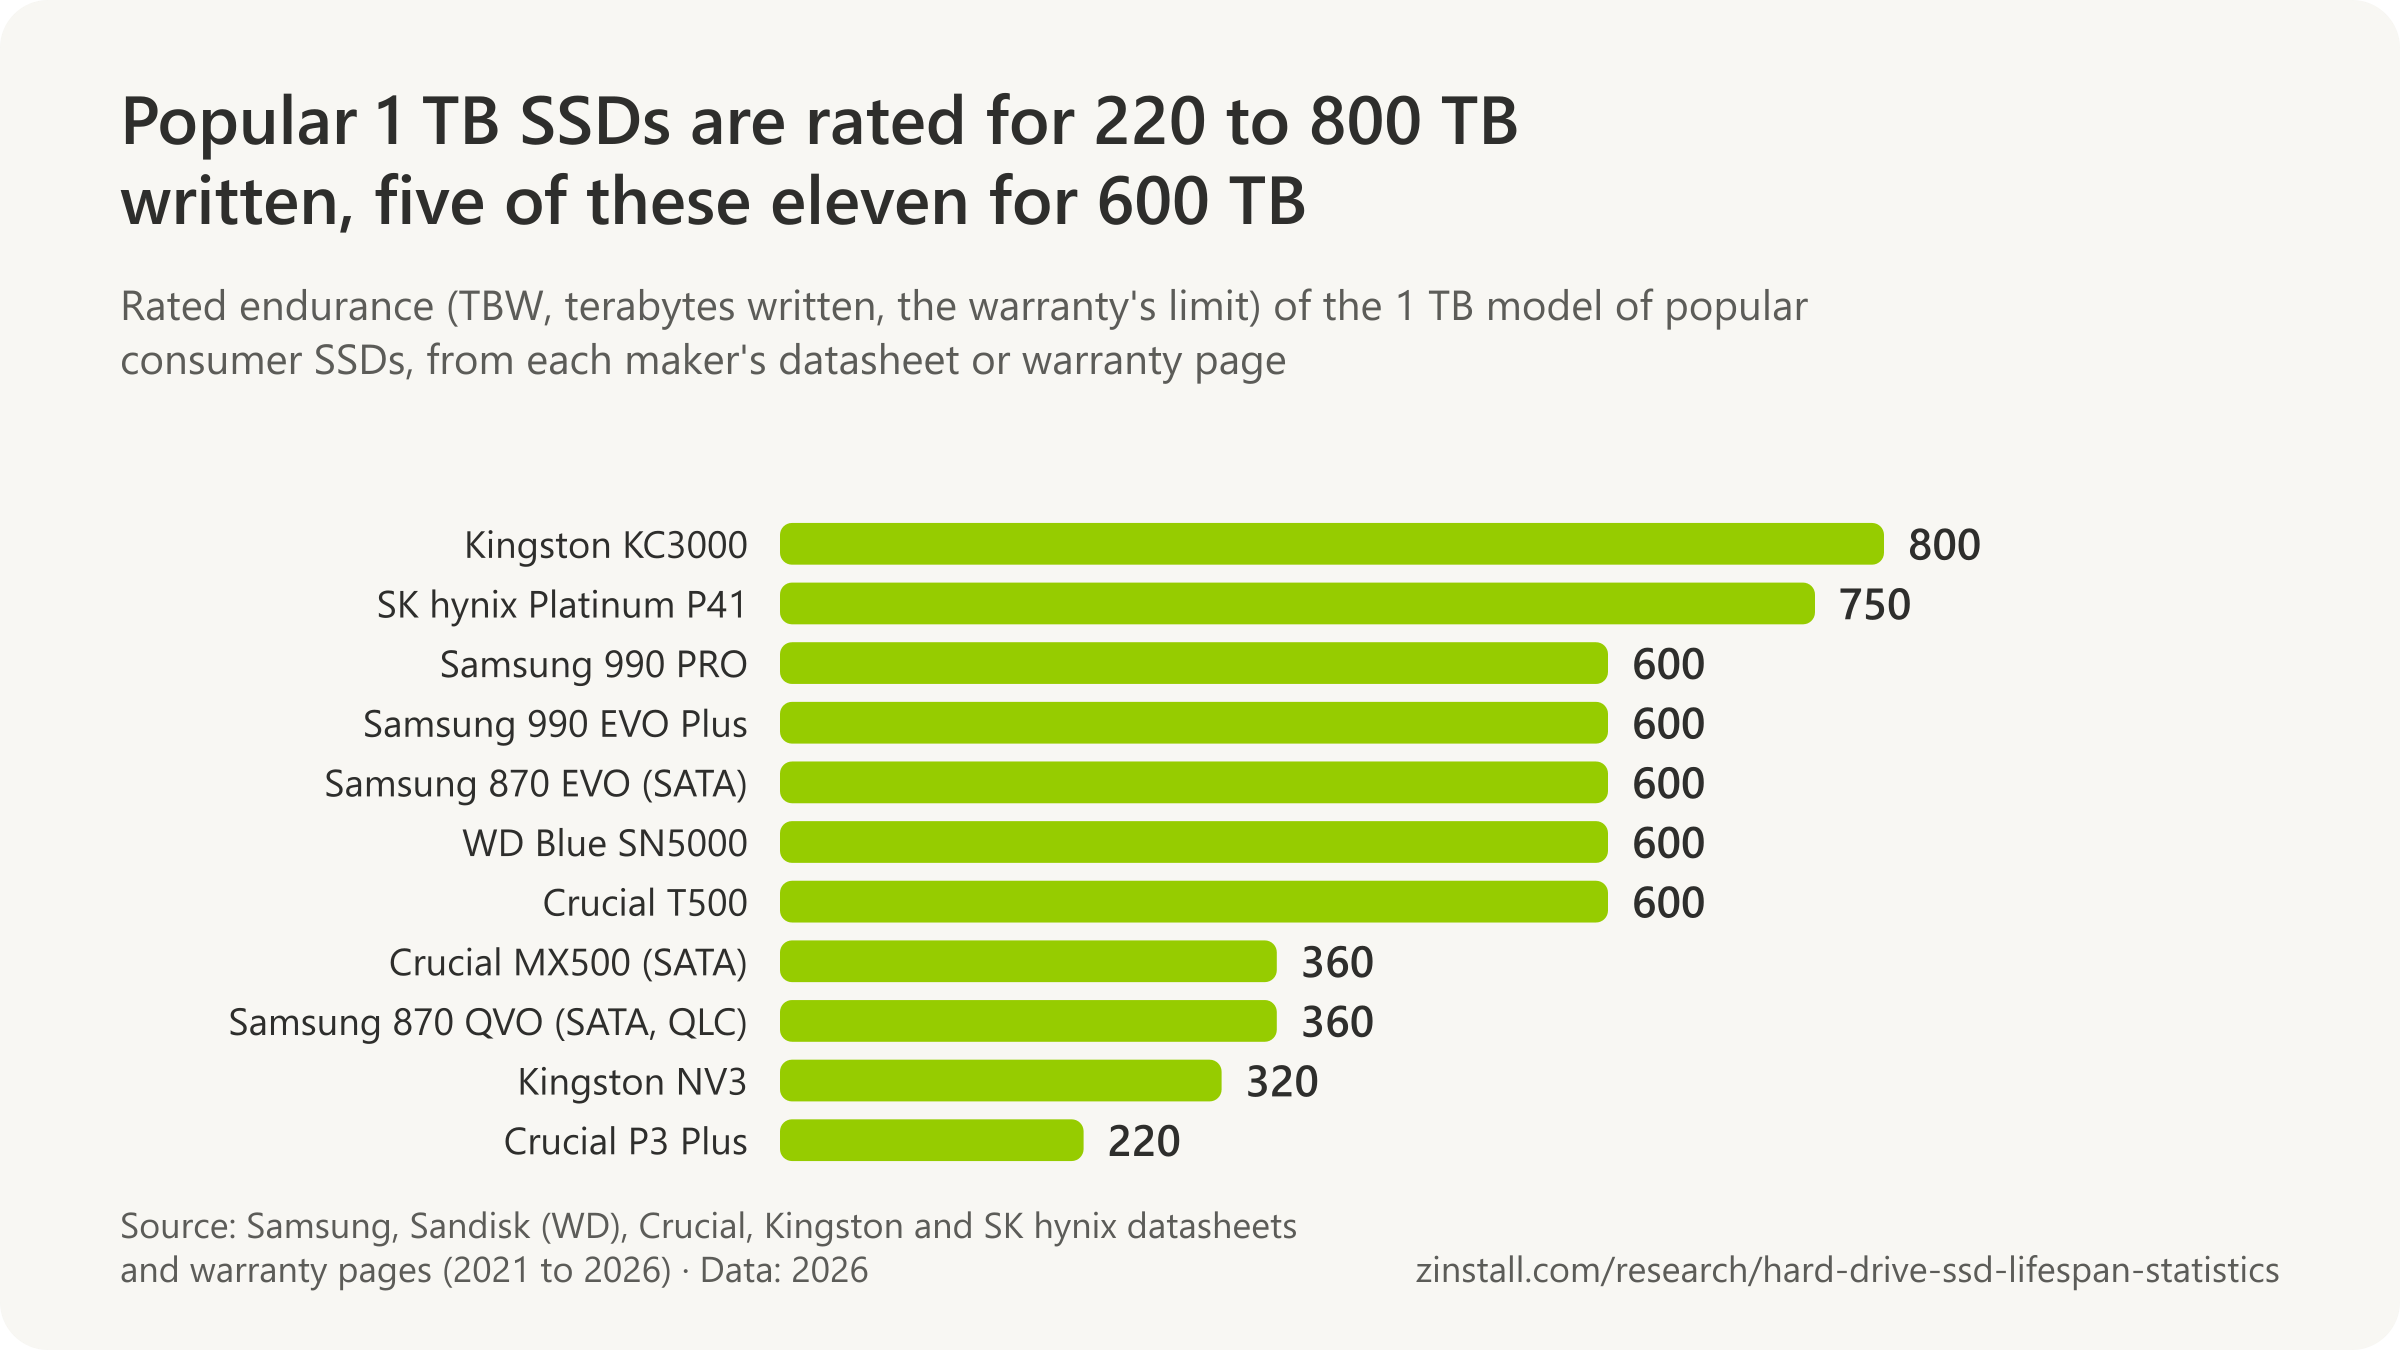
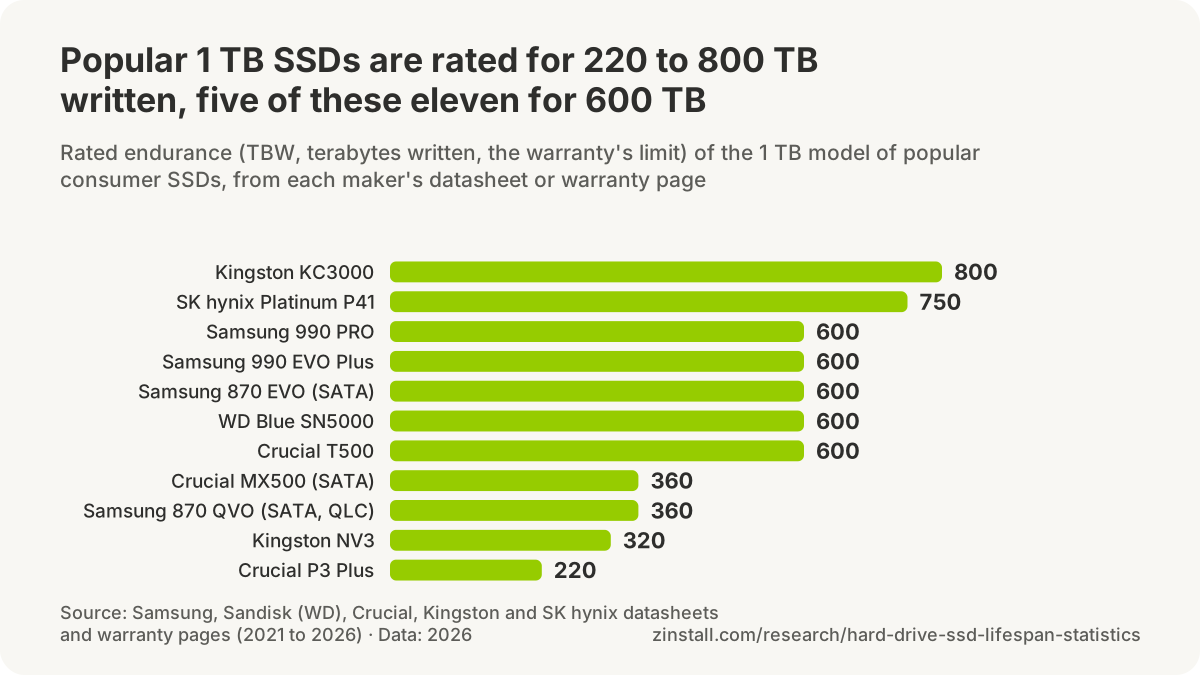

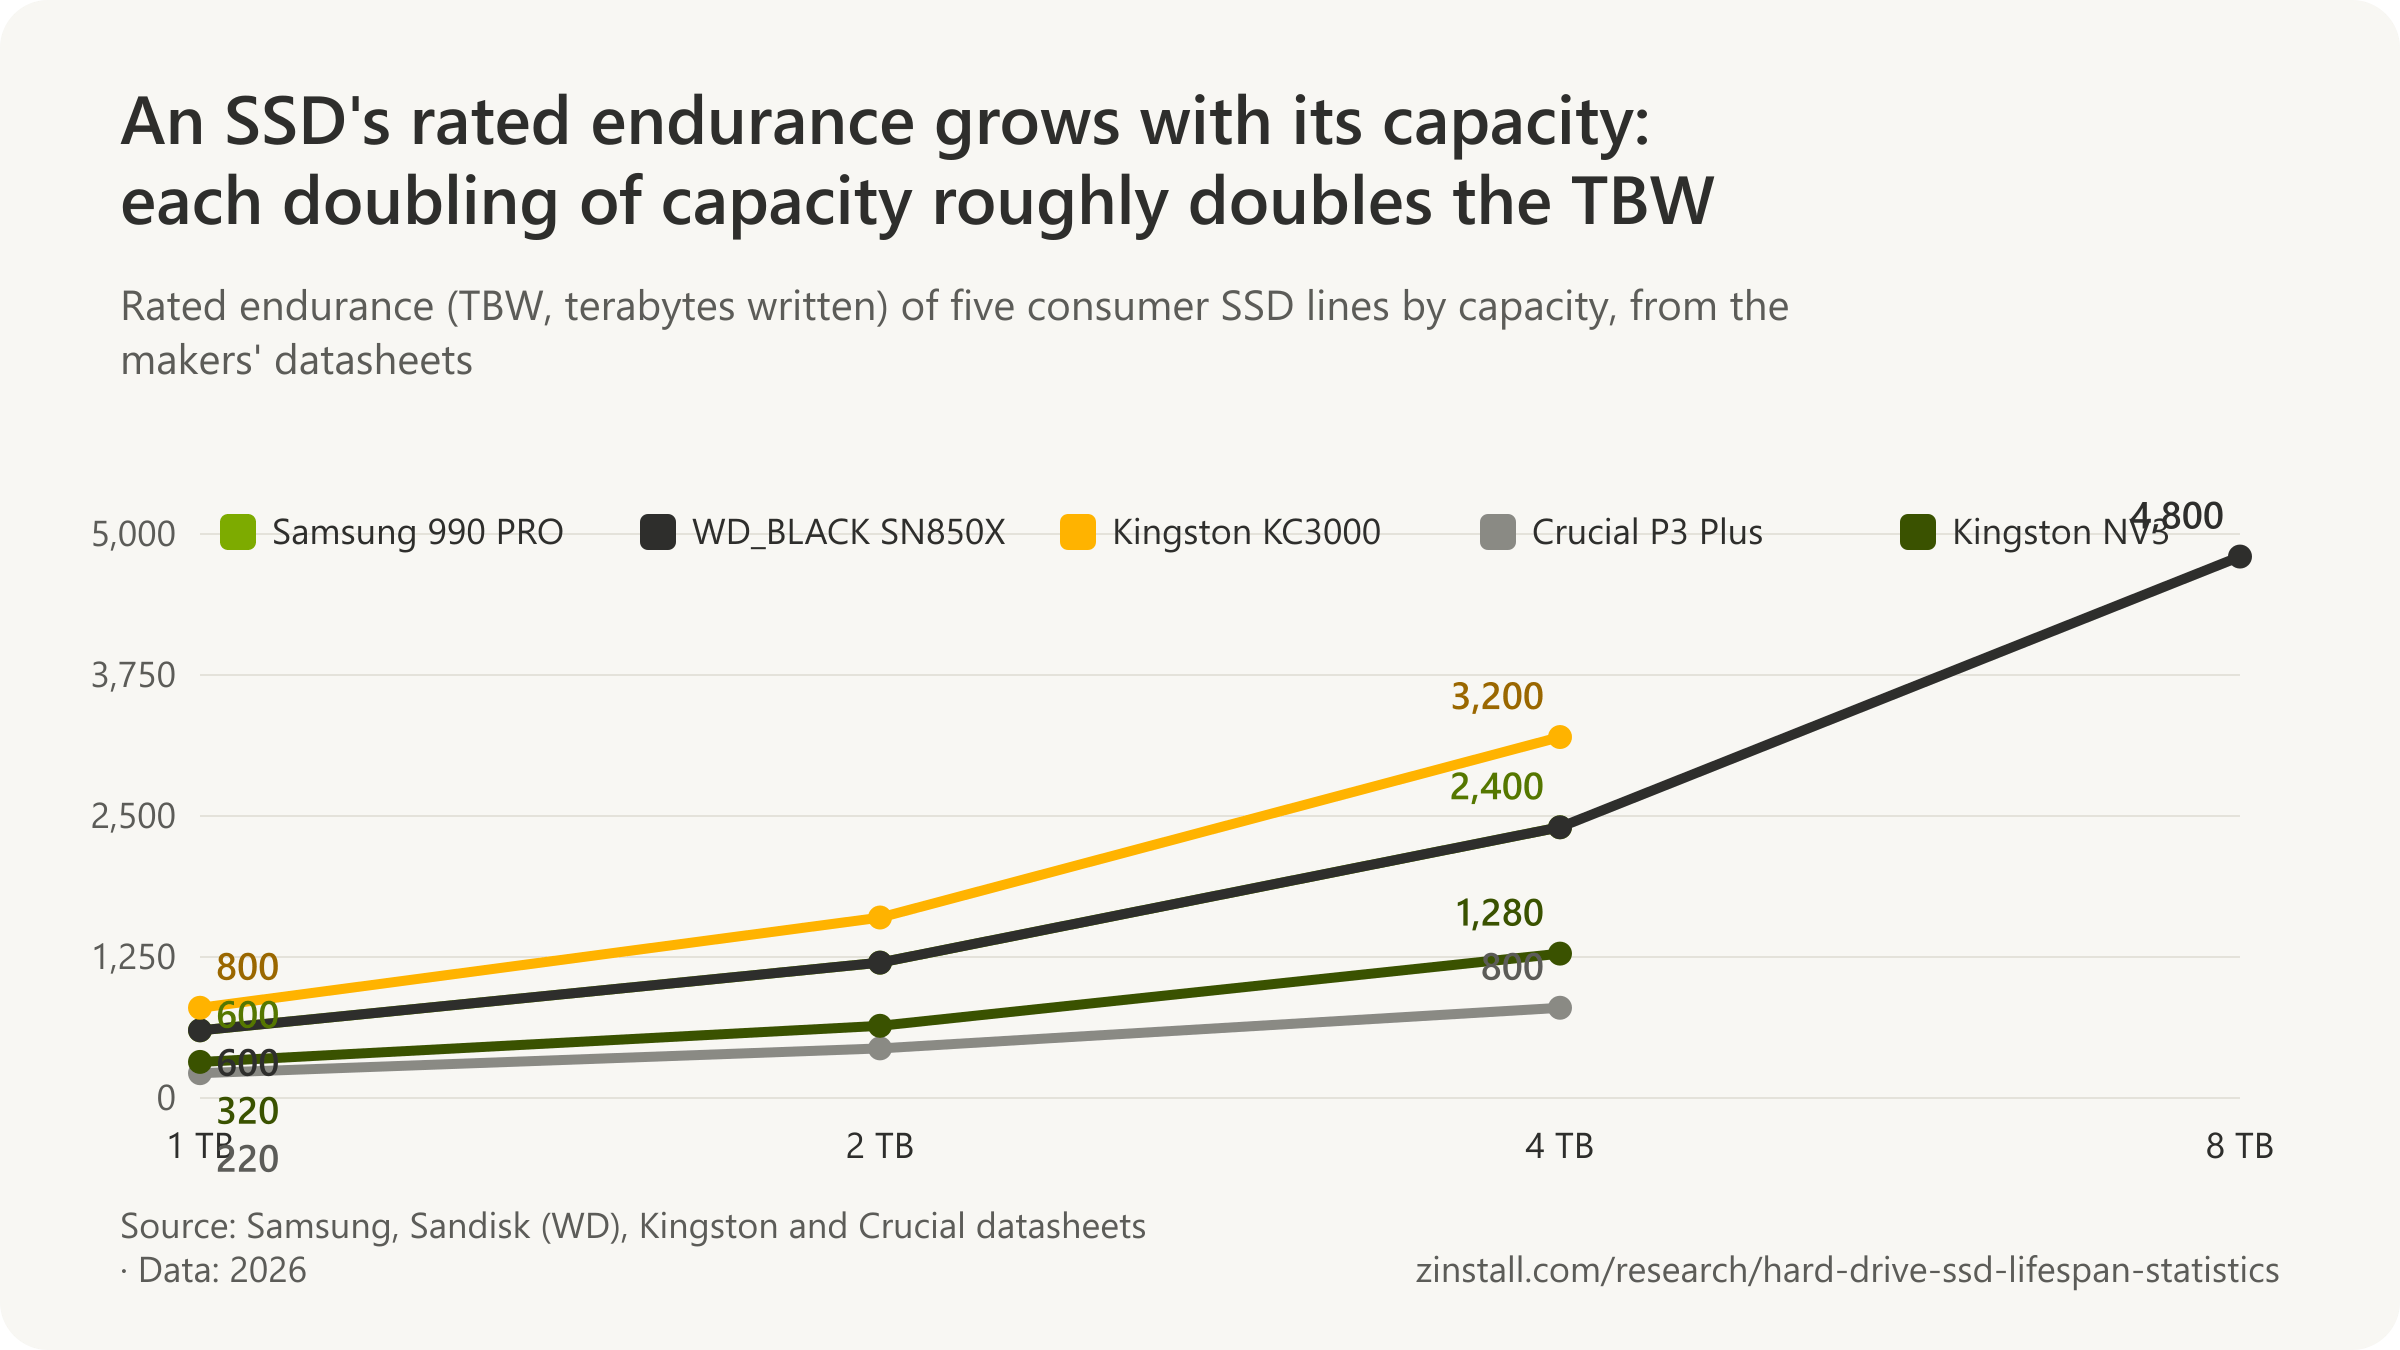
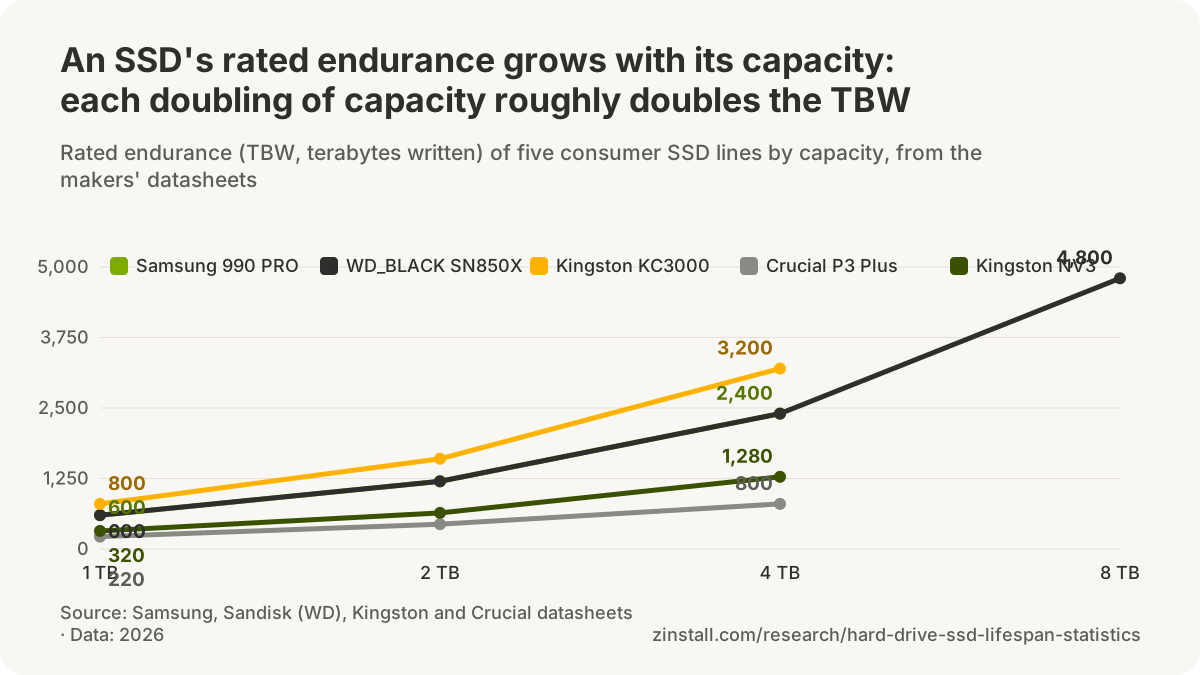
- Samsung's warranty covers the 990 EVO Plus 2 TB SSD for five years or 1,200 TBW (terabytes written), whichever comes first (Samsung, 2026).
- Samsung's warranty covers the 990 EVO Plus 4 TB SSD for five years or 2,400 TBW (terabytes written), whichever comes first (Samsung, 2026).
- Samsung's warranty covers the 9100 PRO 1 TB SSD for five years or 600 TBW (terabytes written), whichever comes first (Samsung, 2026).
- Samsung's warranty covers the 9100 PRO 2 TB SSD for five years or 1,200 TBW (terabytes written), whichever comes first (Samsung, 2026).
- Samsung's warranty covers the 9100 PRO 4 TB SSD for five years or 2,400 TBW (terabytes written), whichever comes first (Samsung, 2026).
- Samsung's warranty covers the 9100 PRO 8 TB SSD for five years or 4,800 TBW (terabytes written), whichever comes first (Samsung, 2026).
- Samsung's warranty covers the 870 EVO 2 TB SATA SSD for five years or 1,200 TBW (terabytes written), whichever comes first (Samsung, 2026).
- Samsung's warranty covers the 870 EVO 4 TB SATA SSD for five years or 2,400 TBW (terabytes written), whichever comes first (Samsung, 2026).
- Samsung's warranty covered its older 850 PRO SATA SSD for ten years, with a limit of 300 TBW for the 512 GB and 1 TB models, whichever came first (Samsung, 2026).
- Samsung's warranty covered its older 860 PRO 1 TB SATA SSD for five years or 1,200 TBW, twice the 600 TBW of today's 1 TB 990 PRO (Samsung, 2026).
- Sandisk (formerly Western Digital) rates the WD Blue SN5000 2 TB for 900 TBW of endurance (terabytes written) under a five-year limited warranty (Sandisk, 2026).
- Sandisk (formerly Western Digital) rates the WD Blue SN5000 4 TB for 1,200 TBW of endurance (terabytes written) under a five-year limited warranty (Sandisk, 2026).
- Crucial (Micron) rates the T500 2 TB SSD for 1,200 TBW (terabytes written), with a five-year limited warranty that ends at whichever limit comes first (Crucial, 2026).
- Kingston states that the NV3's TBW rating is derived from the JEDEC Client Workload (JESD219A), and that its five-year warranty also ends when the drive's Percentage Used indicator reaches 100 (Kingston, 2025).
- SK hynix rates the Platinum P41 2 TB SSD for up to 1,200 TBW (terabytes written), with a five-year warranty (SK hynix, 2026).
- A 600 TBW rating over a five-year warranty, the rating of a 1 TB Samsung 990 PRO, WD_BLACK SN850X or Crucial T500, allows about 329 GB of writes every day for five years (derived from Samsung's datasheet, 2022).
- A consumer 1 TB SSD rated 600 TBW over five years is rated for 0.33 drive writes per day, a third of a read-intensive data-centre SSD's 1 DWPD (derived from Samsung and Micron ratings, 2026).
- Samsung's warranty covers the 990 EVO 1 TB SSD for five years or 600 TBW (terabytes written), whichever comes first (Samsung, 2026).
- Crucial rates the MX500 2 TB SATA SSD for 700 TBW (terabytes written), which it equates to 383 GB a day for five years, under a five-year limited warranty (Crucial, 2021).
- Crucial rates the MX500 4 TB SATA SSD for 1,000 TBW (terabytes written), which it equates to 547 GB a day for five years, under a five-year limited warranty (Crucial, 2021).
- Rated endurance of a 1 TB consumer SSD ranges from 220 to 800 TBW by model, almost fourfold, from the Crucial P3 Plus to the Kingston KC3000, with most best sellers at 600 TBW (makers' datasheets, 2021 to 2026).
- JEDEC's JESD218 standard defines an SSD's endurance rating (TBW, terabytes written) as the most data a host may write while the drive still keeps its capacity, its error-rate and failure limits and its required power-off data retention (JEDEC, 2010).
- JEDEC published its two SSD standards, JESD218 (requirements and endurance test method) and JESD219 (endurance workloads), on 23 September 2010, creating the TBW endurance rating (JEDEC, 2010).
How much of its rating a drive uses
- Micron rates its 7450 MAX data-centre SSD (mixed-use) for 3 drive writes per day, 35,000 TBW for the 6.4 TB E1.S model, with a five-year warranty (Micron, 2026).
- Kingston puts SLC (one bit per cell) NAND flash at 100,000 program/erase cycles, the highest endurance of the flash types (Kingston, 2026).
- Kingston puts MLC (two bits per cell) NAND flash at 10,000 program/erase cycles (Kingston, 2026).
- Kingston puts TLC (three bits per cell) NAND flash, the standard in mainstream PCs, at typically 3,000 to 5,000 program/erase cycles (Kingston, 2026).
- Kingston says enterprise-grade TLC (eTLC) flash often reaches 10,000 to 30,000 program/erase cycles through better silicon and more over-provisioning (Kingston, 2026).
- Kingston puts QLC (four bits per cell) NAND flash, used in cheaper high-capacity SSDs, at around 1,000 program/erase cycles (Kingston, 2026).
- Lexar Enterprise puts SLC NAND flash at typically 50,000 to 100,000 program/erase cycles (Lexar Enterprise, 2026).
- Lexar Enterprise puts MLC NAND flash at typically 3,000 to 10,000 program/erase cycles (Lexar Enterprise, 2026).
- Lexar Enterprise puts TLC NAND flash at typically 1,000 to 3,000 program/erase cycles, with 3D NAND at the upper end (Lexar Enterprise, 2026).
- Lexar Enterprise puts QLC NAND flash at typically 150 to 1,000 program/erase cycles (Lexar Enterprise, 2026).
- Google's MLC data-centre flash drives had used on average 18% to 32% of their rated program-erase cycles (529 to 949 of 3,000), and its SLC and eMLC drives less than 7% (Schroeder et al., 2016; derived).
- Flash drives in Google's data centres showed no sudden jump in errors after passing the maker's rated program-erase cycle limit; errors grew roughly linearly with wear (Schroeder et al., 2016).
- In Google's accelerated life tests, flash drives' raw bit error rates rose sharply only at about three times the maker's rated program-erase cycle limit, suggesting the limits are set very conservatively (Schroeder et al., 2016).
- Time in the field raised the raw bit error rate of Google's data-centre flash drives independently of wear from writing, so an SSD ages with time as well as with use (Schroeder et al., 2016).
- Failure rates of one platform of Facebook's server SSDs differed by up to 81.7% between the early-life period and the wear-out period (Meza et al., 2015).
- Enterprise SSDs that had been in NetApp's storage systems for two to three years had used less than 2% of their rated program-erase cycles on average (Maneas et al., 2020).
- Enterprise MLC SSDs in NetApp's storage systems that had used less than 1% of their rated life were 1.25 times as likely to be replaced as those that had used more (Maneas et al., 2020).
- 99% of NetApp's enterprise storage systems had used at most 15% of their SSDs' rated write endurance, so the authors saw no wear-out risk for most users in moving to lower-endurance QLC flash (Maneas et al., 2020).
- 60% of the SSDs in NetApp's enterprise storage systems used less than 1% of their rated program-erase cycles a year, a pace at which they would last more than 100 years before wearing out (Maneas et al., 2022).
- About 95% of the SSDs in NetApp's enterprise storage systems could have been QLC drives rated for only 1,000 program-erase cycles without wearing out within a typical five-year life (Maneas et al., 2022).
- The median SSD in NetApp's enterprise storage systems was written 0.36 times its capacity per day (0.36 drive writes per day), well below the 1 to 3 that typical enterprise drives are rated for (Maneas et al., 2022).
- More than 7% of the SSDs in NetApp's enterprise storage systems were written more than 3 times their capacity a day, above what many drives are rated for, and 2% more than 10 times (Maneas et al., 2022).
- Some enterprise SSD families in NetApp's systems wrote about 100 times as much to their flash as the host sent (median write amplification around 100), mostly by rewriting stored data in the background before it could fade (Maneas et al., 2022).
- In 5% of the SSDs in NetApp's enterprise storage systems, the most-erased block had been erased more than six times as often as the average block, so wear levelling was far from perfect (Maneas et al., 2022).
- Alibaba's data-centre SATA SSDs had used on average 2% to 27% of their rated erase cycles after 1.4 to 5.5 years powered on, depending on the model (Han et al., 2021).
- Alibaba's NVMe SSDs whose flash took fewer writes than the host sent (write amplification of 1 or less, from compression) were replaced about 2.2 times as often as other drives (Lu et al., 2022).
- Almost 98% of the SSD failures in a Google data centre came before the drives had used 1,500 of their rated 3,000 program-erase cycles, and drives run past their rated limit rarely failed (Alter et al., 2019).
How much people write a day
- Micron rates its 7450 PRO data-centre SSD (read-intensive) for 1 drive write per day, and its datasheet rates the 3.84 TB E1.S model for 7,300 TBW, against 600 to 1,200 TBW for 1 to 2 TB consumer drives (Micron, 2026).
- Intel specified its SSD 320 (2011) for a minimum of five years of useful life under typical client workloads with up to 20 GB of host writes per day (Intel, 2011).
- Intel's 2011 client assumption of 20 GB of host writes a day for five years adds up to 36.5 TB written, about 6% of a 1 TB consumer SSD's 600 TBW rating in 2026 (derived from Intel, 2011).
- Sandisk tells buyers that the average home user writes 20 to 40 GB of data a day, without citing a measurement (Sandisk, 2026).
Flash types and write cycles

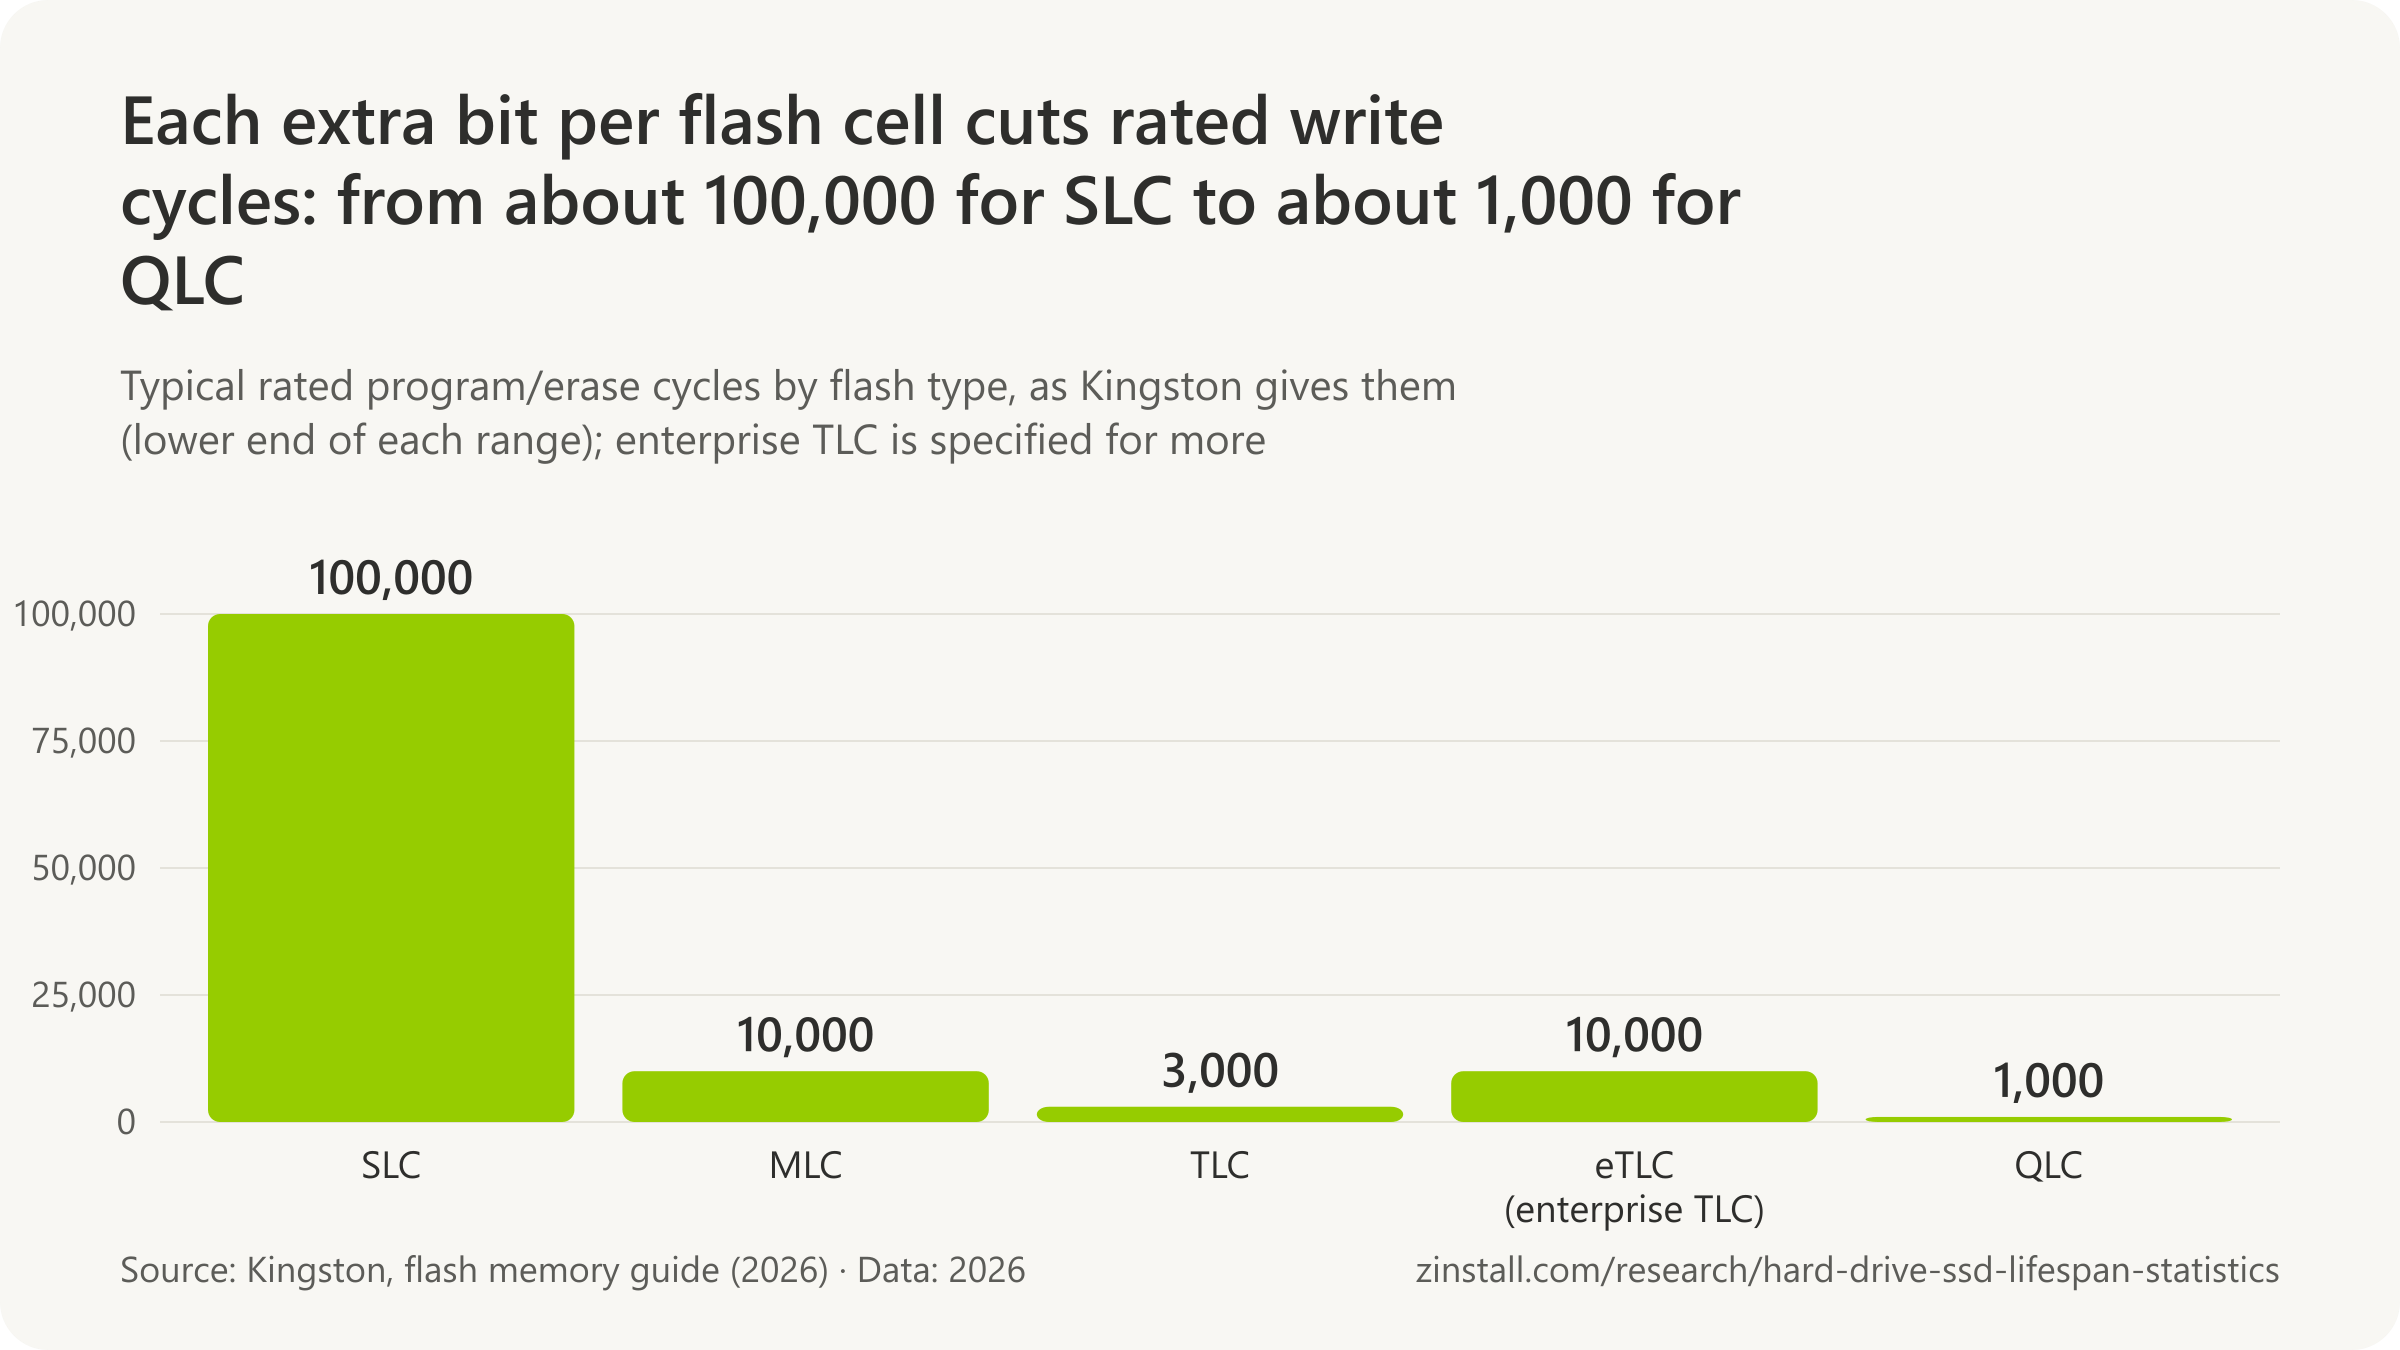
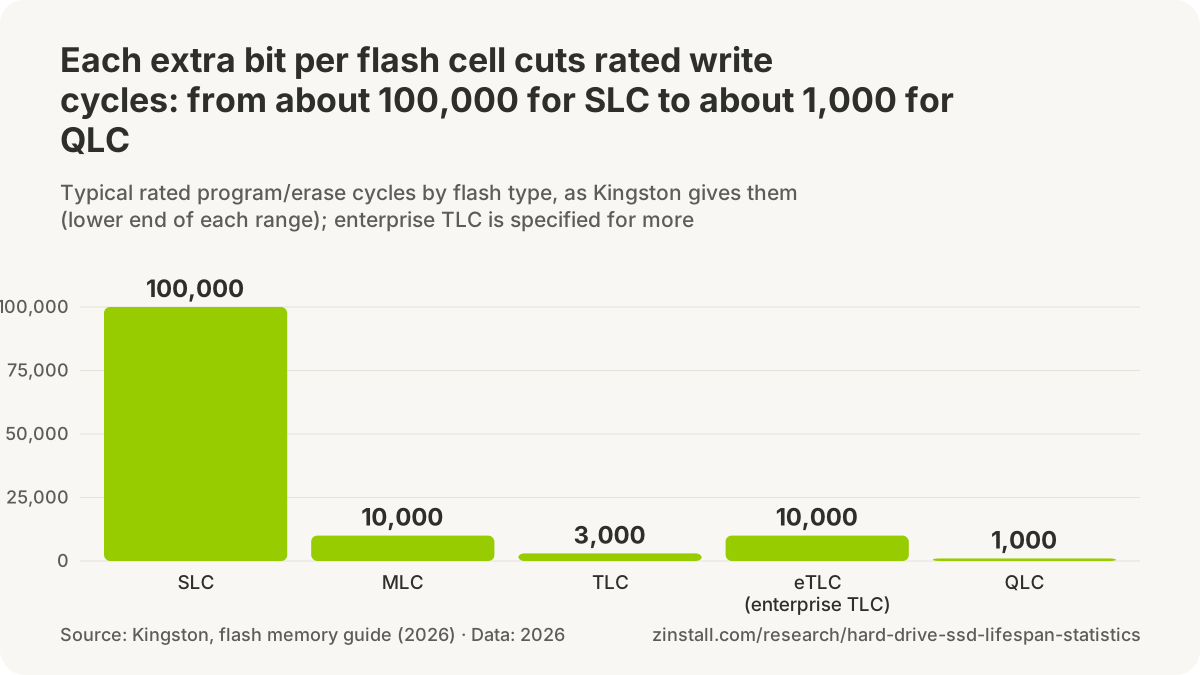

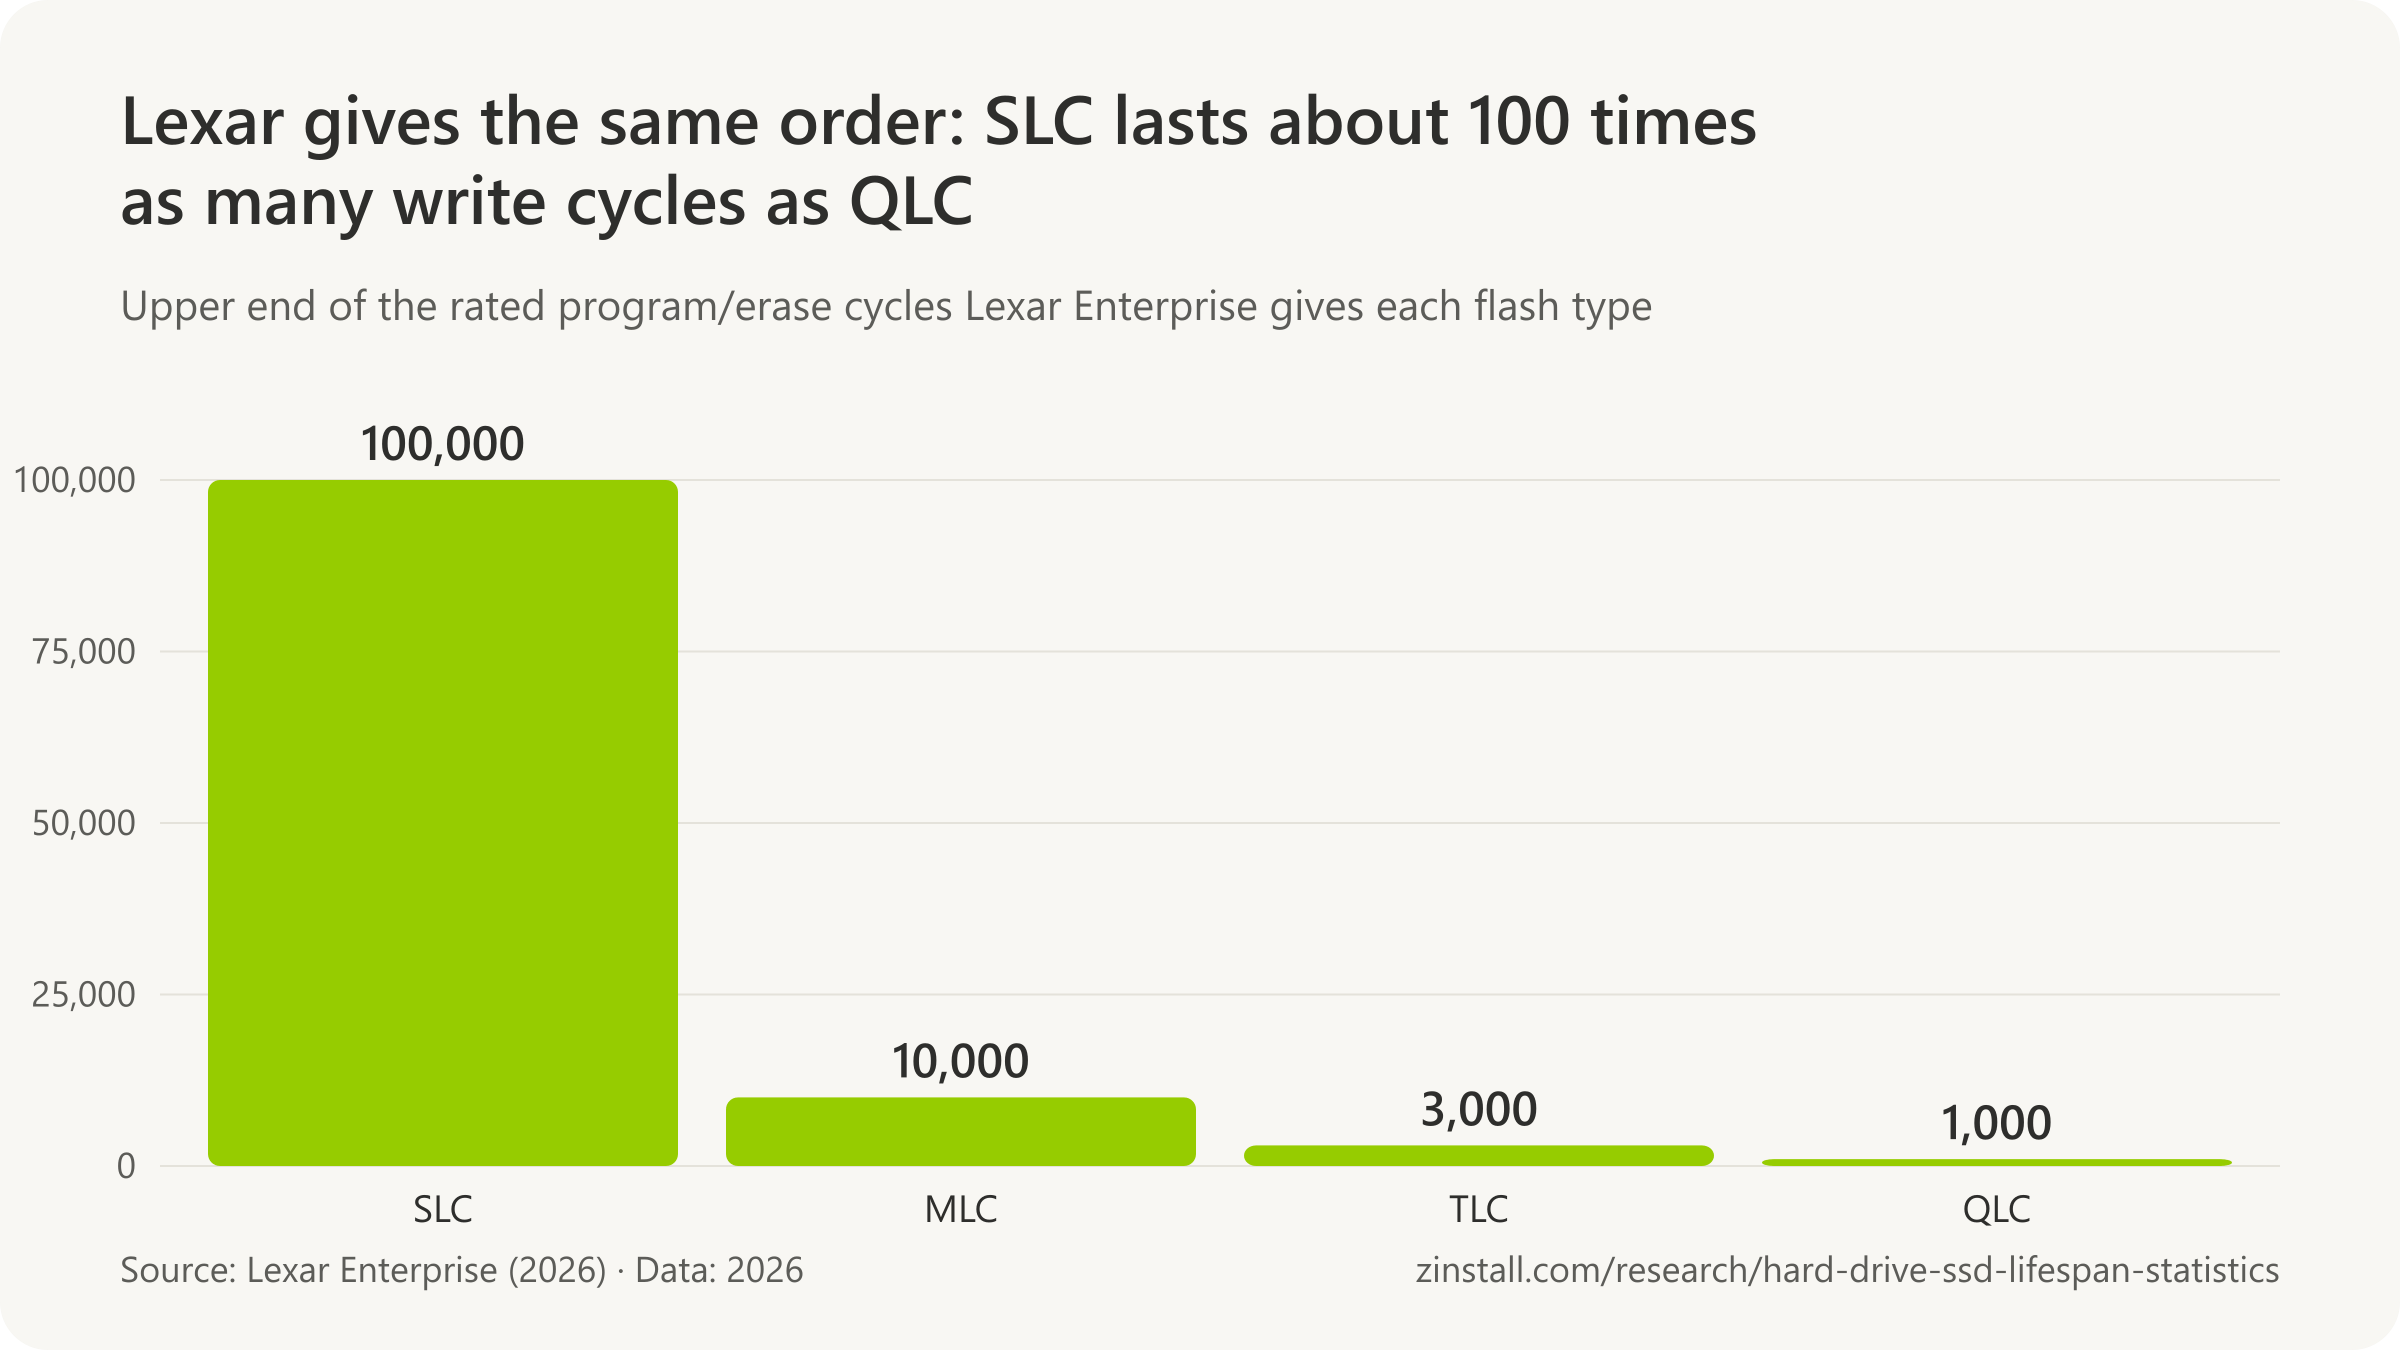
- Samsung gives its SATA 870 EVO and its NVMe 990 PRO the same ratings: 600 TBW per terabyte, five years and 1.5 million hours MTBF, so the maker's ratings do not favour NVMe over SATA (derived from Samsung datasheets, 2021 and 2022).
The JEDEC standards behind the ratings
- JEDEC's JESD218 client class assumes an SSD in use 8 hours a day at 40 °C (JEDEC, 2010).
- JEDEC's JESD218 enterprise class assumes an SSD in use 24 hours a day at 55 °C (JEDEC, 2010).
- JEDEC's JESD218 allows at most 3% of client or enterprise SSDs to fail functionally by the time they reach their rated endurance (functional failure requirement) (JEDEC, 2010).
- JEDEC's current revision of the SSD endurance standard is JESD218C.01, published in August 2026 (JEDEC, 2026).
- JEDEC's JESD219 rates client SSD endurance by replaying a trace of commands recorded on a user's PC, while the enterprise workload is a synthetic mix heavy in 4 KB and 8 KB random writes, as Western Digital describes it (Western Digital, 2023).
- JEDEC's JESD219 enterprise endurance workload is all random, 4 KB aligned, with 67% of transfers at 4 KB and half of all accesses aimed at the first 5% of the drive (JEDEC, 2010).
Sources: The Tech Report; heise online / c't magazin (2017, 2021); Samsung Electronics (2022, 2026); Sandisk (2026); Crucial (2021, 2026); Kingston Technology (2024, 2025, 2026); SK hynix; Crucial, Kingston, Samsung, Sandisk, SK hynix; JEDEC Solid State Technology Association (2010, 2026); Micron Technology; Lexar Enterprise; USENIX, Proceedings of the 14th USENIX Conference on File and Storage Technologies; ACM, Proceedings of the 2015 ACM SIGMETRICS International Conference on Measurement and Modeling of Computer Systems; USENIX, Proceedings of the 18th USENIX Conference on File and Storage Technologies; USENIX, Proceedings of the 20th USENIX Conference on File and Storage Technologies; USENIX, Proceedings of the 19th USENIX Conference on File and Storage Technologies; USENIX, Proceedings of the 2022 USENIX Annual Technical Conference; ACM / IEEE, Proceedings of the International Conference; Intel Corporation; Western Digital
What do MTBF, AFR and warranty ratings mean?
Drives typically achieve 50% to 60% of their projected MTBF in the field, counting all returns (Seagate, 2026).

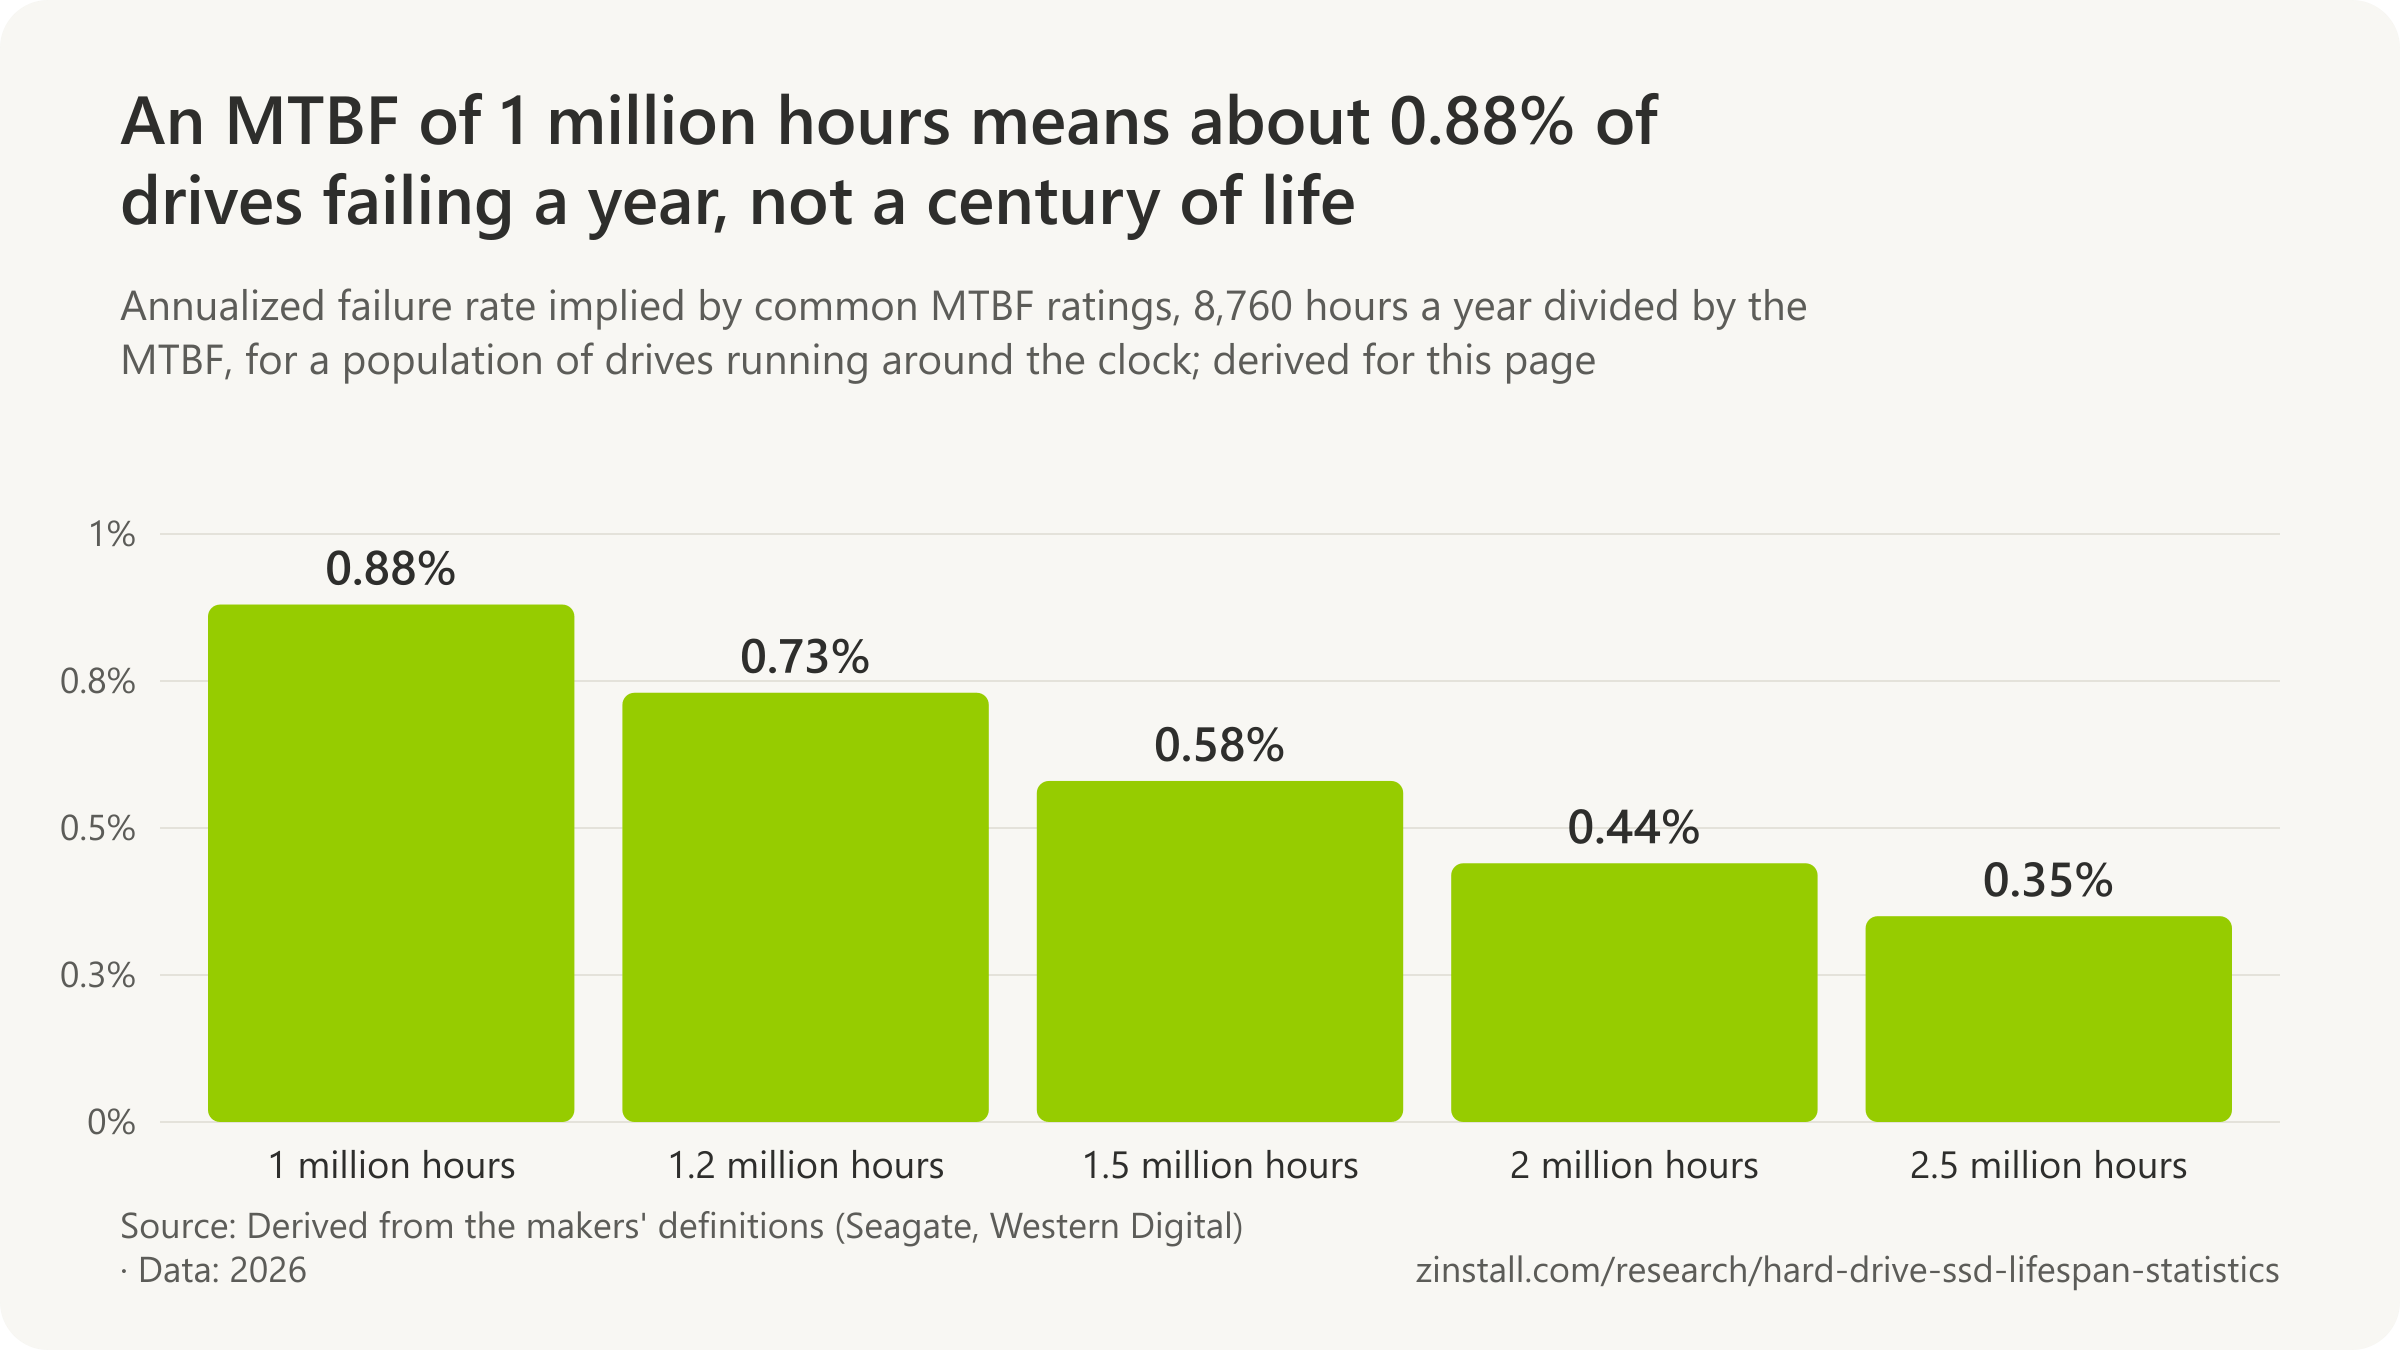
- An MTBF of 1.5 million hours means about 0.58% of drives failing a year, not a 171-year life.
- Desktop drive specifications assume 2,400 power-on hours a year; enterprise ratings assume 8,760.
- Field replacement rates ran up to 15 times the datasheet failure rate across about 100,000 drives.
- Desktop and laptop drives are rated for 55 TB of reads and writes a year, enterprise drives for up to 550.
- MTBF ratings of 300,000 to 1,200,000 hours do not promise 30 to 120 years of operation.
| Drive line and rating | Rating |
|---|---|
| Seagate BarraCuda (desktop): warranty | 2 years |
| Seagate IronWolf Pro (NAS): warranty | 5 years |
| Seagate IronWolf Pro: MTBF, 2025 | 2.5 million hours MTBF |
| Seagate IronWolf Pro: MTBF, 2020 | 1.2 million hours MTBF (0.73% AFR) |
| WD Gold (air-filled): MTBF | 2 million hours MTBF (0.44% AFR) |
| Toshiba MG11 (enterprise): MTTF | 2.5 million hours MTTF (0.35% AFR) |
| Seagate BarraCuda: unrecoverable read errors | 1 per 10^14 bits |
| Seagate IronWolf Pro: unrecoverable read errors | 1 per 10^15 bits |
| Seagate: temperatures that reduce reliability | Above 50°C or below 5°C |
| Crucial MX500: MTTF labelled 'Life Expectancy' | 1.8 million hours MTTF |
Sources: Seagate Technology (2015-2026); Carnegie Mellon University; Western Digital (2026, 2025, 2022); Toshiba Electronic Devices & Storage Corporation; Crucial; Samsung Electronics
Related guides: Back up your entire computer · Back up to an external hard drive
More statistics (48)
MTBF, mean time between failures, is a population rating: it says what share of a large group of drives running around the clock should fail in a year, not how long one drive will last. The makers' own pages say so, and field studies found real failure rates well above the rated ones. Desktop drives often carry no MTBF at all, assume part-time use and come with two-year warranties; NAS and enterprise drives are rated for more hours, more data and longer warranties.
What MTBF and AFR mean
- 0.58% to 0.88% a year is the failure rate implied by datasheet MTTFs of 1,000,000 to 1,500,000 hours, the ratings of the drives Carnegie Mellon studied (Carnegie Mellon University, 2007).
- Annual replacement rates observed in the field were up to 15 times the datasheet failure rate, by data set and drive type, across about 100,000 hard drives (Carnegie Mellon University, 2007).
- Field replacement rates of hard drives less than five years old were 2 to 10 times the rate their datasheet MTTF suggested, across about 100,000 drives (Carnegie Mellon University, 2007).
- Field replacement rates of hard drives five to eight years old were 30 times the rate their datasheet MTTF suggested (Carnegie Mellon University, 2007).
- A 1 million-hour MTBF does not mean a hard drive will run for a century: Seagate says the figure leaves out early and wear-out failures and is 'based more on extrapolation than observation' (Seagate, 2015).
- Samsung rates the 990 PRO SSD at 1.5 million hours MTBF (mean time between failures, a population rating, not a lifespan) (Samsung, 2022).
- Samsung rates the 870 EVO SATA SSD at 1.5 million hours MTBF (mean time between failures, a population rating, not a lifespan) (Samsung, 2021).
- Kingston rates the NV3 SSD at 2,000,000 hours MTBF (mean time between failures, a population rating, not a lifespan) (Kingston, 2025).
- SK hynix rates the Platinum P41 SSD at 1.5 million hours MTBF and a bit error rate of 1 error in 10^15 bits transferred (SK hynix, 2026).
- Crucial labels the MX500's 1.8 million hours MTTF rating as its 'Life Expectancy', although MTTF is a population failure-rate rating, not the life of one drive (Crucial, 2021).
- Seagate rates its IronWolf NAS hard drives at 1 million hours MTBF (mean time between failures, a population rating, not a lifespan), assuming 8,760 power-on hours a year (Seagate, 2022).
- Seagate rates its IronWolf Pro NAS hard drives at 2.5 million hours MTBF (mean time between failures, a population rating, not a lifespan), assuming 8,760 power-on hours a year (Seagate, 2025).
- Seagate rated its 2 TB to 16 TB IronWolf Pro NAS hard drives at 1.2 million hours MTBF, equal to a 0.73% annualized failure rate specification, with a 300 TB a year workload limit (Seagate, 2020).
- Seagate rates its Exos X24 enterprise hard drives at 2.5 million hours MTBF, equal to a 0.35% annualized failure rate specification at full 24x7 operation (8,760 power-on hours a year) (Seagate, 2023).
- Seagate rates its SkyHawk surveillance hard drives at 1 million hours MTBF (mean time between failures, a population rating, not a lifespan), assuming 8,760 power-on hours a year (Seagate, 2021).
- Seagate rates its SkyHawk AI surveillance hard drives at 2.5 million hours MTBF (mean time between failures, a population rating, not a lifespan), assuming 8,760 power-on hours a year (Seagate, 2025).
- WD rates its WD Red Plus NAS hard drives at 1 million hours MTBF (mean time between failures, a population rating, not a lifespan) (Western Digital, 2025).
- WD estimates the WD Red Plus MTBF rating under a workload of 90 TB a year at a 40°C drive temperature, derates it above those conditions, and states that MTBF does not predict an individual drive's reliability (Western Digital, 2025).
- WD rates its WD Red Pro NAS hard drives at up to 2.5 million hours MTBF (helium models of 14 TB and up; 2 million hours for the air-filled models), a population rating, not a lifespan (Western Digital, 2025).
- WD rates its helium WD Gold enterprise hard drives at 2.5 million hours MTBF, equal to a 0.35% annualized failure rate specification (Western Digital, 2025).
- WD rates its air-filled WD Gold enterprise hard drives (1 TB to 12 TB) at 2 million hours MTBF and a 0.44% annualized failure rate specification, against 2.5 million hours and 0.35% for its helium models (Western Digital, 2025).
- WD rates its Ultrastar DC HC690 data-centre hard drives (30 TB and 32 TB, SMR) at a projected 2.5 million hours MTBF, equal to a 0.35% annualized failure rate specification, for 24x7 availability (Western Digital, 2024).
- Toshiba rates its N300 NAS hard drives of 14 TB and up at 1.2 million hours MTTF (mean time to failure, a population rating, not a lifespan), and the 6 TB to 12 TB models at 1 million hours (Toshiba, 2026).
- Toshiba rates its MG11 enterprise hard drives at 2.5 million hours MTTF/MTBF, equal to a 0.35% annualized failure rate specification, assuming 8,760 power-on hours a year at 40°C and 550 TB a year (Toshiba, 2024).
- Seagate says that, historically, the MTBF its drives achieve in the field, counting all returns whatever the cause, is typically 50% to 60% of the projected MTBF (Seagate, accessed 2026).
- Seagate's AFR and MTBF specifications for business-critical storage assume 8,760 power-on hours a year, that is 24 hours a day all year, and 250 motor start/stop cycles a year (Seagate, accessed 2026).
- Seagate says MTBF ratings of 300,000 to 1,200,000 hours do not promise 30 to 120 years of continuous operation: the rating describes the relative reliability of a family of drives, and is not a warranty (Seagate, accessed 2026).
- Western Digital says its MTBF and AFR ratings are estimated from a sample population with statistical measurements and acceleration algorithms at a 40°C drive temperature, and do not predict an individual drive's reliability or constitute a warranty (Western Digital, 2022).
- Crucial's glossary defines MTBF as the time between one data failure and the next on a computer storage drive, wording that reads as a per-drive interval rather than the population rating it is (Crucial, accessed 2026).
- An MTBF of 1.5 million hours does not mean a drive lasts 171 years (1,500,000 / 8,760): it means about 0.58% of a large population of such drives would be expected to fail per year of round-the-clock use within the rated service life (derived from Seagate, accessed 2026).
Ratings by drive line

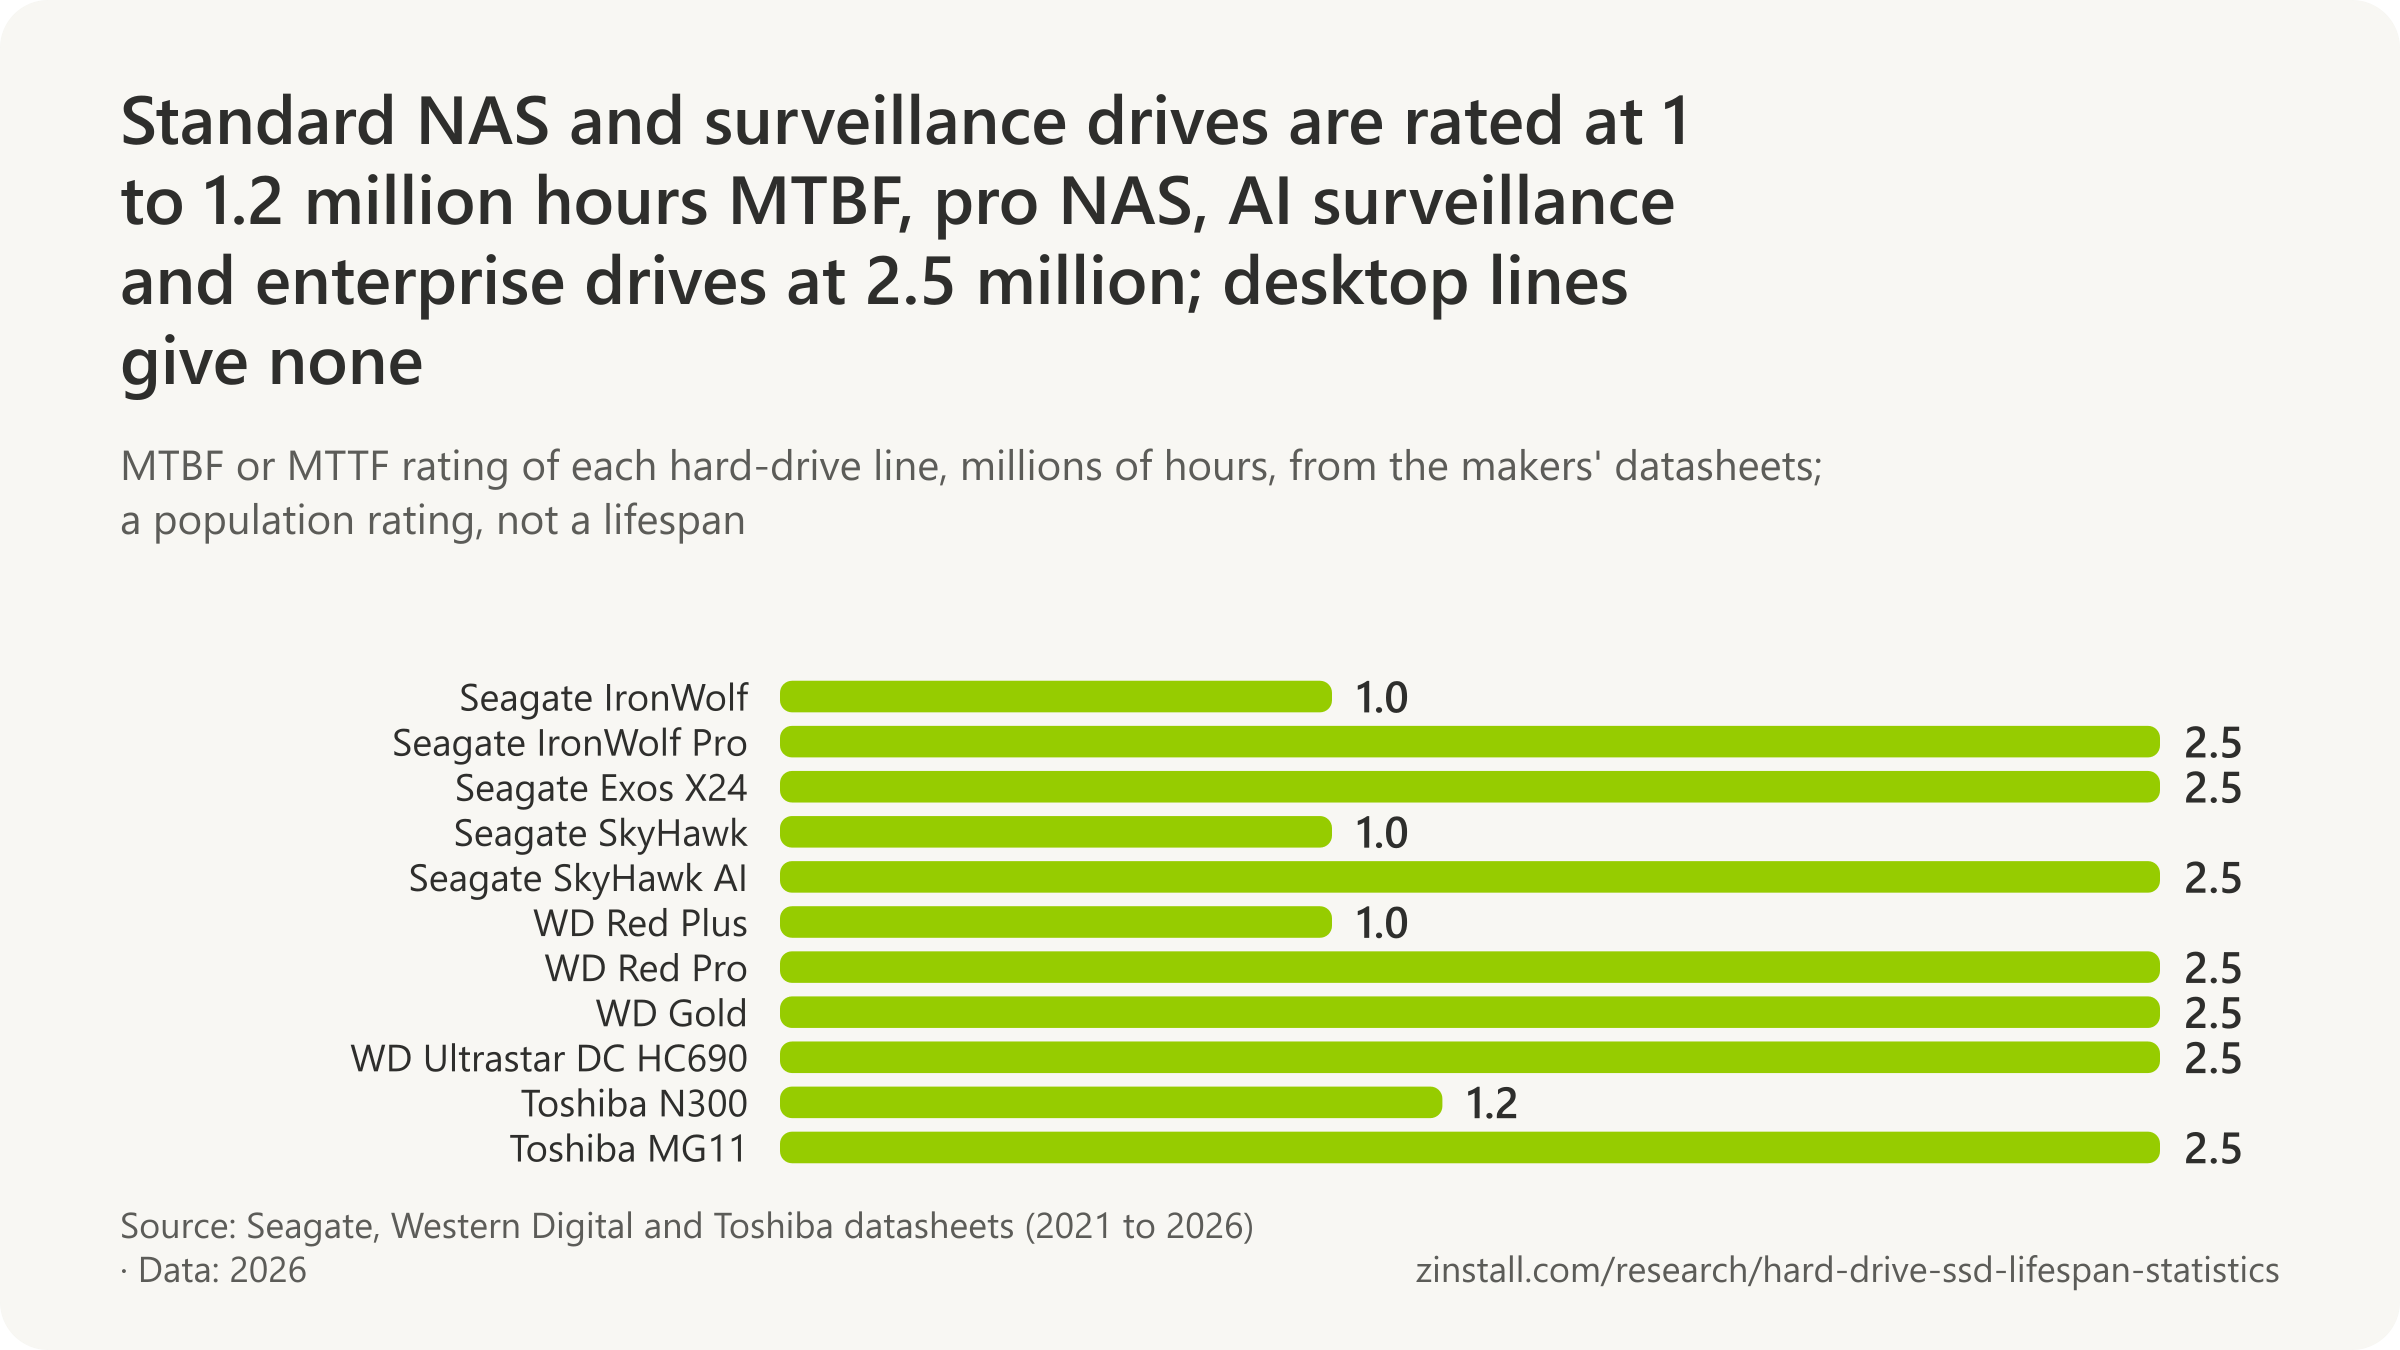

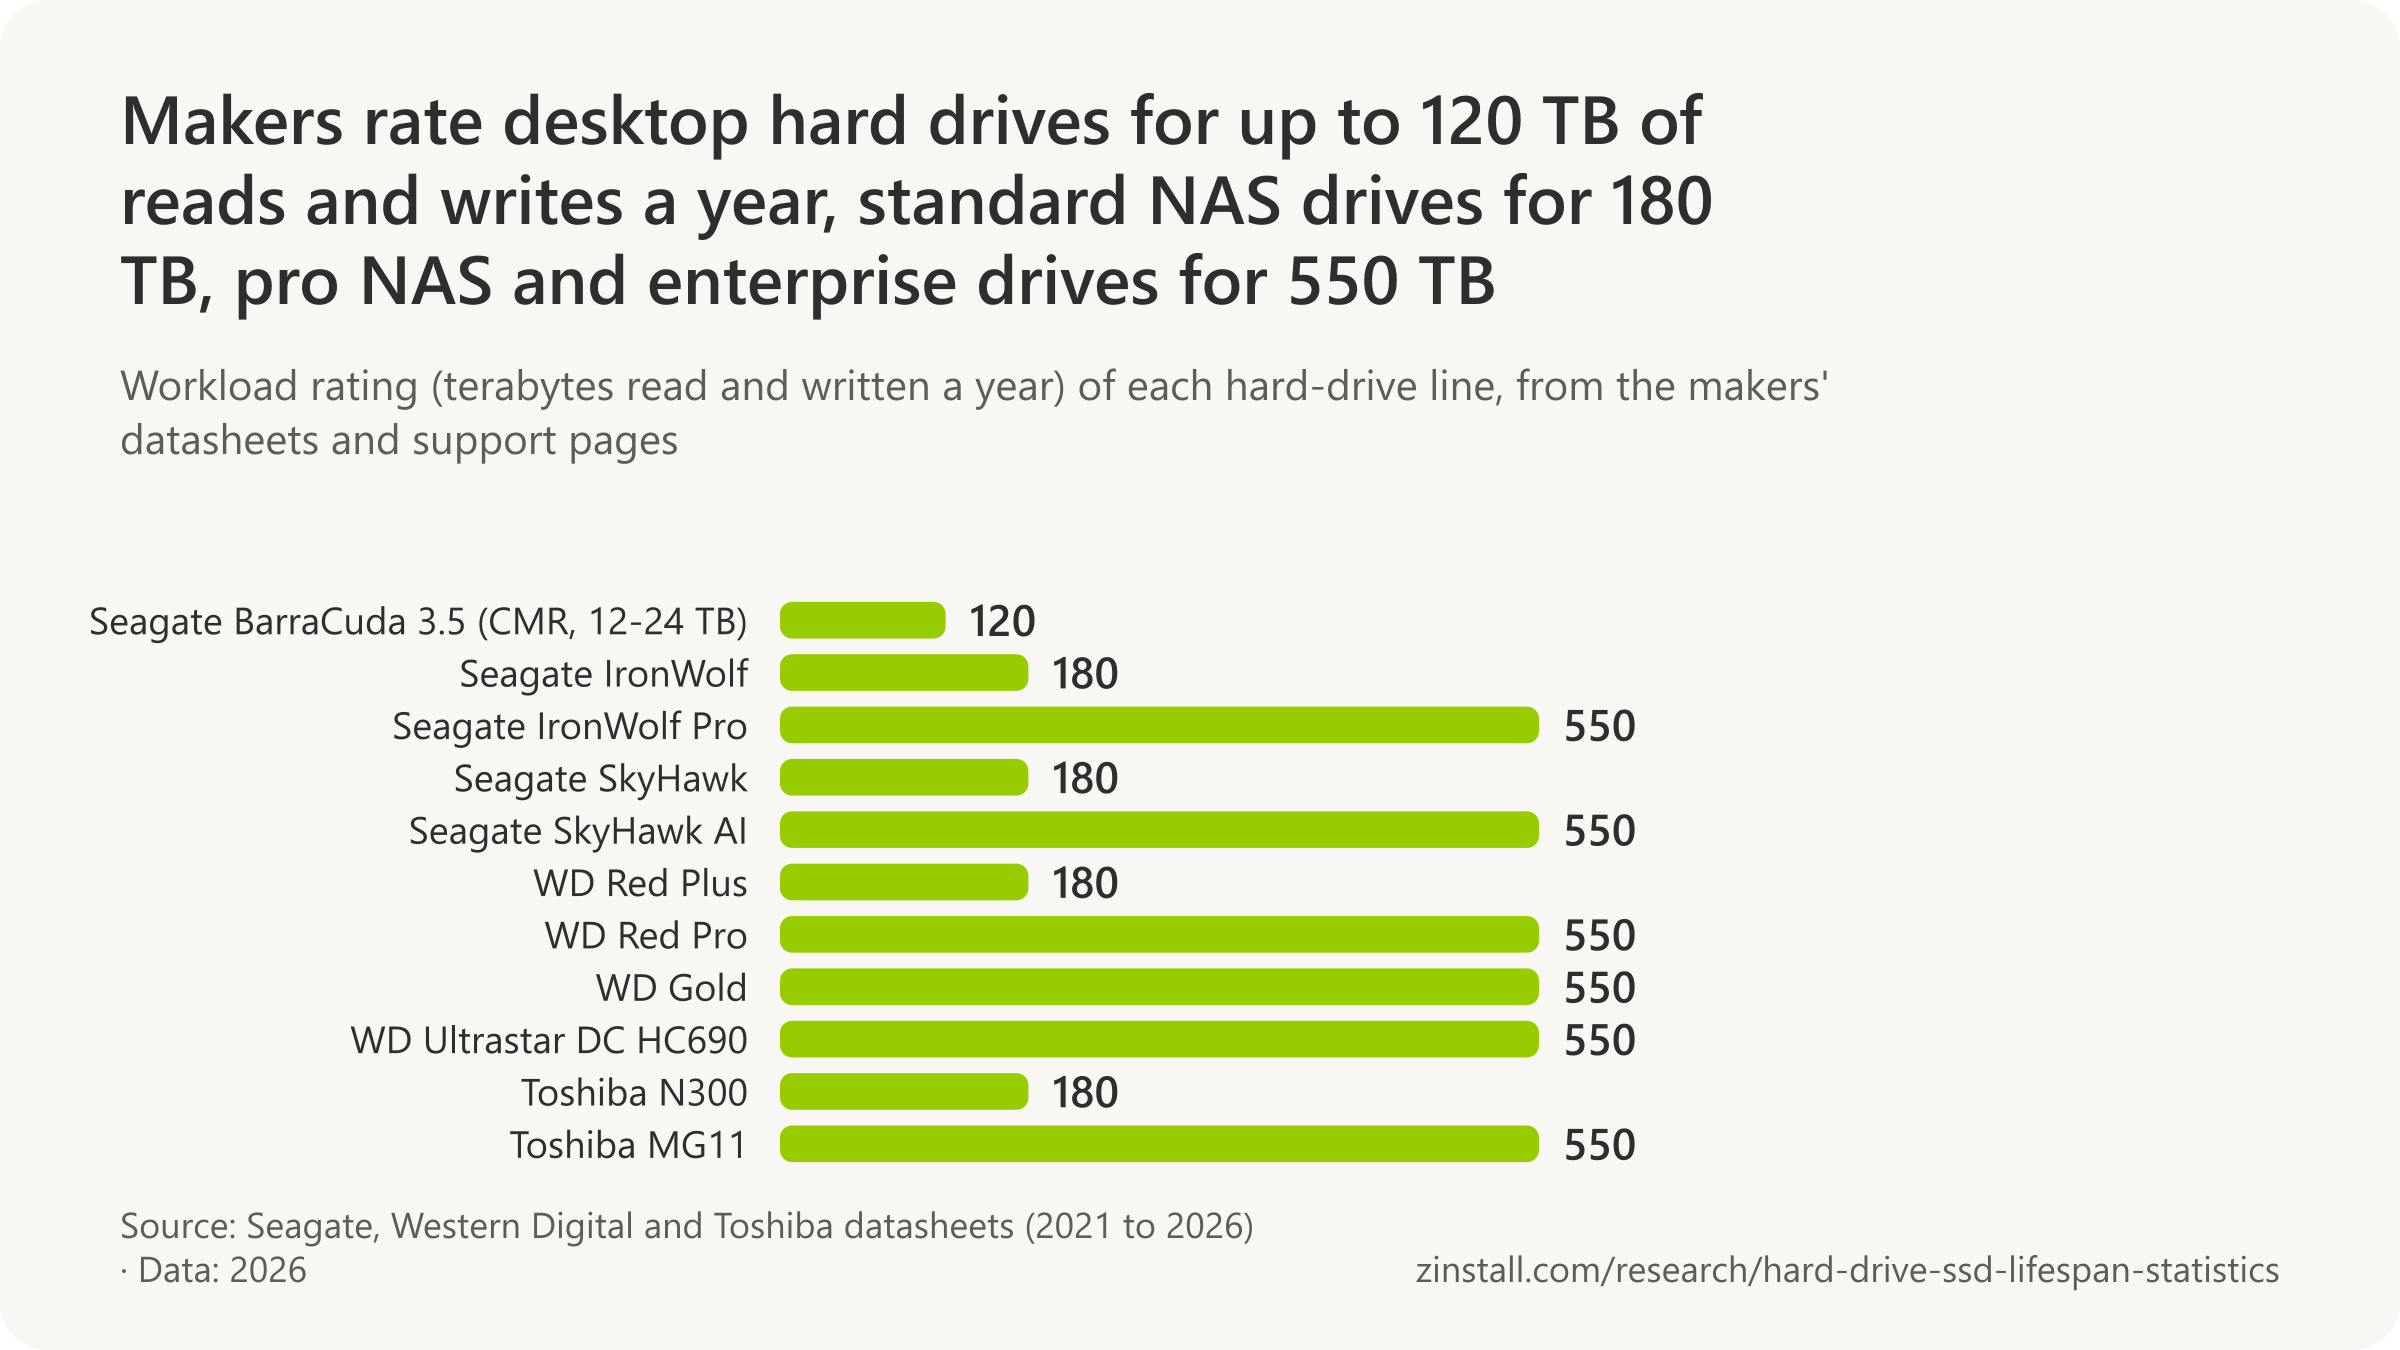

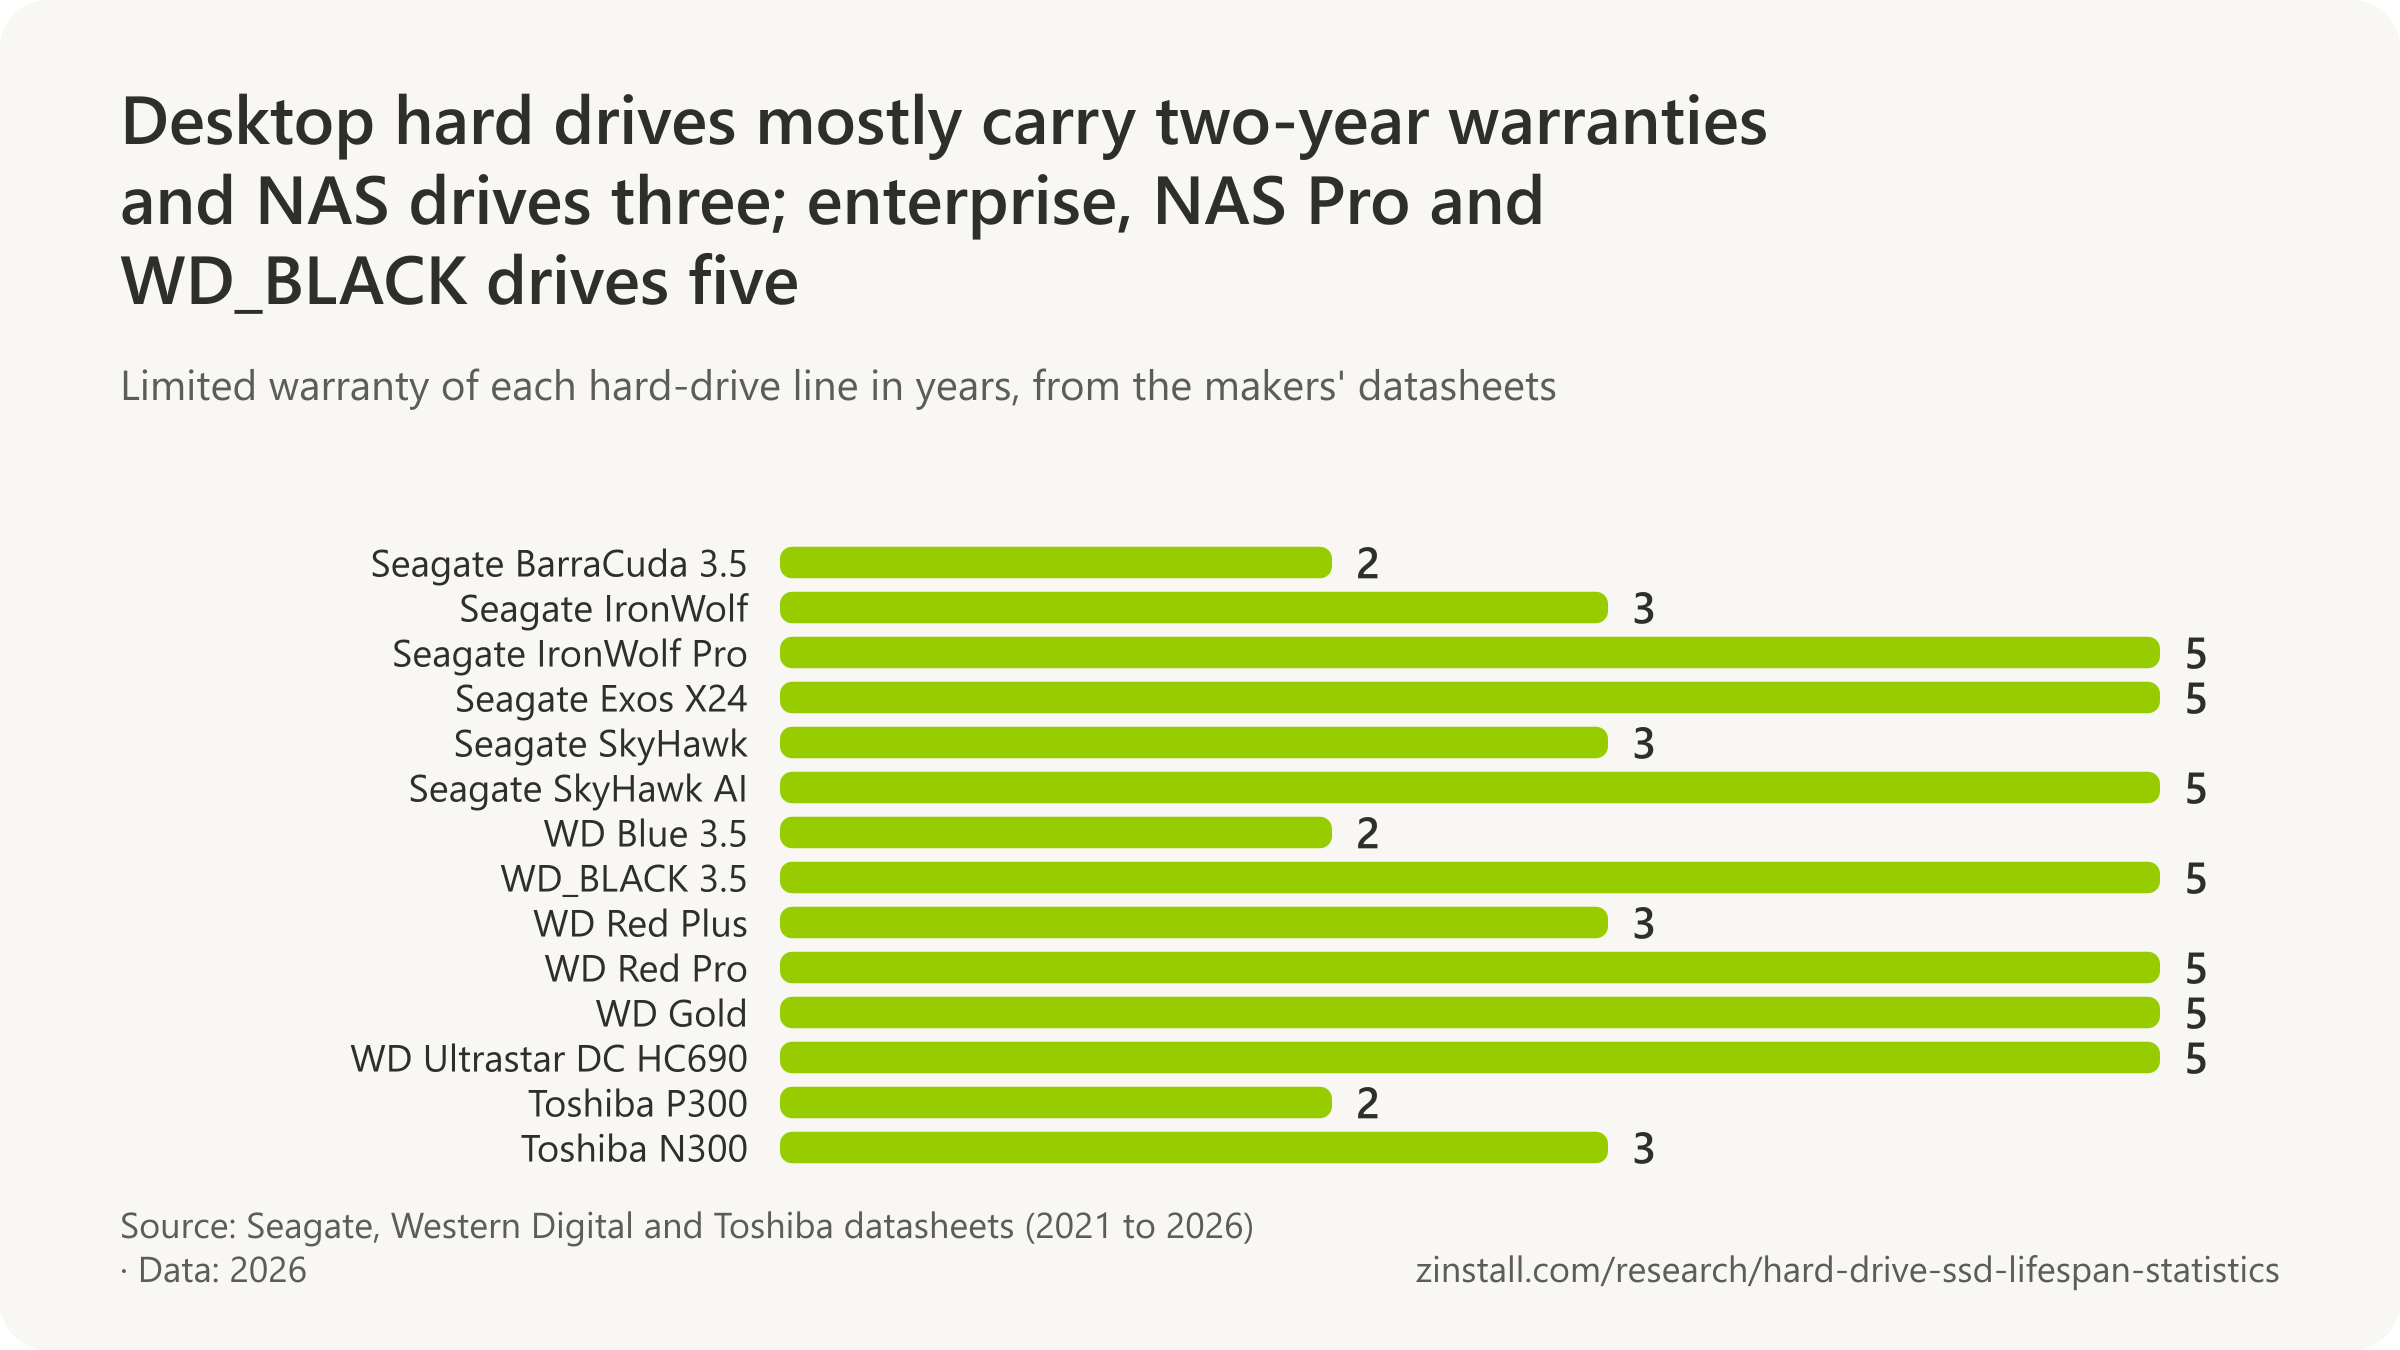
- Seagate rates its desktop and laptop hard drives for a workload of 55 TB a year (reads plus writes), its NAS, surveillance and archive drives for 180 TB and its enterprise drives for 300 to 550 TB, and says reliability drops above the limit (Seagate, 2015).
- Seagate's specifications for its BarraCuda 3.5-inch desktop hard drives assume 2,400 power-on hours a year (Seagate, 2026).
- Seagate rates BarraCuda 3.5-inch desktop hard drives for 600,000 load/unload cycles of the read-write heads (Seagate, 2026).
- Seagate sets a workload rate limit of under 550 TB a year for its nearline enterprise-capacity drives, and says that above the limit the drive's reliability will begin to decline (Seagate, 2026).
- Seagate sets a workload rate limit of under 180 TB a year for its 'nearline lite' drive segment (Seagate, 2026).
- WD rates WD Blue 3.5-inch desktop hard drives for 300,000 load/unload cycles (Western Digital, 2025).
- WD rates WD Red Plus NAS hard drives for 600,000 load/unload cycles (Western Digital, 2025).
- WD rates Ultrastar DC HC690 data-centre hard drives for 600,000 load/unload cycles at 40°C (Western Digital, 2024).
Temperature limits and read-error specifications
- Five read-error events (four clear, one suspected) occurred while 2 petabytes moved through SATA drives, where the drives' bit-error specification predicted 112, in Microsoft Research's test (Microsoft Research, 2005).
- Seagate specifies a maximum of one non-recoverable read error per 10^14 bits read for its BarraCuda 3.5-inch desktop hard drives (Seagate, 2026).
- Seagate advises against running IronWolf NAS drives at sustained drive temperatures above 60°C, saying higher temperatures may affect drive health (Seagate, 2022).
- Seagate specifies a maximum of one non-recoverable read error per 10^15 bits read for its IronWolf Pro NAS hard drives (Seagate, 2025).
- Seagate states that operating its SkyHawk drives at higher temperatures will reduce the products' useful life, and does not recommend sustained extreme temperatures (rated maximum 65°C drive-reported) (Seagate, 2021).
- Toshiba states that continual operation of its MG11 enterprise drives above a 40°C case (HDA surface) temperature may degrade product reliability (Toshiba, 2024).
- Seagate says hard drives are designed for a 30°C (86°F) ambient temperature and that temperatures above 50°C (122°F) or below 5°C (41°F) decrease reliability (Seagate, accessed 2026).
- JEDEC's JESD218 limits a client SSD to 1 unrecoverable data error per 10^15 bits read (UBER), averaged over the drive's rated endurance (JEDEC, 2010).
- JEDEC's JESD218 limits an enterprise SSD to 1 unrecoverable data error per 10^16 bits read (UBER), ten times stricter than the client class (JEDEC, 2010).
Sources: Carnegie Mellon University; Seagate Technology (2015-2026); Samsung Electronics (2021, 2022); Kingston Technology; SK hynix; Crucial (2021, 2026); Western Digital (2022, 2024, 2025); Toshiba Electronics Europe (2025, 2026); Toshiba Electronic Devices & Storage Corporation; Microsoft Research; JEDEC Solid State Technology Association
How long does an external hard drive last?
60.8% of failed external hard drives sent to one US recovery lab had run under a year (Secure Data Recovery, 2026).

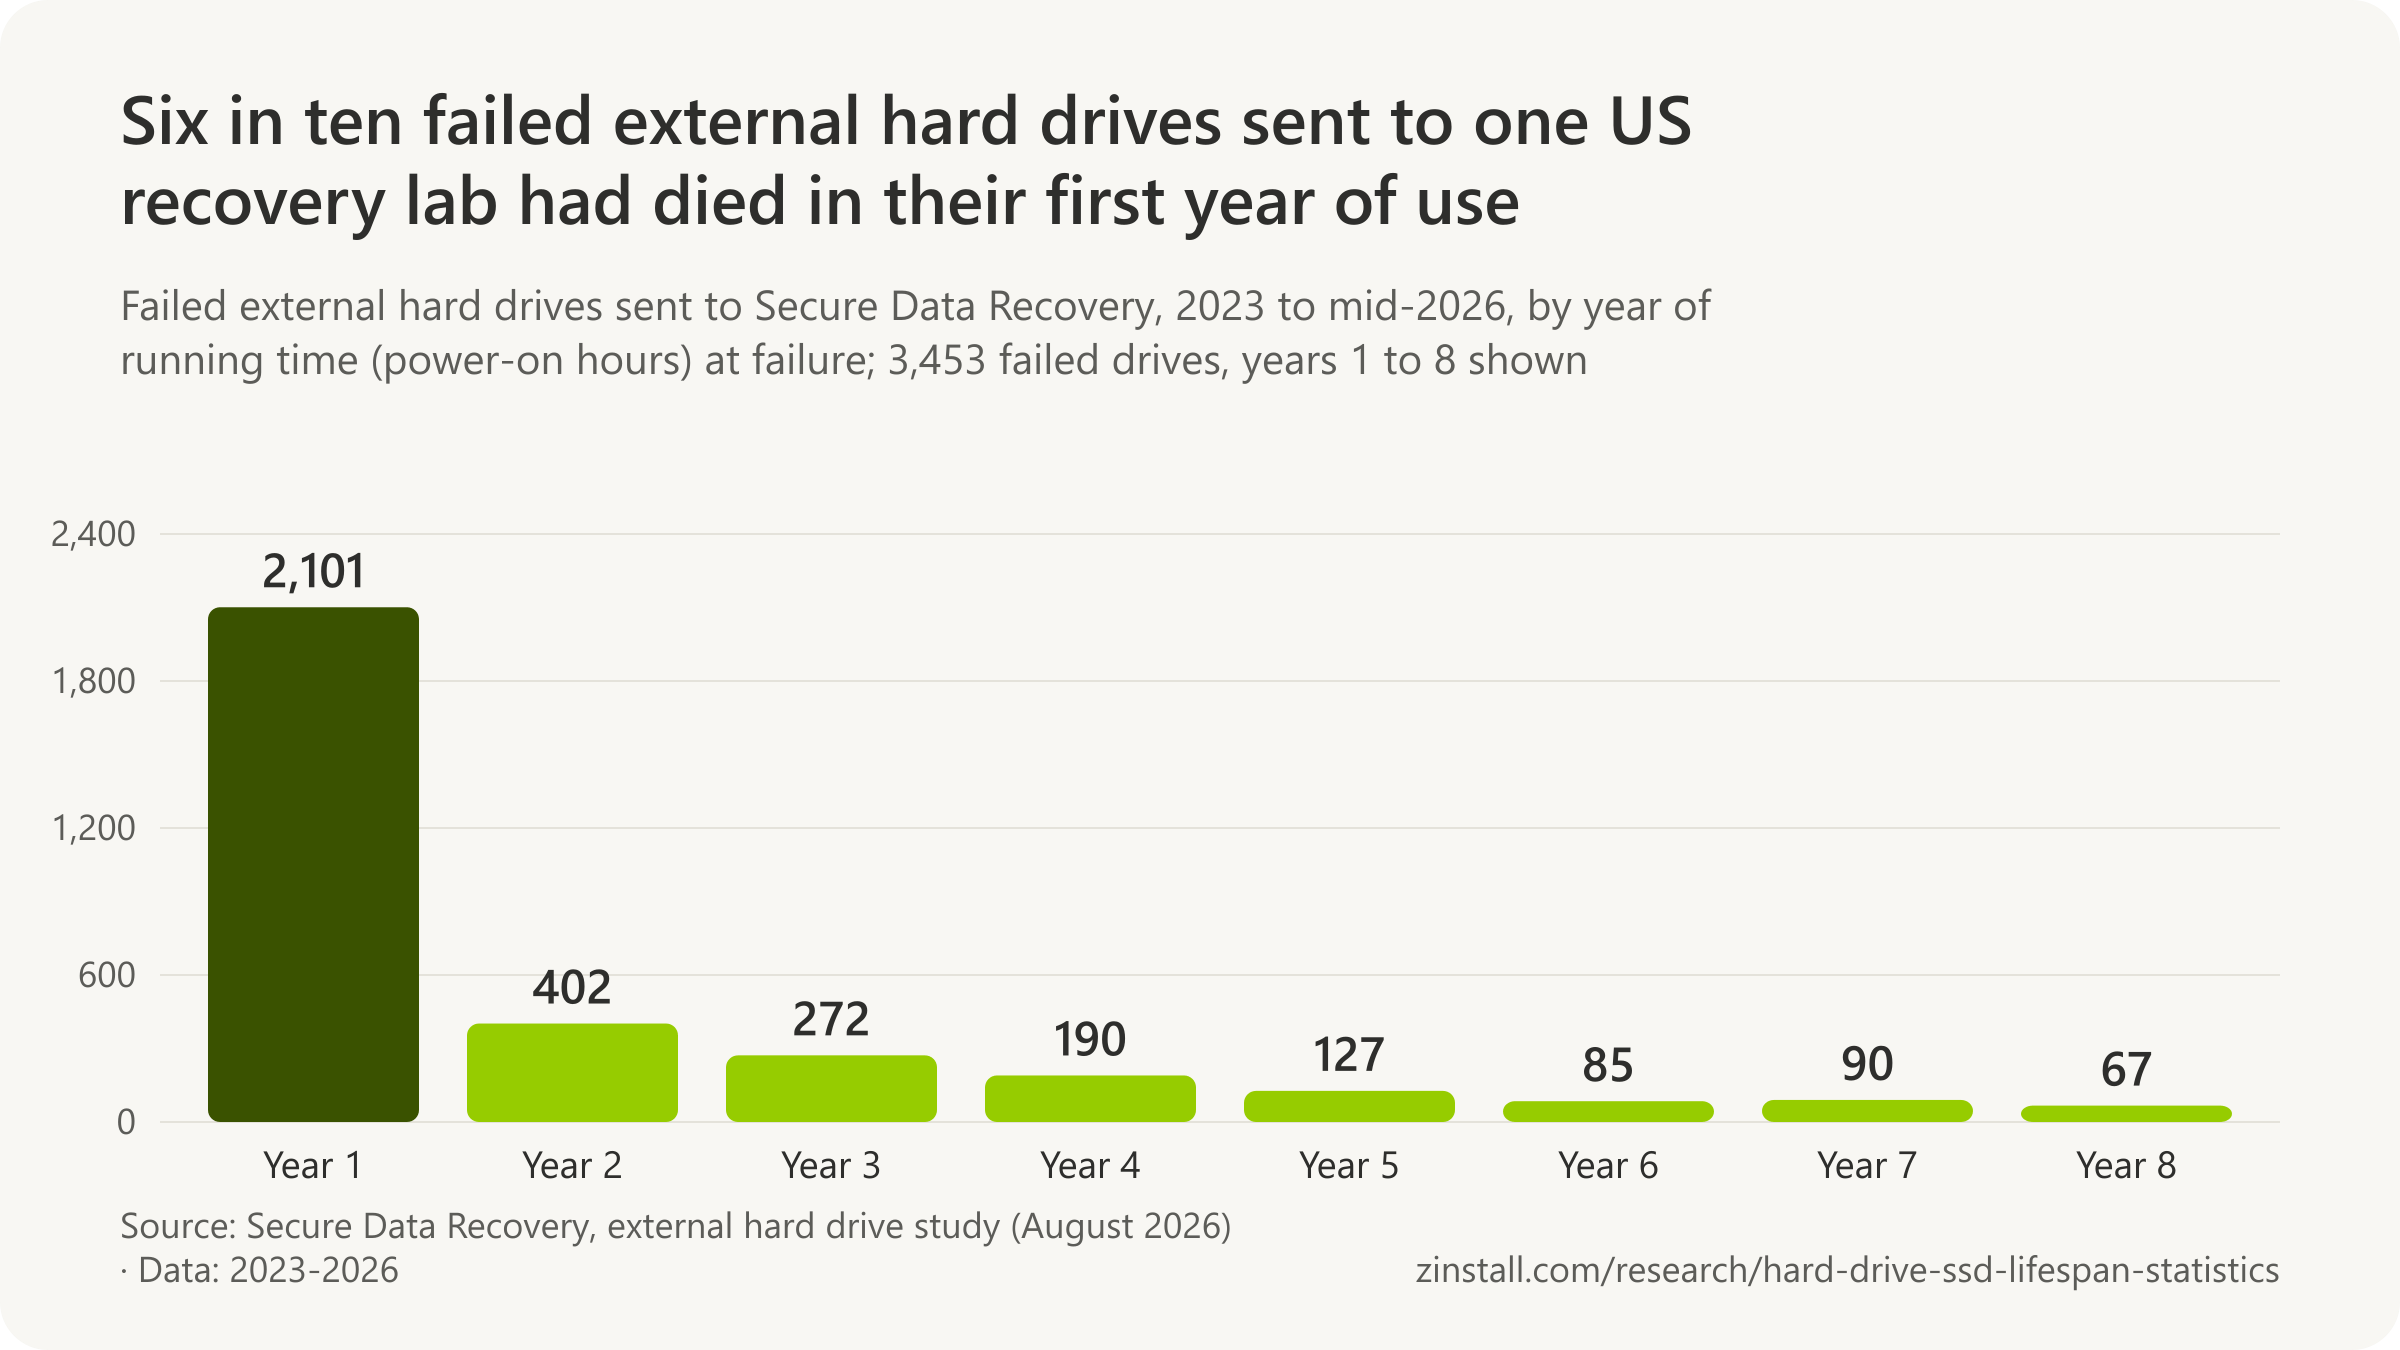
- The median failed external drive sent to one US recovery lab had run 190 days of power-on time.
- External drives were 21.1% of the drives sent for data recovery in Japan in 2024.
- About 6 petabytes of the drives in one data-centre study were external drives taken out of their cases.
- Seagate's portable drive carries 1 year of warranty in the Americas and three in Asia-Pacific.
| Drive or sample and measure | Figure |
|---|---|
| WD My Passport (hard drive): warranty | 3 years |
| Samsung T9 (SSD): warranty | 5 years |
| SanDisk Extreme Portable (SSD): warranty | 5 years |
| LaCie Rugged: data recovery service included | 3 years of data recovery |
| Samsung T7: drop rating (drop damage not covered) | 2 m |
| LaCie Rugged: drop rating, not running | 1.2 m (4 ft) |
| WD My Passport: operating temperature | 5°C to 35°C |
| Failed external drives that had run under six months | 49.6% |
| Failed external drives with no bad-sector warning | 27.2% |
| Japan Data Technology: external drives among recovery requests, 2009 | 32.3% |
Sources: Secure Data Recovery Services; Data Recovery Association of Japan; Backblaze; Seagate Technology; Western Digital; Samsung Electronics (2026, 2024); Sandisk Corporation; LaCie; Japan Data Technology
Related guides: Back up to an external hard drive · Transfer with a USB drive
More statistics (13)
No maker or fleet operator publishes failure rates for external drives: the only measured data comes from the recovery labs they are sent to, and those labs see failures, not survivors. In those samples external drives tend to fail young, with drops, power surges and heat among the leading causes. The makers' warranties run one to five years, and differ by region and model.
Failed external drives at recovery labs
- 190 days (4,559 power-on hours) was the median running time before failure among 3,453 failed external hard drives sent to Secure Data Recovery from January 2023 to June 2026 (Secure Data Recovery, 2026).
- 665 days (15,961 power-on hours, about 1 year 10 months) was the average running time before failure among 3,453 failed external hard drives sent to Secure Data Recovery from 2023 to mid 2026 (Secure Data Recovery, 2026).
- 60.8% of the failed external hard drives sent to Secure Data Recovery from 2023 to mid 2026 had run less than one year when they failed (2,101 of 3,453 drives) (Secure Data Recovery, 2026).
- 49.6% of the failed external hard drives sent to Secure Data Recovery from 2023 to mid 2026 had run less than six months, and 2.2% less than 24 hours (Secure Data Recovery, 2026).
- 27.2% of the failed external hard drives sent to Secure Data Recovery from 2023 to mid 2026 had no pending bad sectors when they died, so SMART gave no warning (Secure Data Recovery, 2026).
- Accidental drops, power surges, extreme heat and manufacturing defects were the leading causes of failure among the external hard drives sent to Secure Data Recovery from 2023 to mid 2026 (Secure Data Recovery, 2026).
- No fleet of external hard drives large enough to measure annualized failure rates is tracked, Secure Data Recovery noted in 2026, so its external-drive figures come from failed drives sent to its labs (Secure Data Recovery, 2026).

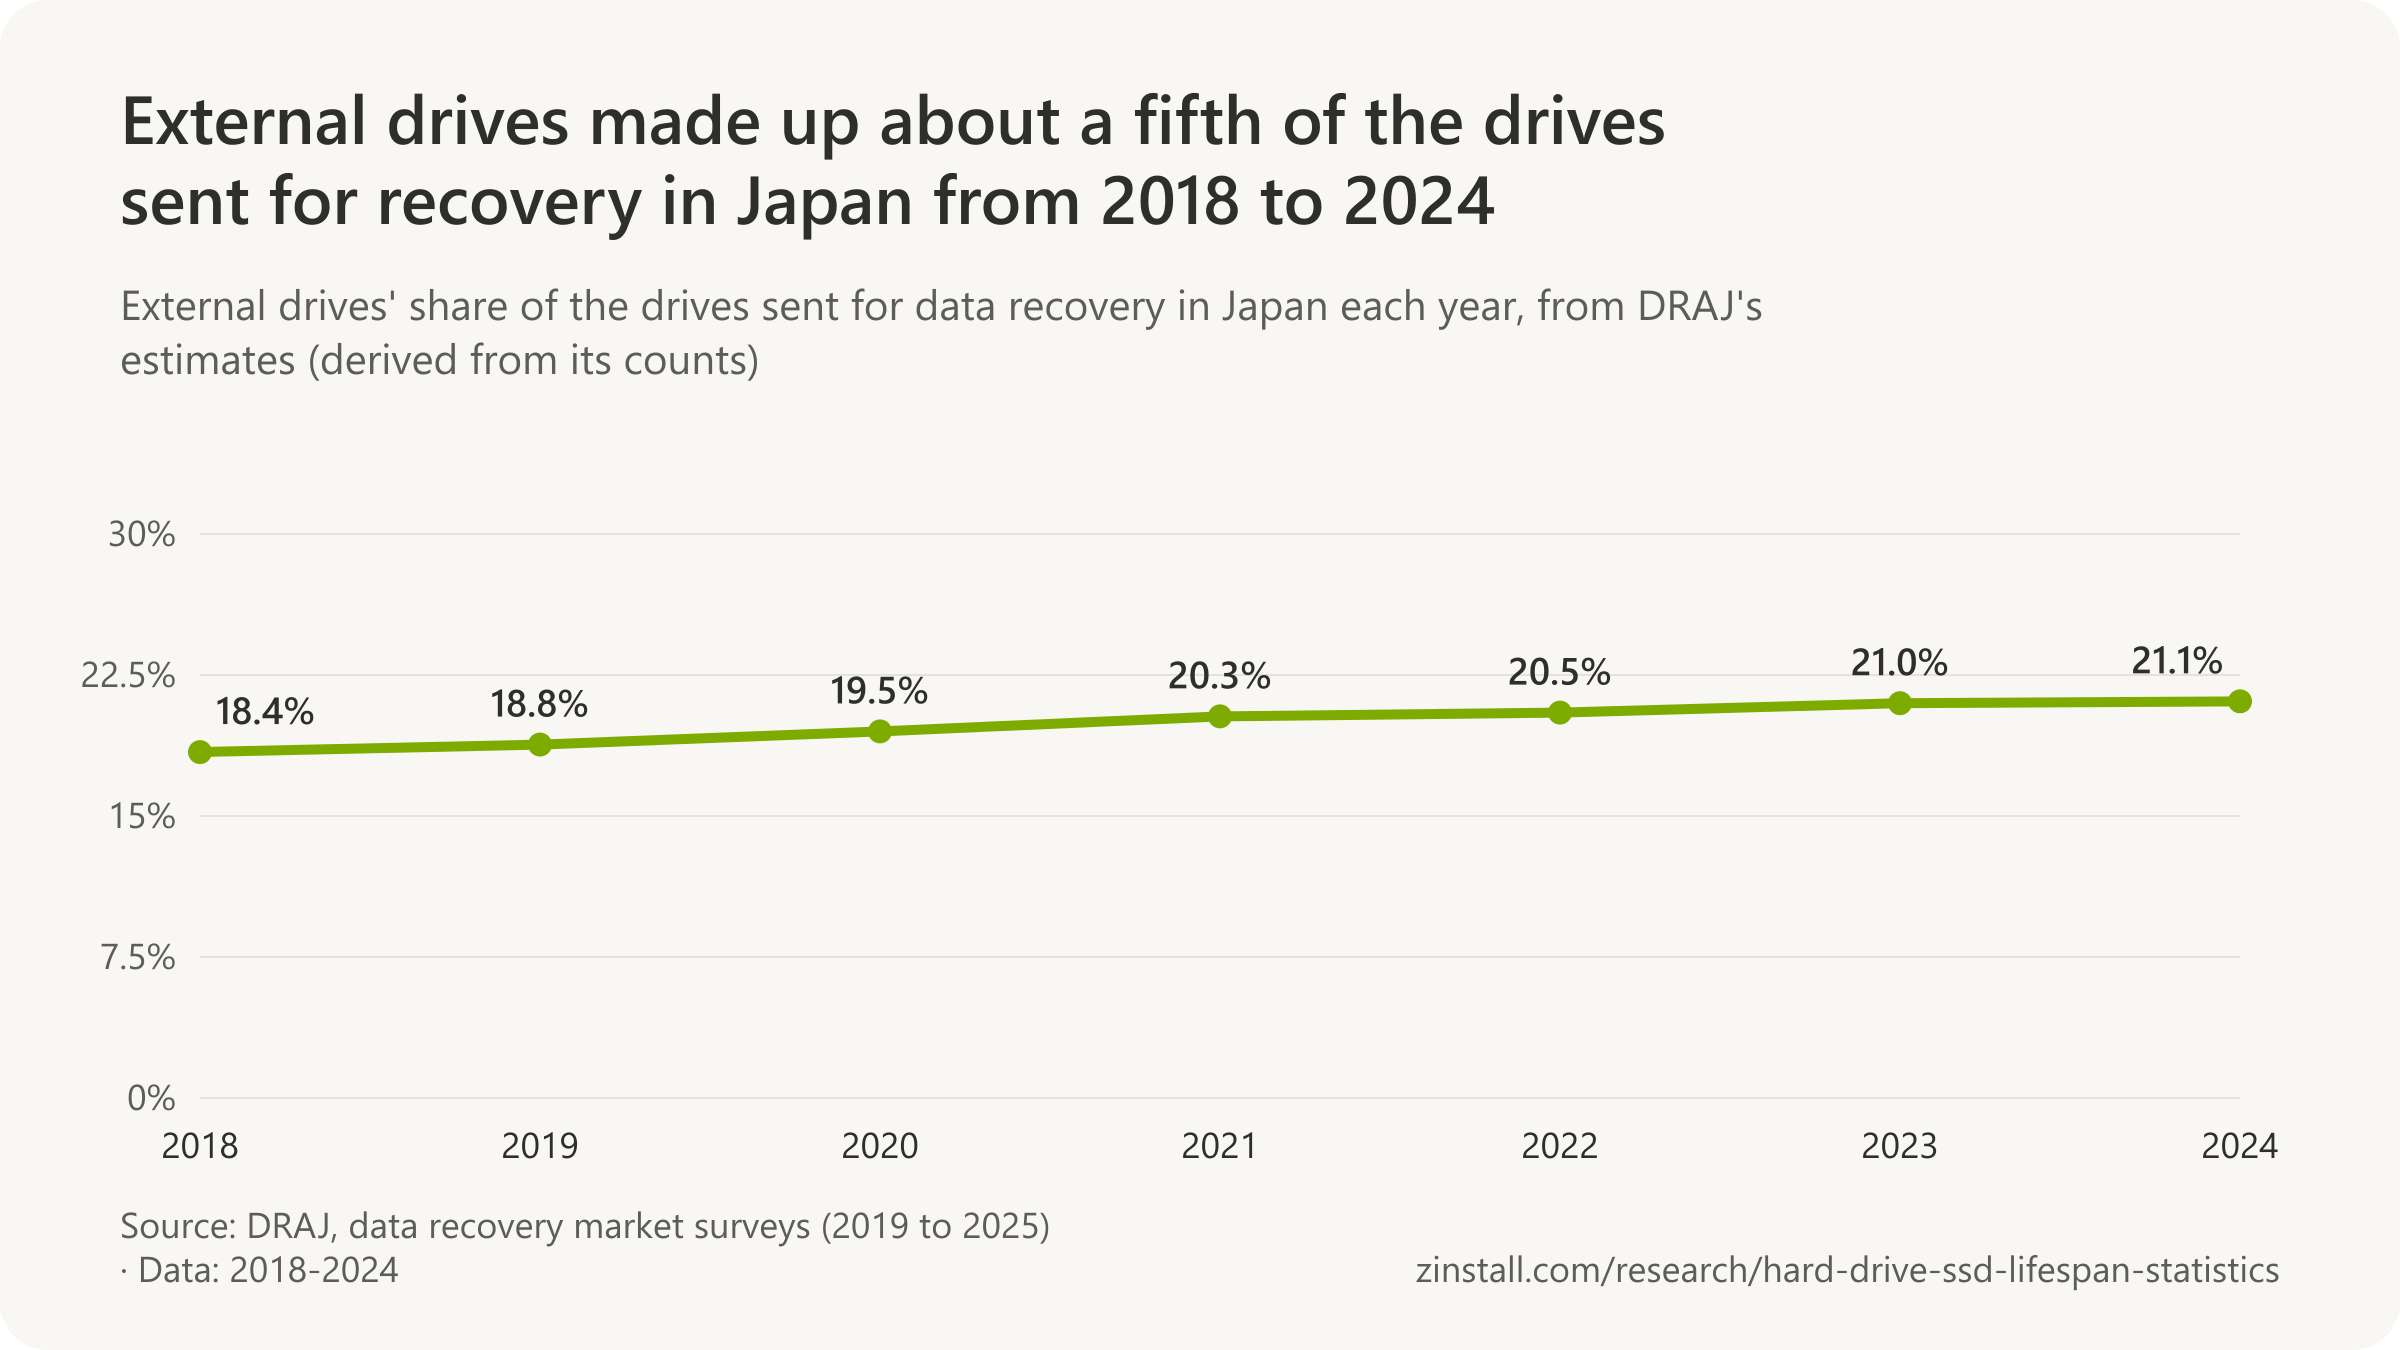
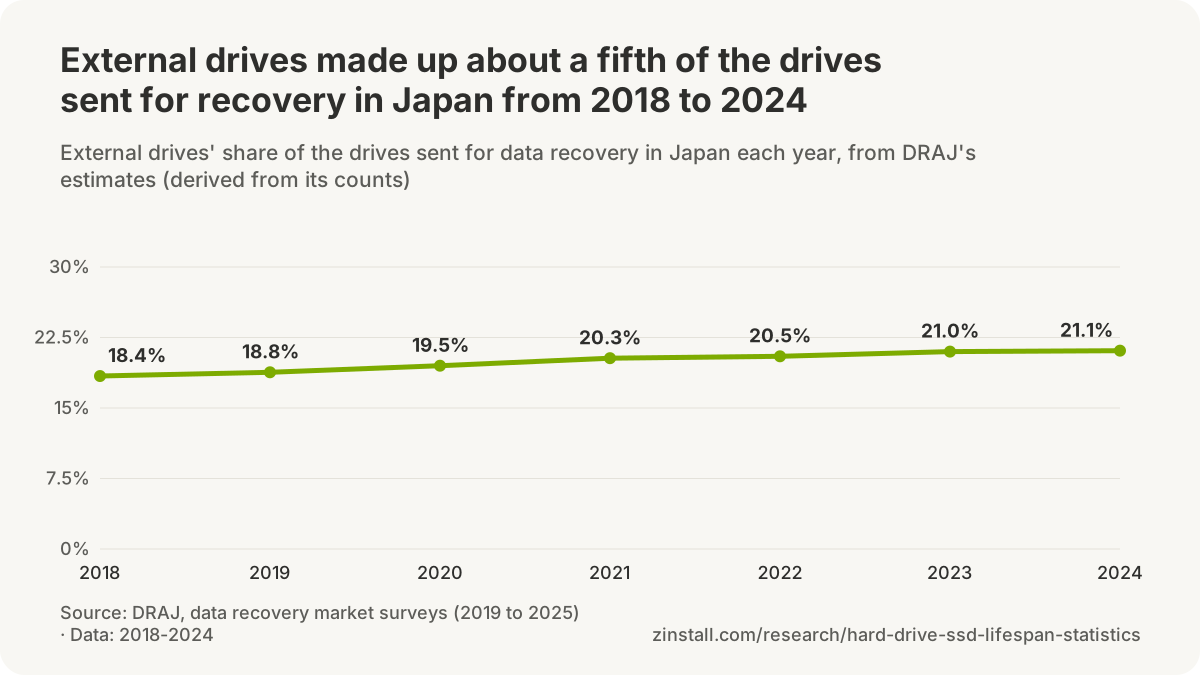
- 32.3% of the devices brought to Japan Data Technology for recovery in 2009 were external hard drives (USB or NAS), against 21.3% desktops, 19.7% notebooks and 26.2% bare drives, among over 40,000 drives (Japan Data Technology, 2010).
Warranties and ruggedness ratings

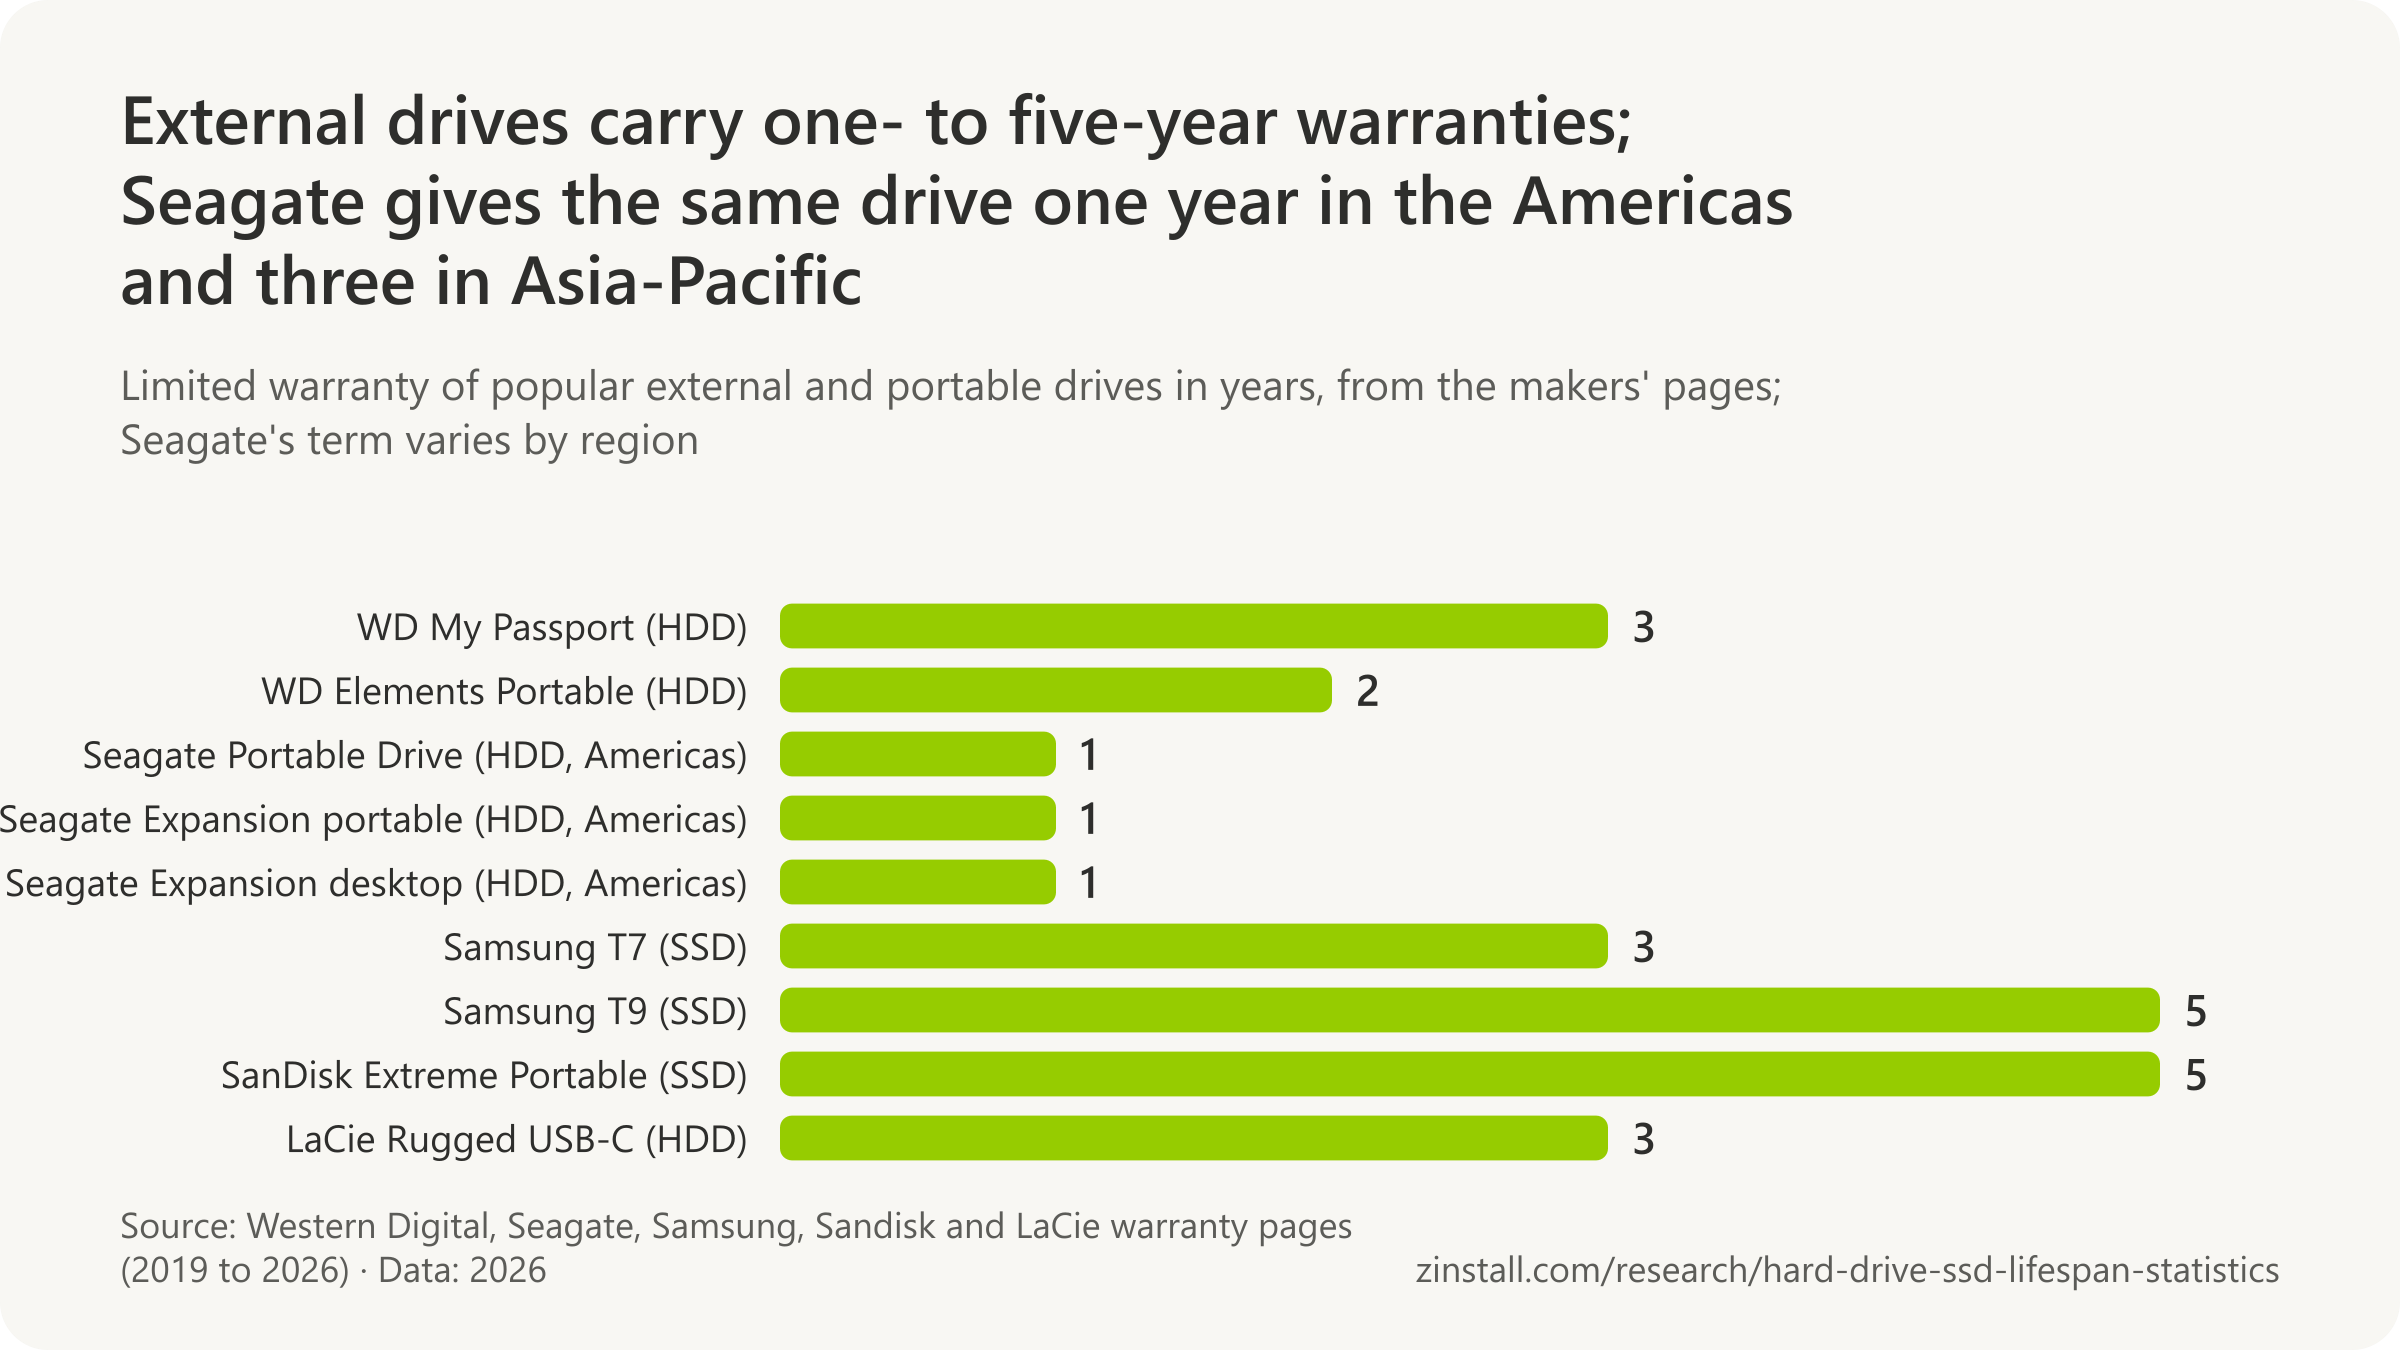
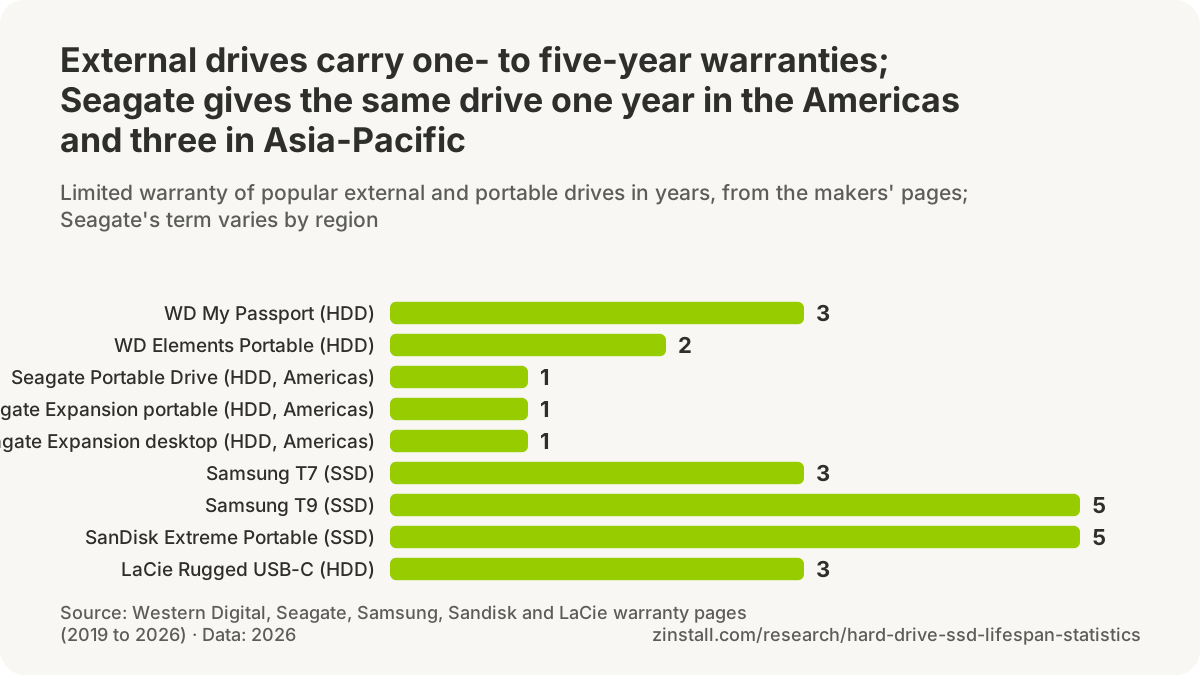
- Western Digital specifies an operating temperature of 5°C to 35°C for the WD My Passport portable hard drive (Western Digital, 2026).
- Samsung rates the Portable SSD T7 as drop resistant up to 2 metres in its own controlled test, but says damage caused by a drop is not covered under the warranty (Samsung, 2024).
- Every LaCie Rugged USB-C drive includes three years of Seagate's Rescue data recovery service, where available, alongside its limited warranty (LaCie, 2023).
- LaCie rates the Rugged USB-C portable hard drive to survive a drop of 4 feet (1.2 metres) when it is not running, and a 1-ton car driving over it (LaCie, 2023).
External drives in a data centre
- About 6 petabytes of the hard drives in Backblaze's 2013 drive-life study were originally external USB drives taken out of their enclosures (Backblaze, 2013).
Sources: Secure Data Recovery Services; Japan Data Technology; Western Digital (2026); Samsung Electronics (2024, 2026); LaCie; Backblaze; Data Recovery Association of Japan; Seagate Technology (2019, 2020, 2025); Sandisk Corporation
How long does an SSD or hard drive keep data without power?
A worn-out consumer SSD must keep data 1 year unpowered at 30 °C, by the standard (JEDEC, 2010).

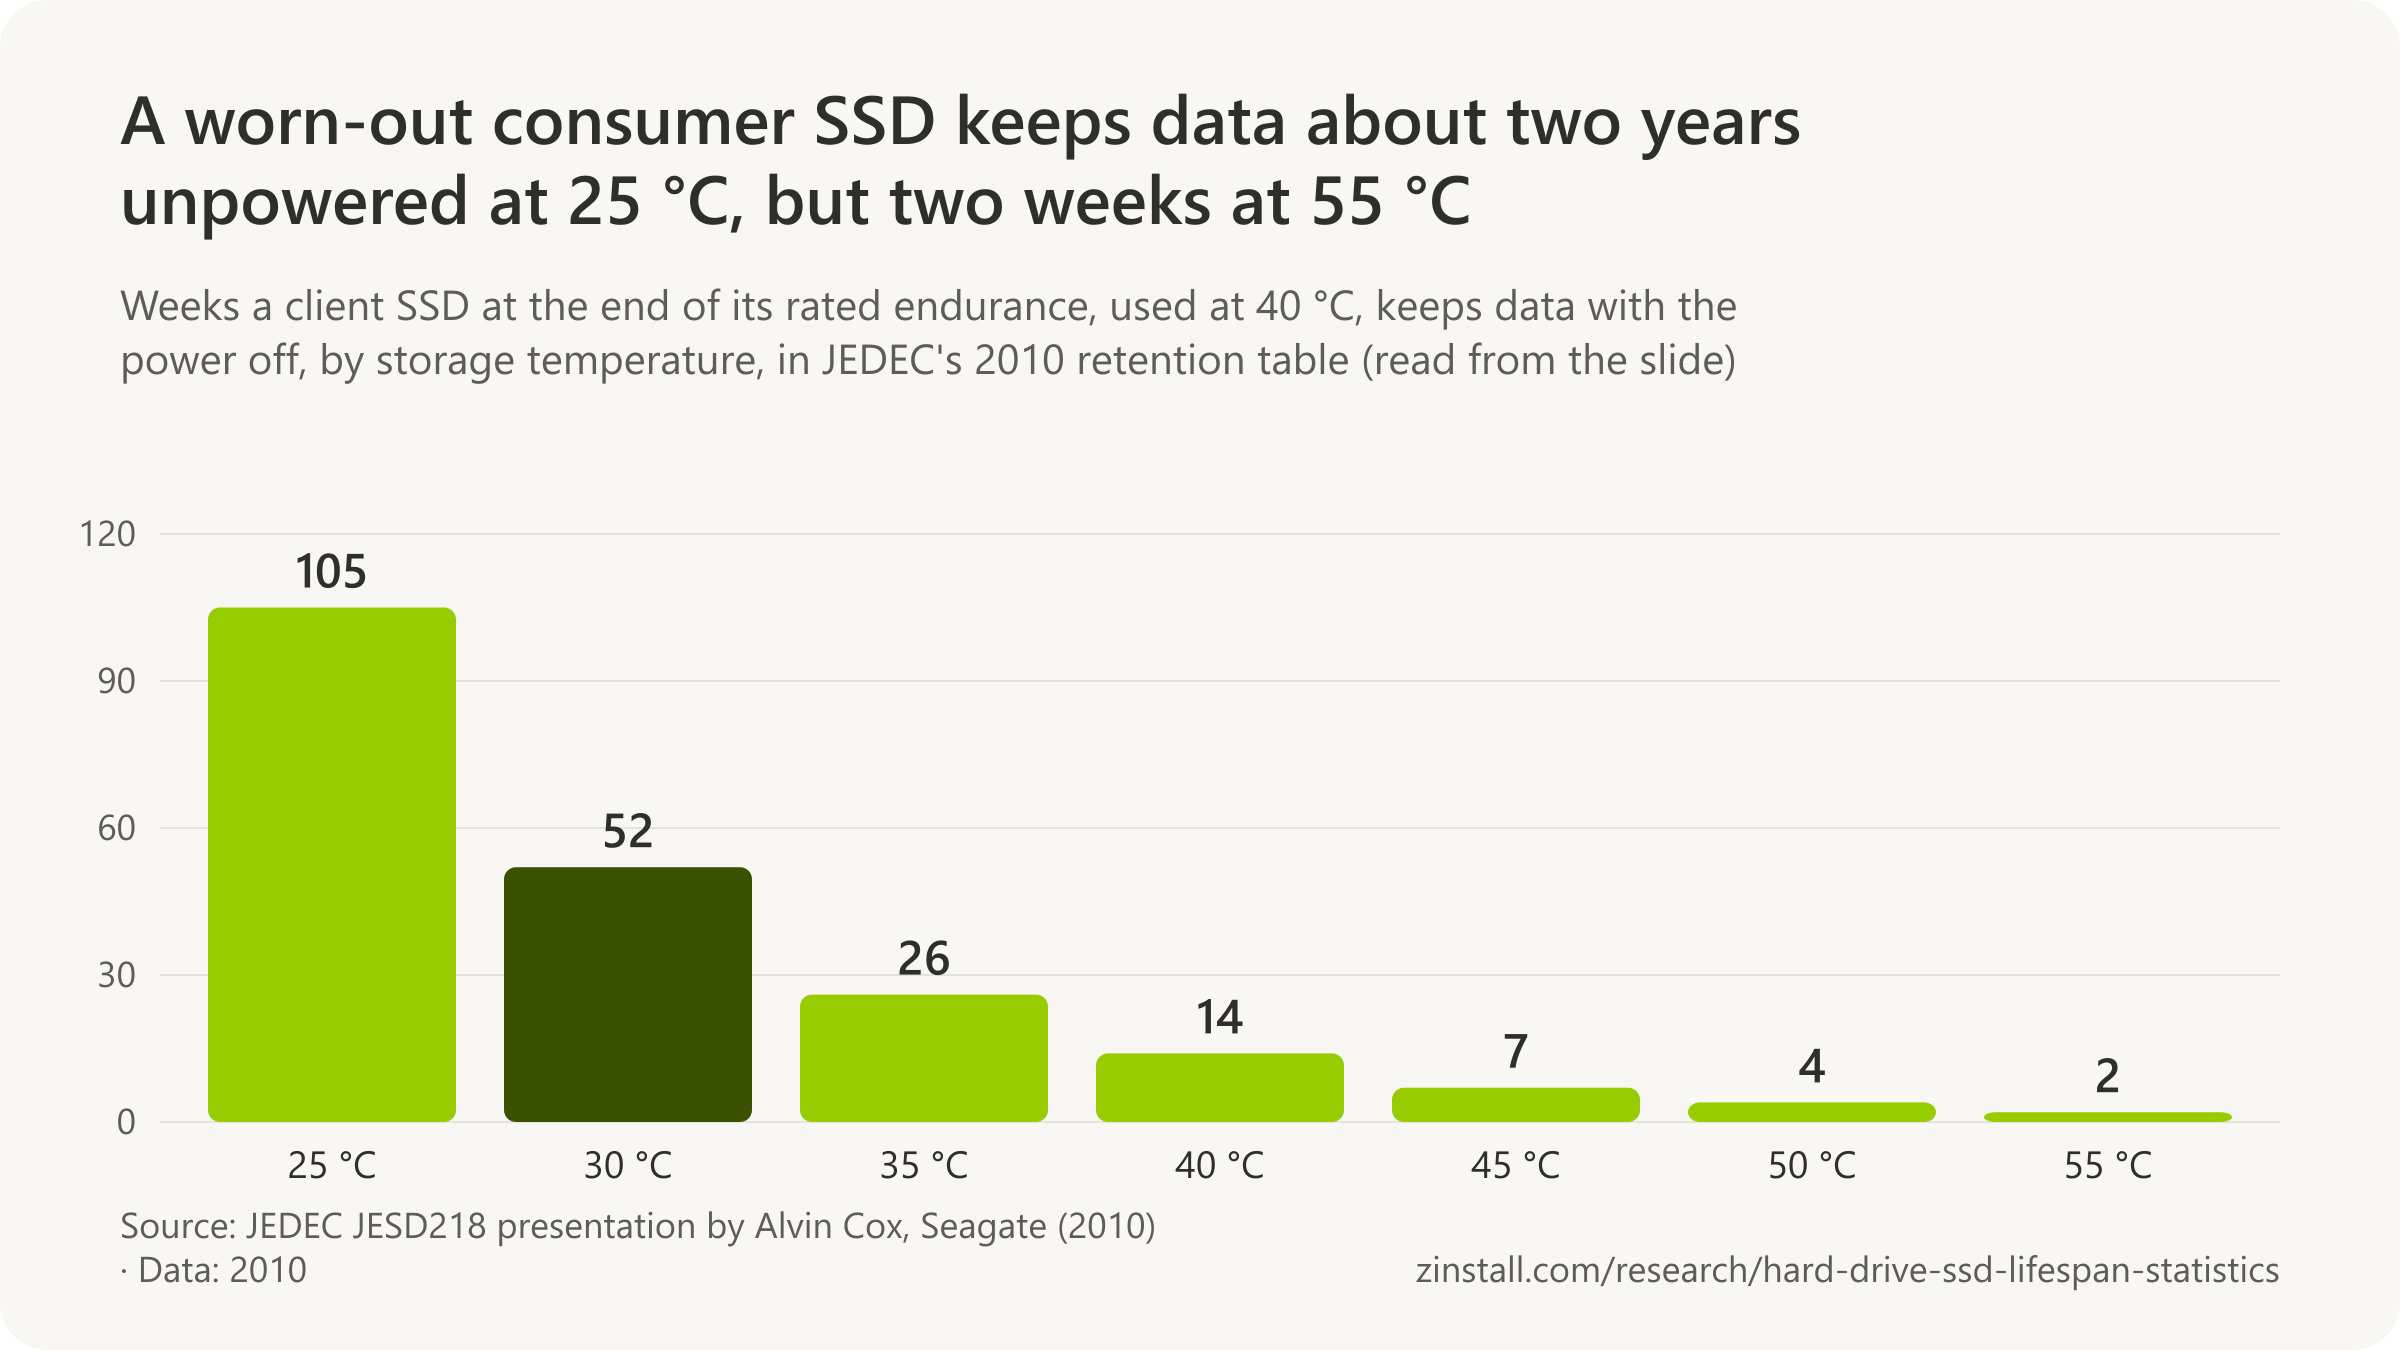
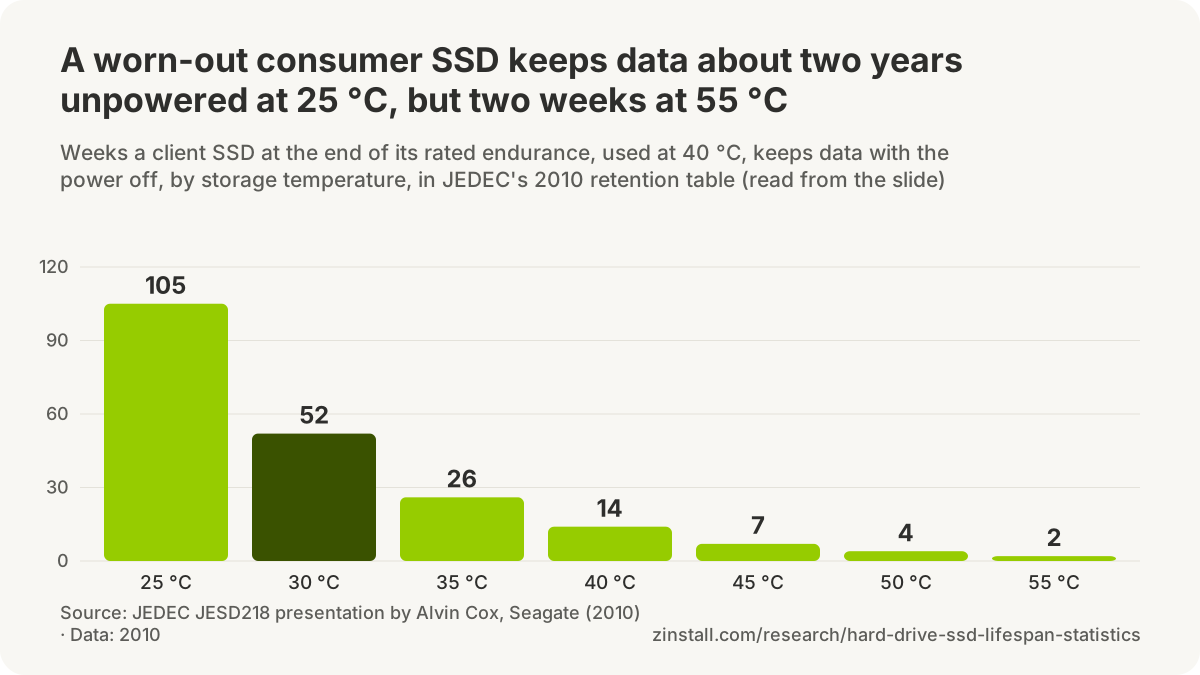
- An enterprise SSD at the end of its rated endurance must keep data 3 months unpowered at 40 °C.
- A worn-out consumer SSD stored at 55 °C keeps its data only about 2 weeks, in JEDEC's 2010 table.
- Dell recommends powering up stored enterprise SSDs every 2.5 months, for at least 3 weeks.
- After one year unpowered, a worn and a fresh SSD in a hobbyist's test read back their files without slowing.
| Source and measure | Figure |
|---|---|
| Worn consumer SSD stored at 25 °C (JEDEC table) | 105 weeks |
| Worn consumer SSD stored at 40 °C (JEDEC table) | 14 weeks |
| JEDEC: the use a consumer SSD's rating assumes | 8 hours a day at 40 °C |
| JEDEC: the use an enterprise SSD's rating assumes | 24 hours a day at 55 °C |
| c't: 3D TLC flash, rated cycles and retention | 1,500 to 3,000 cycles |
| Hobbyist test, year two, as Tom's Hardware reported it | 4 corrupt files |
Sources: JEDEC Solid State Technology Association; Dell Technologies; HTWingNut; heise online / c't magazin; Tom's Hardware
Related guides: Back up your entire computer · Back up to an external hard drive
More statistics (8)
For SSDs the standard is JEDEC's JESD218: a consumer SSD that has used up its rated endurance must keep data unpowered for a year at room temperature, and an enterprise SSD for three months. A new SSD keeps data far longer, and storage temperature changes the time sharply. The widely shared warning that an unpowered SSD loses data in a week came from JEDEC's figures for worn drives stored hot. Hard drives store data magnetically and have no such standard; archivists recommend fresh copies every few years.
JEDEC's retention requirements

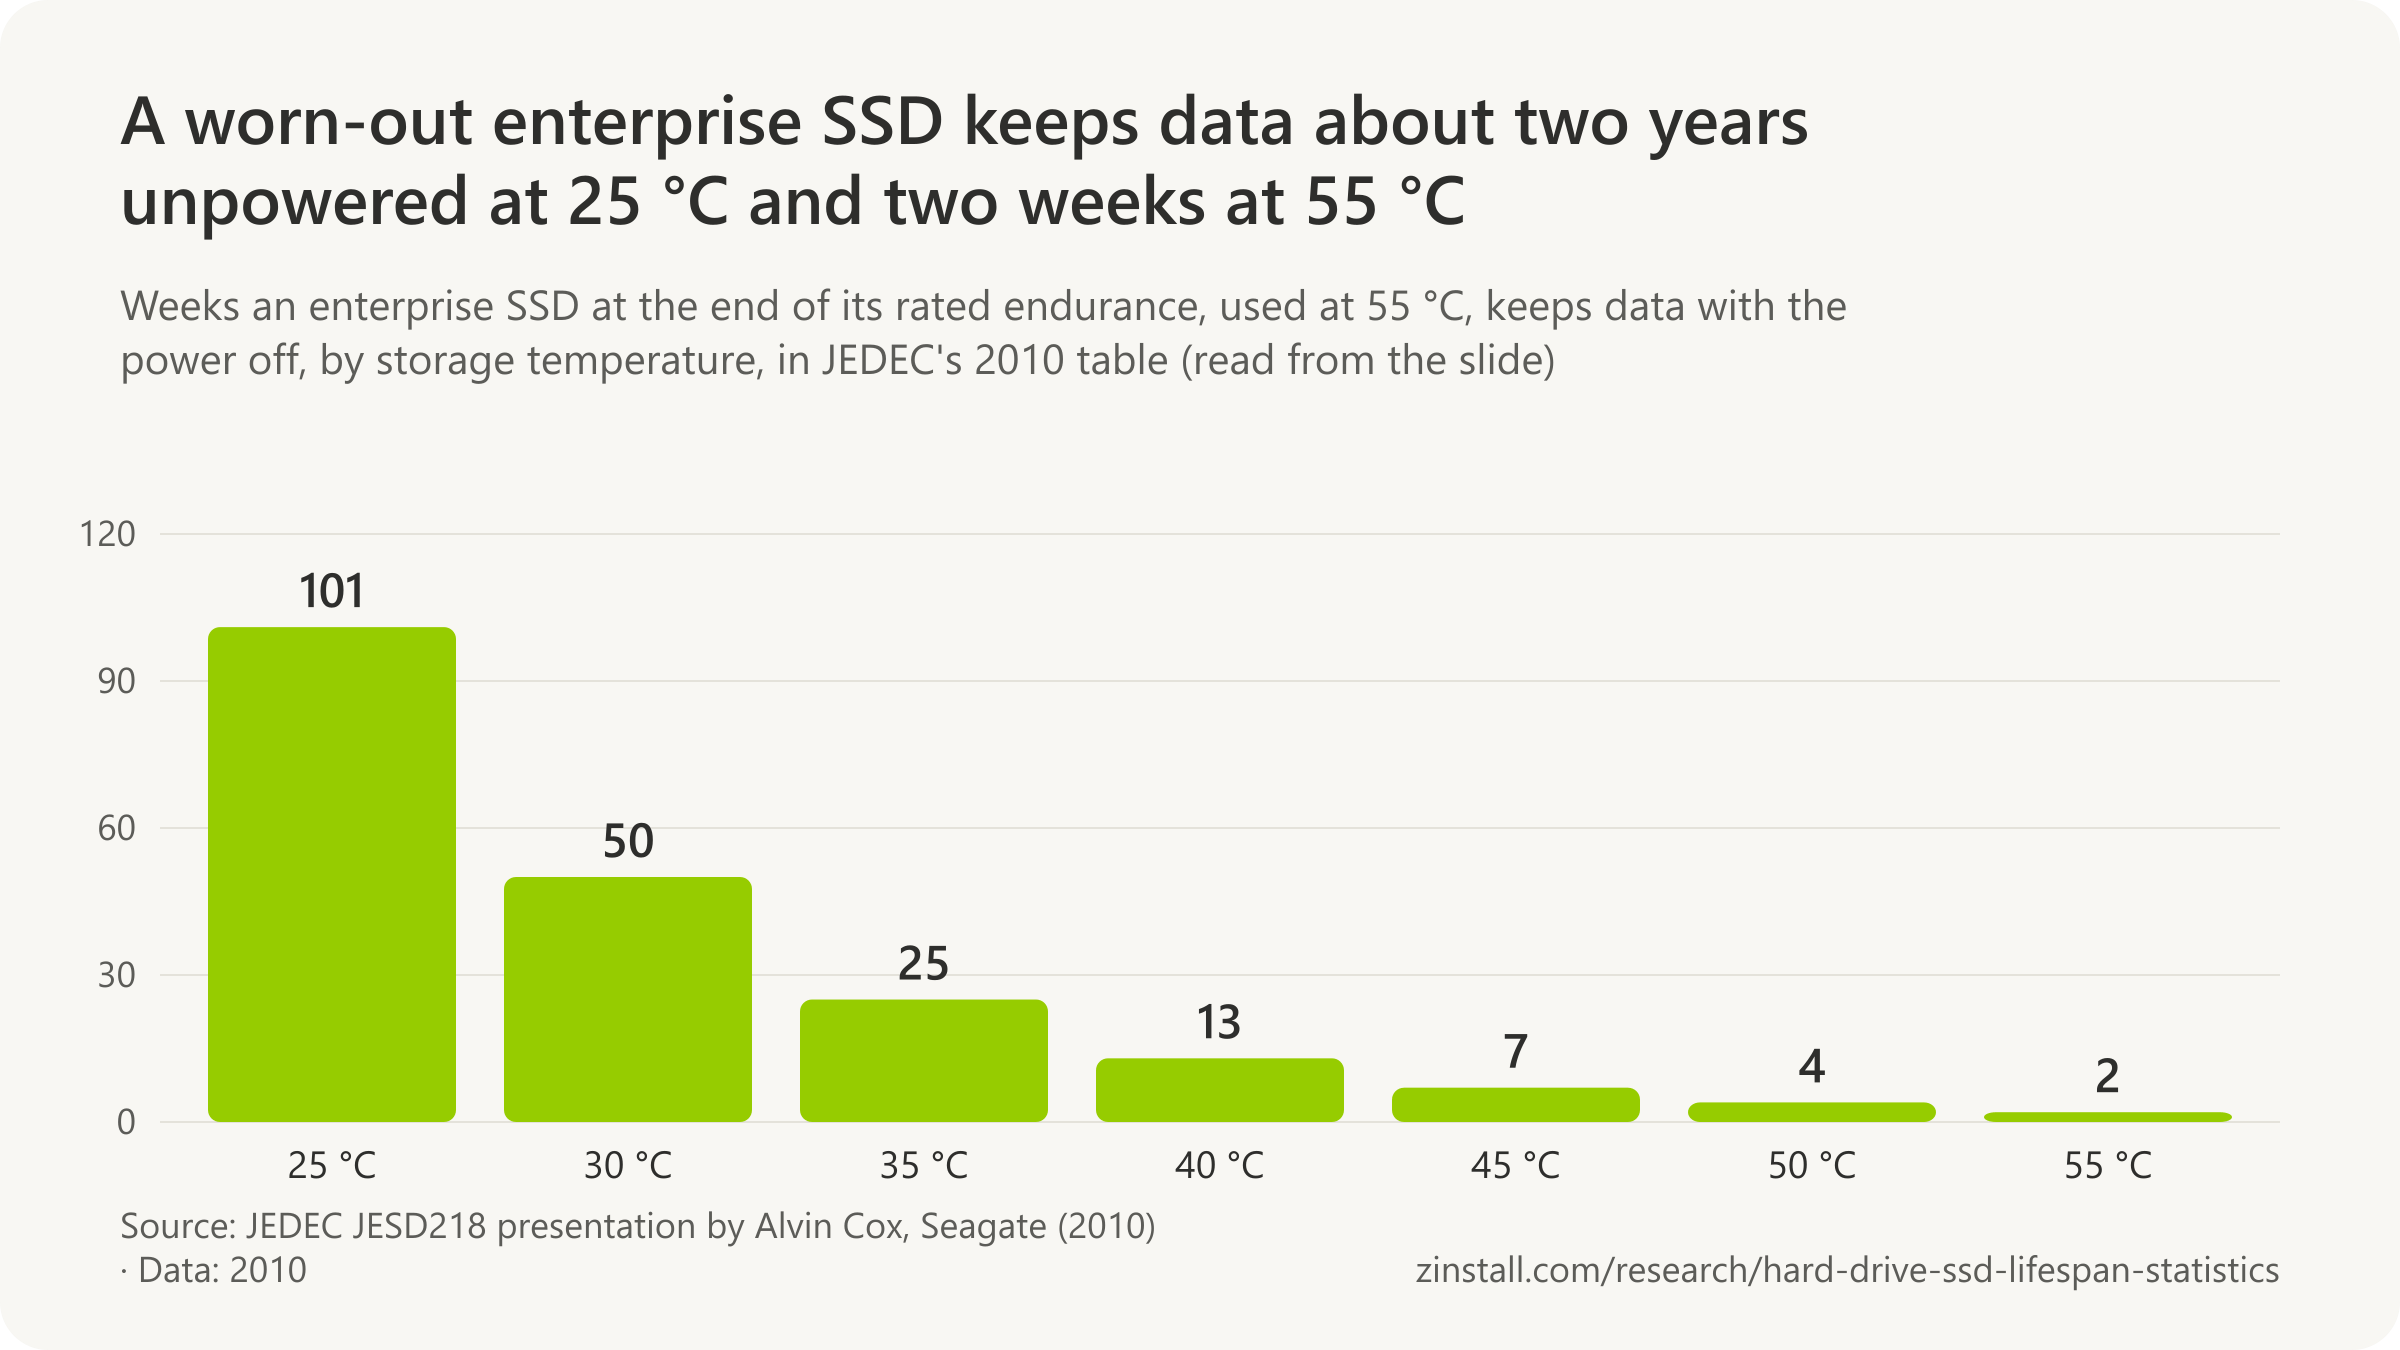
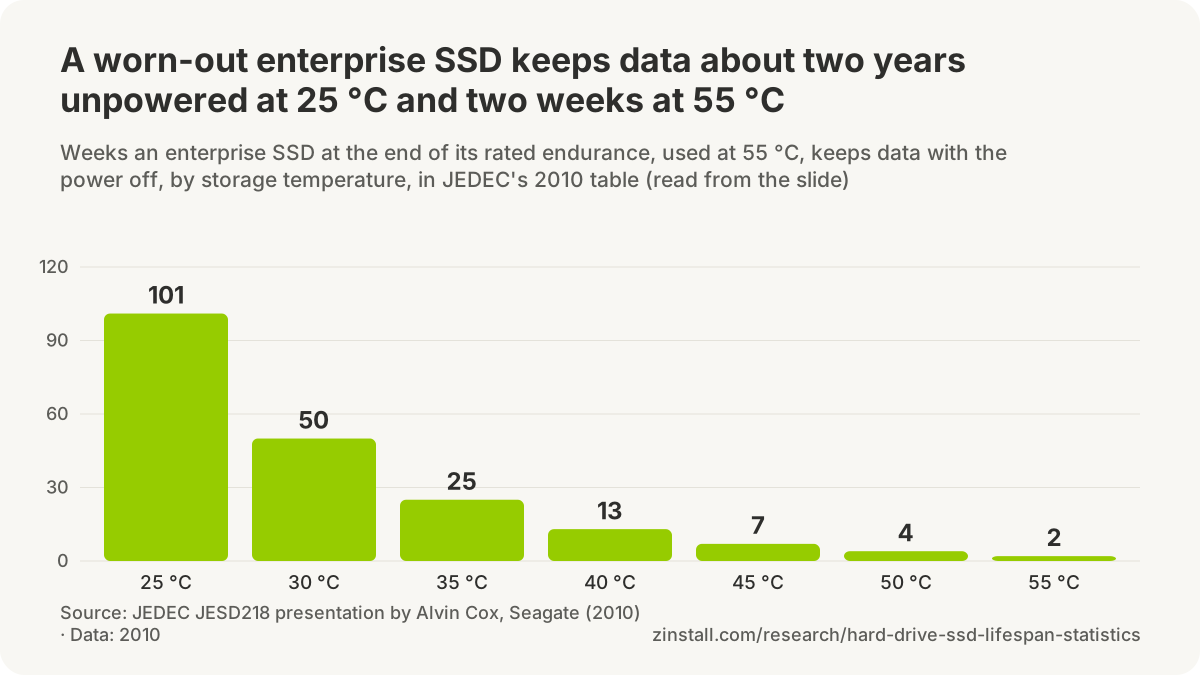
- JEDEC's JESD218 requires a client (consumer PC) SSD that has used up its rated endurance to keep data for 1 year with the power off, stored at 30 °C (JEDEC, 2010).
- JEDEC's JESD218 requires an enterprise (data-centre) SSD that has used up its rated endurance to keep data for 3 months with the power off, stored at 40 °C (JEDEC, 2010).
What makers say
- Crucial says a brand-new SSD keeps data unpowered for several years, a period that shortens as the flash wears with writing (Crucial, 2026).
- Dell recommends powering up enterprise SSDs and NVMe drives that hold data once every 2.5 months, for at least 3 weeks, so their firmware can refresh the stored charge (Dell, 2026).
- Western Digital says that once an SSD has used up its rated endurance there is no longer any expectation that it will keep data for a specific time, and it should not be trusted with important data (Western Digital, 2023).
Tests of unpowered SSDs
- 3D TLC flash is typically specified for 1,500 to 3,000 program/erase cycles, after which it must still hold data for at least one year unpowered at up to 40 °C, c't reported (c't, 2021).
- After one year unpowered, a worn and a fresh 128 GB SATA SSD in YouTuber HTWingNut's hobbyist test read back about 100 GB of files at 495 and 456 MB/s, with no performance degradation by the tester's judgement (HTWingNut, 2023).
Numbers in circulation
- After two years unpowered, the worn SSD in HTWingNut's hobbyist test had 4 corrupt files and read 4 times slower, while the fresh drive's data all verified, as Tom's Hardware reported the video (Tom's Hardware, 2025).
Sources: JEDEC Solid State Technology Association; Crucial; Dell Technologies; Western Digital; heise online / c't magazin; HTWingNut; Tom's Hardware
Which firmware bugs and defects have killed drives?
Some SAS SSDs would fail at exactly 32,768 hours of operation unless their firmware was updated (HPE, 2019).

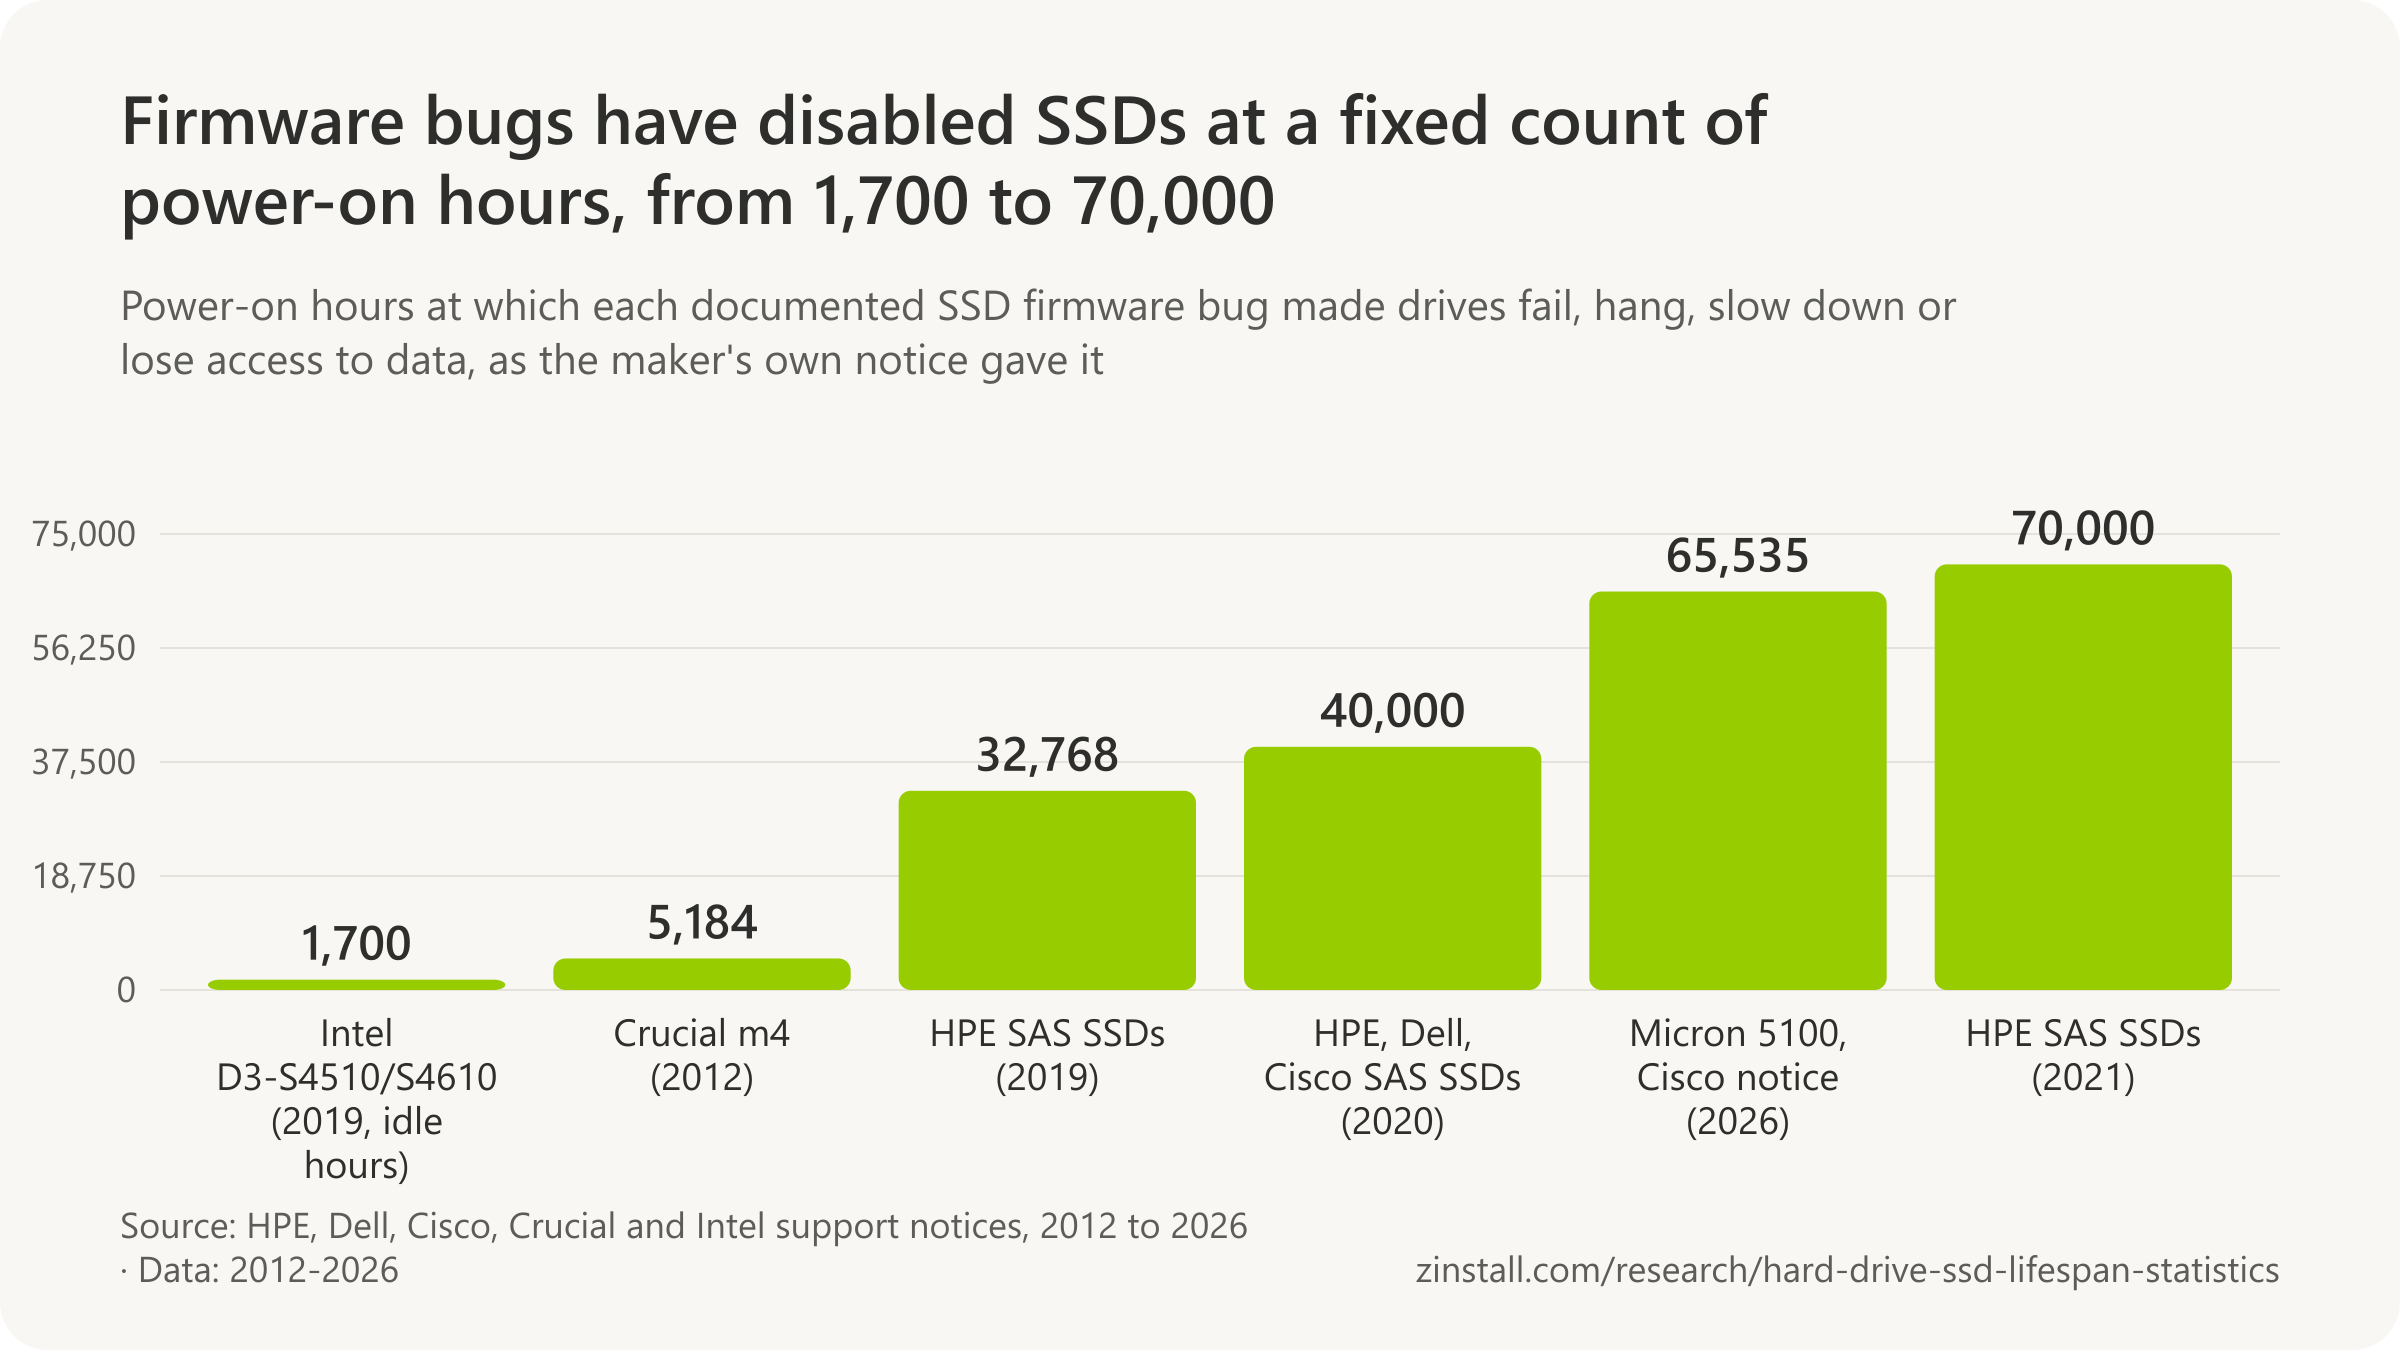
- 145,000 SanDisk and WD portable SSDs were potentially hit by a 2022-2023 firmware defect, by the maker's estimate.
- Western Digital paid at most $2.7 million to settle the class action over shingled WD Red NAS drives.
- 46,898 claims were filed in the WD Red settlement.
- Seagate's product manual gave its ST3000DM001 drive a 0.34% annualized failure rate.
- Crucial's m4 SSDs became unresponsive after 5,184 hours of power-on time, about 216 days.
| Event and measure | Figure |
|---|---|
| HPE SAS SSDs: the second bug, 2020 | 40,000 hours |
| HPE SAS SSDs: the third bug, 2021 | 70,000 hours |
| Dell enterprise SAS SSDs | 40,000 hours |
| Micron 5100 SSDs, Cisco notice, 2026 | 65,535 hours |
| Intel D3-S4510 and D3-S4610 SSDs, 2019 | 1,700 hours |
| Seagate ST3000DM001: first-year rate in its own testing, per the plaintiffs' expert | 2.621% |
| IBM Deskstar 75GXP settlement, per failed drive, 2005 | $100 |
| Fujitsu MPG settlement, per drive with lost data, 2003 | Up to $1,200 |
| Phison's tests of the 2025 Windows 11 update reports | over 4,500 hours |
| Lexar USB flash drives recalled for a burn hazard, 2006 | About 66,000 |
Sources: Hewlett Packard Enterprise (2021, 2020, 2019); United States District Court, Northern District of California (2026, 2021, 2018); Crucial; Dell Technologies; Cisco Systems; Microsoft; IBM Deskstar 75GXP Litigation settlement administrator; The Register; Phison Electronics; U.S. Consumer Product Safety Commission
Related guides: A broken or dead computer · Back up your entire computer
More statistics (43)
Some of the most sudden drive failures were not wear at all but bugs in the drive's own firmware. Several SSD lines stopped working at an exact count of power-on hours, so that drives installed together failed together. Defects in consumer drives led to replacement programs and class actions; no hard drive or SSD has been recalled in the US for losing data.
Power-on-hour bugs
- HPE warned that SAS SSDs hit by its 32,768-hour firmware bug could not be recovered, nor their data, and that drives put into service at the same time would likely fail nearly simultaneously, so RAID would not protect them (HPE, 2019).
- 19 HPE SAS SSD models (20 SKUs, 400 GB to 15.3 TB) were listed as affected by the 32,768-hour firmware failure, which HPE said was a comprehensive list (HPE, 2019).
- HPE said its 40,000-hour SSD failure was not unique to HPE and potentially affected other manufacturers' customers who bought the same drives; four HPE SAS SSD models were listed (HPE, 2020).
- Dell listed nine of its enterprise SAS SSD models (LT0200MO to LT0800WM) as failing at 40,000 power-on hours on firmware older than D417, the failed drive reporting 0 GB of available storage (Dell, 2020).
- Cisco attributed the 40,000-power-on-hour SSD failure (about 4.5 years) to an industry-wide firmware index bug, after which the drive reports 0 GB and must be replaced (Cisco, 2020).
- VMware's vSAN knowledge base lists one SSD failure at 32,000 or 40,000 power-on hours across three server makers' firmware (Dell below D417, HPE below HPD7, Cisco below C405), with disk groups going offline and possible data loss (Broadcom, 2025).
Consumer SSDs
- Intel said an SSD 320 Series drive could show a capacity of 8 MB after an unexpected power loss under specific conditions, after which no data on it could be read, and released firmware 4PC10362 to fix it (Intel, 2011).
- Samsung said the abnormal drop in the S.M.A.R.T. health reading of its 990 PRO SSDs was caused by a firmware problem, fixed by firmware 1B2QJXD7 released on 13 February 2023, which did not restore health already lost (Samsung, via ComputerBase, 2023).
- Samsung released firmware 7B2QJXD7 for the 990 PRO in September 2025 to address an intermittent non-recognition and blue screen issue, and 8B2QJXD7 in December 2025 to improve read-operation stability (Samsung, 2025).
- Puget Systems reported abnormally high field failure rates of the Samsung 980 Pro 2 TB SSD in its workstations, the drives suddenly locking into read-only mode, and Samsung confirmed an issue in firmware 3B2QGXA7 fixed by 5B2QGXA7 (Puget Systems, 2023).
- Western Digital said a firmware issue could cause SanDisk Extreme Portable SSD V2, SanDisk Extreme Pro Portable SSD V2 and WD My Passport SSD drives to unexpectedly disconnect from a computer, and released a firmware updater with a serial-number lookup (Western Digital, 2023).
- 145,000 SanDisk Extreme, Extreme Pro and WD My Passport portable SSDs were potentially affected by the 2022-2023 firmware defect, by Western Digital's own estimate, 69,173 of them in the United States (N.D. Cal., 2026).
- About 10% of SanDisk Extreme and Extreme Pro portable SSDs were 'randomly dropping off Mac Systems', as reported to Western Digital by resellers in Asia-Pacific and North America on 20 January 2023 (N.D. Cal., 2026).
- Western Digital stopped shipping only the 4 TB SanDisk Extreme and Extreme Pro portable SSDs on 17 February 2023, issued no recall, and fixed the firmware for unsold drives on 15 March 2023, with a download for owners only in June or July 2023 (N.D. Cal., 2026).
- A federal court certified California and Florida classes of buyers of the defective SanDisk and WD portable SSDs in May 2026, on claims including fraud by omission and breach of implied warranty; the consolidated case filed in August 2023 had no settlement in the record (N.D. Cal., 2026).
- Phison ran more than 4,500 cumulative testing hours and over 2,200 test cycles on the SSDs reported as affected by the August 2025 Windows 11 updates (KB5063878, KB5062660) and could not reproduce the reported failures (Phison, 2025).
- Microsoft said it found no connection between the August 2025 Windows 11 security update (KB5063878) and the SSD and hard drive failures reported on social media, with neither telemetry nor internal testing showing more disk failures or file corruption (Microsoft, via BleepingComputer, 2025).
- Phison said the Windows 11 SSD failures reproduced by the PCDIY! enthusiast group occurred on engineering preview firmware, not the firmware sold to consumers, and that retail drives under the same stress tests (100 GB and 1 TB writes) showed no failures (Phison, via Windows Report, 2025).
- Samsung traced the read-speed slowdown of old data on its 840 EVO SSDs to an error in its NAND management algorithm that caused aggressive read retries, and released a firmware and Performance Restoration tool in October 2014; no data loss resulted (AnandTech, 2014).
- Samsung acknowledged in February 2015 that some 840 EVO owners saw the old-data read slowdown again after its October 2014 fix, and promised an updated Magician tool, a fix it shipped in April 2015 (Samsung, via AnandTech, 2015).
- Western Digital released firmware for 2 TB WD_BLACK SN770, SN770M, WD Blue SN580, SN5000 and SanDisk Extreme M.2 SSDs that could cause a blue screen (BSOD) on Windows 11 24H2 through a Host Memory Buffer issue (Western Digital, via The Register, 2024).
Hard drives
- Western Digital confirmed in April 2020 that its WD Red NAS drives of 2 TB, 3 TB, 4 TB and 6 TB used device-managed shingled magnetic recording (DMSMR), and in June 2020 renamed its conventional (CMR) NAS drives WD Red Plus (Western Digital, 2020).
- Western Digital acknowledged that its SMR WD Red NAS drives can take longer to rebuild a RAID array in some cases, and that ZFS resilvering left them too little idle time, causing significantly lower performance reported by users (Western Digital, 2020).
- $2.7 million was Western Digital's maximum payment under the court-approved settlement of the US class action over SMR WD Red NAS drives bought from October 2018 to July 2021, fees and costs included (N.D. Cal., 2021).
- 46,898 claims were filed in the WD Red SMR class settlement, and the more than 10,000 claims that sought payment for over five drives each added up to more than 1 billion drives, so the court approved proof-of-purchase checks (N.D. Cal., 2021).
- The ST3000DM001 class action complaint alleged that Seagate's published annualized failure rate of less than 1% was false, citing Backblaze's count that 1,423 of 4,829 deployed Seagate 3 TB drives (29.5%) had failed by March 2015; the court let that claim proceed (N.D. Cal., 2017).
- 0.34% was the annualized failure rate an April 2011 Seagate Barracuda product manual gave for the ST3000DM001, and other Seagate documents gave less than 1%, according to the evidence described by the court (N.D. Cal., 2018).
- 2.621% was the actual first-year annualized failure rate on Seagate's October 2011 shipping approval for ST3000DM001 drives sold through OEM and distribution channels, according to the plaintiffs' expert as described by the court (N.D. Cal., 2018).
- 3.436% was the first-year annualized failure rate in Seagate's June 2012 post-release testing of the ST3000DM001 (Grenada Classic), against the under-1% rate it advertised, according to the plaintiffs' expert as described by the court (N.D. Cal., 2018).
- 1.29% was the actual field failure rate of one Seagate drive product (codenamed Pharaoh) over two years, against 1.24% predicted by testing, by a Seagate chart the plaintiffs' expert cited; the court called the gap 'around twelve percent', though the two rates differ by about 4% (N.D. Cal., 2018).
- 2,400 power-on hours a year (about 6.5 hours a day) was the use Seagate assumed in calculating reliability ratings for desktop drives such as the ST3000DM001, and 730 hours (two hours a day) for external drives, according to the experts as described by the court (N.D. Cal., 2018).
- The US class action over Seagate's ST3000DM001 3 TB drive ended without a class or a class settlement: the court denied class certification in July 2018 and again in January 2019, and the plaintiffs dismissed the case with prejudice in May 2019, each side bearing its own costs (N.D. Cal., 2019).
- Apple set up a worldwide program to replace, free of charge, a very small number of Seagate 1 TB hard drives in 21.5-inch and 27-inch iMacs sold between May and July 2011 that may fail under certain conditions (Apple, 2011).
- Seagate said a firmware issue in a limited number of Barracuda 7200.11 hard drives and related SATA drives made through December 2008 could, in some circumstances, make the data inaccessible when the computer was powered on, and offered a free firmware upgrade (Seagate, via MacTech, 2009).
- Seagate still lists firmware SD1A for eight Barracuda 7200.11 models (ST3500320AS to ST31000340AS), replacing firmware AD14, SD15 to SD19 and SD81, the update issued for the 2009 defect (Seagate, 2026).
- $100 per failed drive was offered in the 2005 US class settlement over IBM's Deskstar 75GXP hard drives, whose failures were documented in IBM's support or returns records; owners whose drives had not failed could choose 25 blank CD-ROMs or a 15% IBM discount (settlement notice, 2005).
- $42.5 million was the proposed settlement pool in the California class action over Fujitsu's MPG3xxx desktop hard drives, paying $45 per drive replaced and up to $1,200 per drive for lost data, with Fujitsu admitting no liability (The Register, 2003).
- Up to $1,200 per hard drive was offered for proven data loss in the proposed settlement over Fujitsu's failing MPG3xxx drives, against $45 per drive for replacement costs (The Register, 2003).
Recalls and replacement programs
- About 60,000 power supply units for Iomega external Jaz disk drives were recalled in the US in 1999 because their housing could separate and expose live electronics, a shock hazard (CPSC, 1999).
- About 66,000 Lexar JumpDrive FireFly and 1 GB Secure II USB flash drives were recalled in the US in 2006 because they could overheat, a burn and property-damage risk (CPSC, 2006).
- No hard drive or SSD has been recalled in the US for failing or losing data, as far as CPSC's recall database shows: the five storage-related recalls found (1999 to 2009) were for power adapters, power supplies or flash drives that could overheat or shock (CPSC, 1999-2009).
- Apple set up a program to replace, free of charge, a very small number of 3 TB hard drives in 27-inch iMacs sold between December 2012 and September 2013 that may fail under certain conditions (Apple, 2015).
- Apple said a limited number of 128 GB and 256 GB SSDs in 13-inch MacBook Pro (non Touch Bar) laptops sold between June 2017 and June 2018 had an issue that may result in data loss and failure of the drive, and serviced them free (Apple, 2018).
Sources: Hewlett Packard Enterprise (2019, 2020); Dell Technologies; Cisco Systems; Broadcom; Intel Corporation, archived by Solidigm; ComputerBase; Samsung Semiconductor; Puget Systems; Western Digital (2020, 2023); United States District Court, Northern District of California (2017-2026); Phison Electronics; BleepingComputer; Windows Report; AnandTech, reporting Samsung's disclosure; AnandTech, quoting Samsung's statement; The Register (2003, 2024); Apple (2011, 2015, 2018); MacTech; Seagate Technology; IBM Deskstar 75GXP Litigation settlement administrator; U.S. Consumer Product Safety Commission (1999, 2006, 2009)
How much does data recovery cost when a drive fails?
Professional recovery of one hard drive can cost $300 to over $3,000 (SalvageData, 2026).

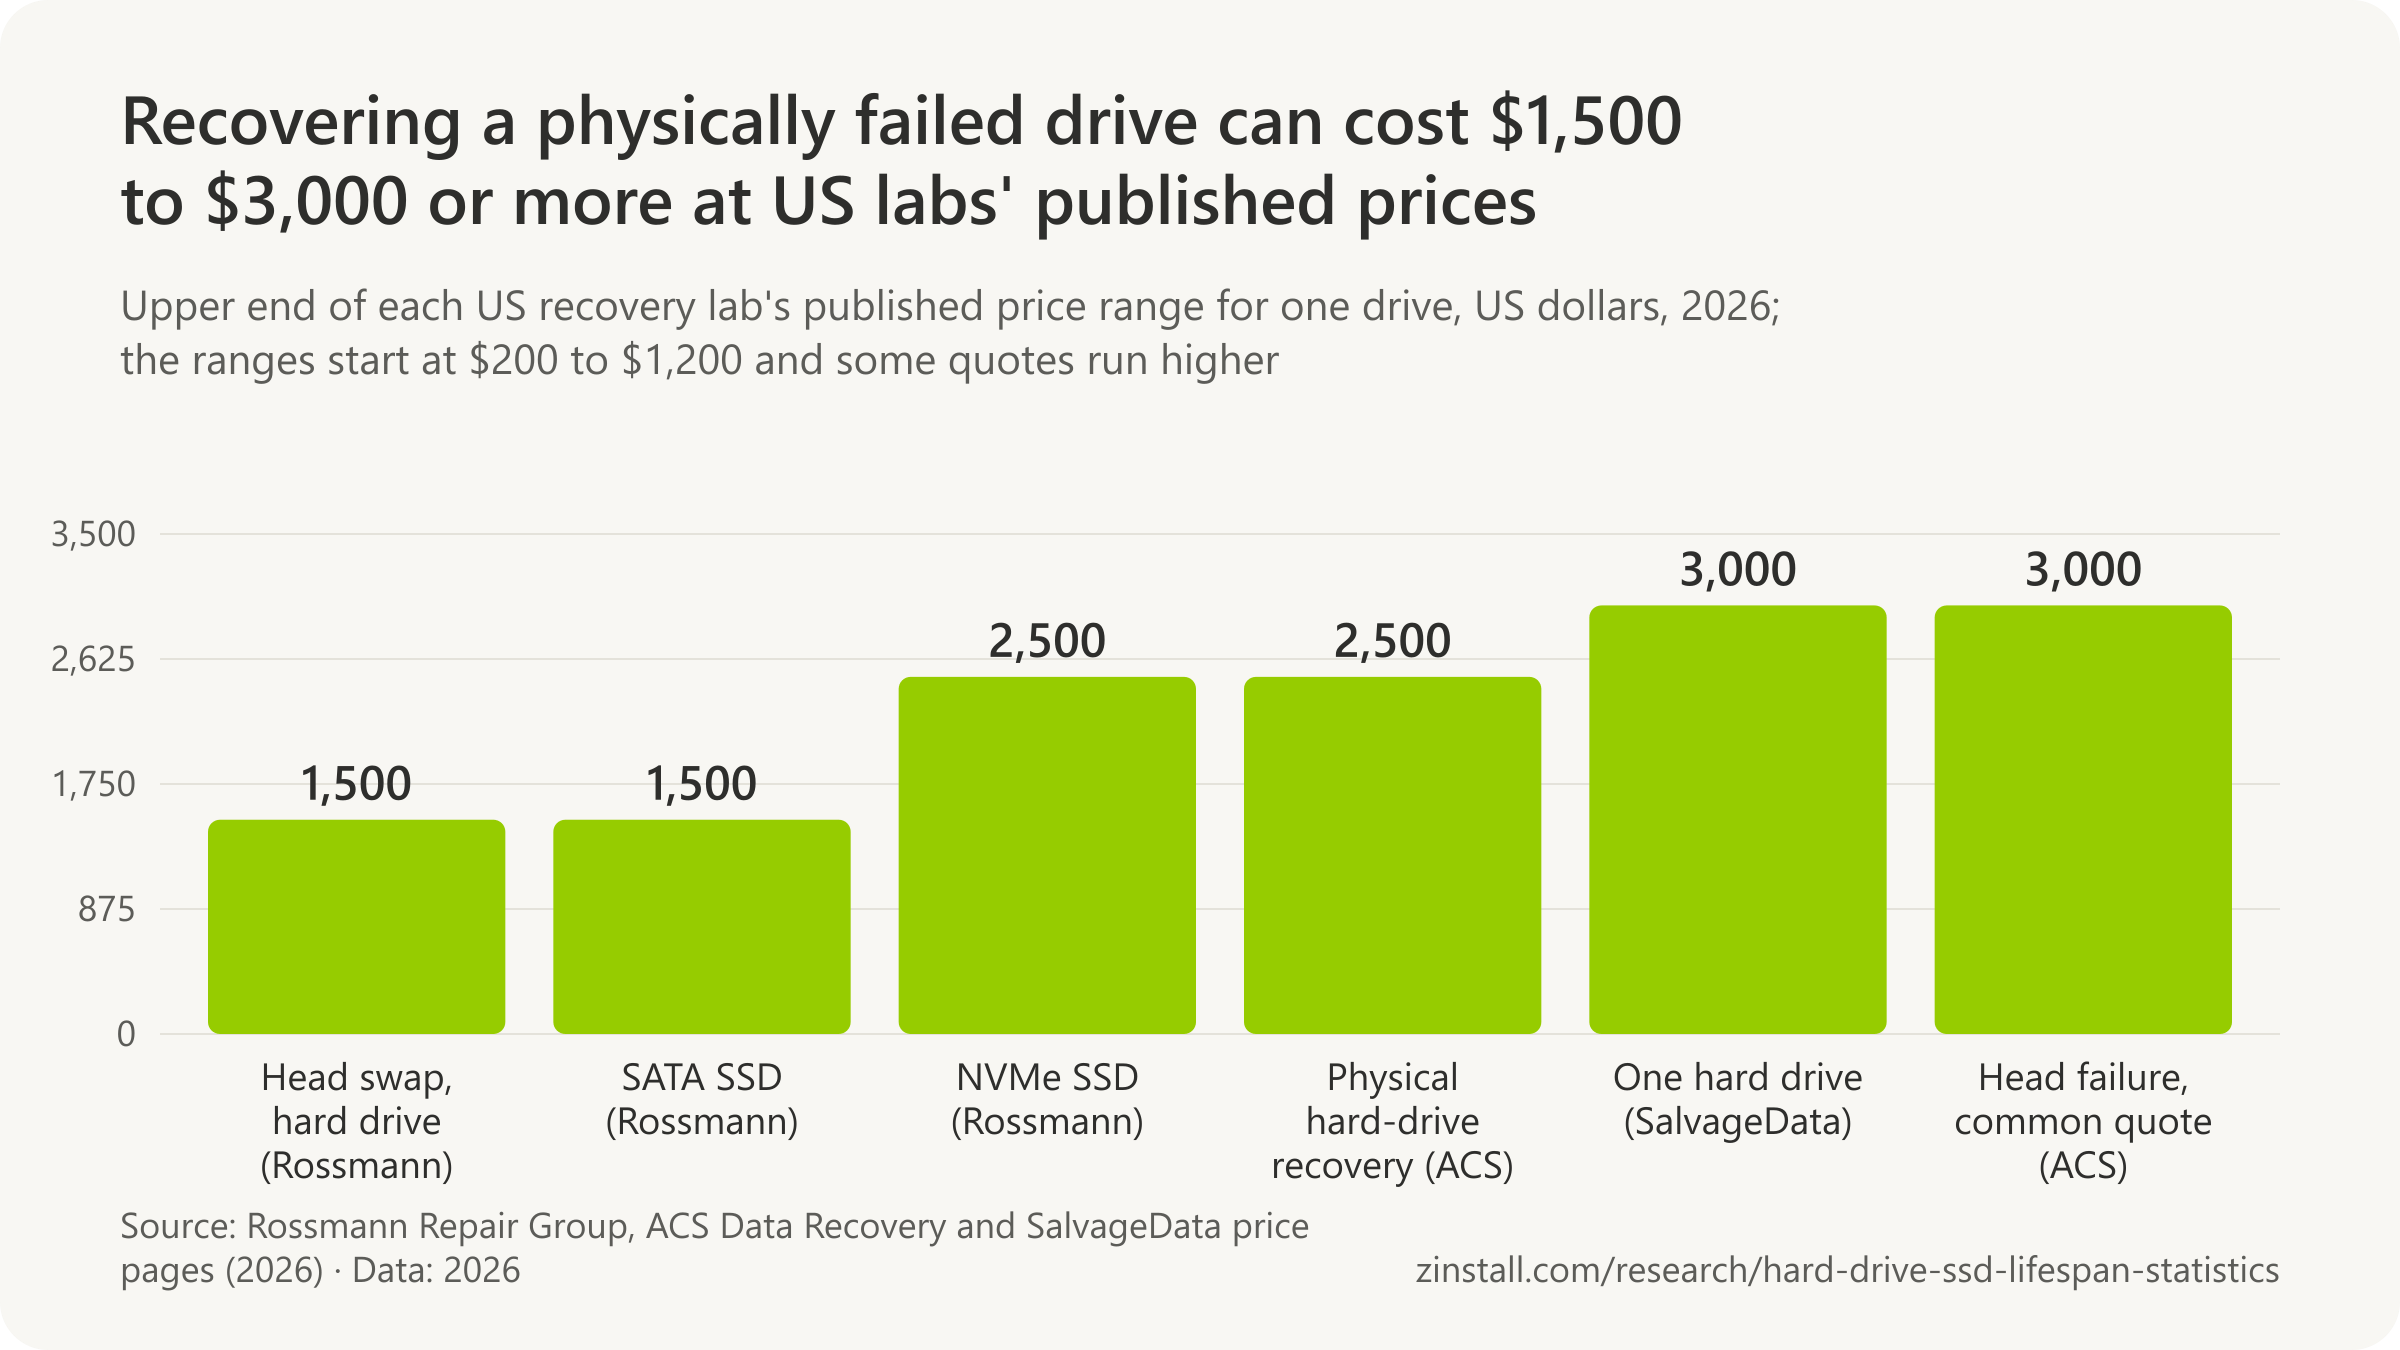
- Labs typically charge $100 to $300 an hour for data recovery.
- A head-swap recovery on a standard hard drive is listed at $1,200 to $1,500, plus a donor drive.
- 0% of the hard drives with a severe head crash could be recovered at one Australian lab.
- 51% of Americans had lost photos, films or other files to a computer or hard-drive failure.
- About 72,100 drives were sent for data recovery in Japan in 2024, by the industry association's estimate.
| Source and measure | Figure |
|---|---|
| ACS: physical hard-drive recovery | $900 to $2,500+ |
| ACS: a common quote for a head failure now | $3,000+ |
| Rossmann: SATA and NVMe SSD recovery | $200 to $2,500 |
| Secure Data Recovery: its claimed success rate (no published definition) | 96% |
| Recovery labs: unrecoverable cases lost to physical damage | 20.7% |
| Ontrack customers who had had an SSD fail, 2016 | 38% |
| Kroll Ontrack survey: lost data after an SSD malfunction, 2015 | 61% |
| US adults who have lost data from any cause, 2025 | 70.7% |
| Data-loss incidents caused by hardware failure, 2025 | 30% |
| Kroll Ontrack customers blaming a hardware failure, 2014 | 66% |
Sources: SalvageData Recovery Services; Secure Data Recovery Services (2026, 2024); Rossmann Repair Group; Payam Data Recovery; Deloitte; Data Recovery Association of Japan; ACS Data Recovery; DeepSpar Data Recovery Systems; Ontrack; Kroll Ontrack (2015, 2014); Handy Recovery Advisor
Related guides: A broken or dead computer · A hard drive with bad sectors
More statistics (20)
Recovering data from a drive that has failed physically means a clean-room repair, and US labs publish prices from a few hundred dollars for a simple job to several thousand for failed heads or an NVMe SSD. Success is not guaranteed: severe platter damage can make data unrecoverable. Surveys find that around half of people have lost files to a computer or drive failure at some point.
Prices
- 5.7 hours was the average recovery time for a physically damaged hard drive at Secure Data Recovery, against 3.4 hours for a software (logical) issue, and 7.4 against 4.1 hours for SSDs, by the firm's own count (Secure Data Recovery, 2024).
- Professional data recovery typically costs $100 to $300 an hour, according to Secure Data Recovery, a US recovery firm (Secure Data Recovery, 2024).
Success and failure
- 0% of the hard drives with a severe head crash (platter damage) could be recovered at Payam Data Recovery, while head failures and bad-sector failures had a high success rate, among about 30,000 drives seen from 2020 to 2025 (Payam Data Recovery, 2025).
- 20.7% of the unrecoverable cases at 55 recovery companies were lost to irreparable physical damage such as scratched platters, and 13.3% to earlier amateur recovery attempts (DeepSpar survey, 2007-2010).
- Secure Data Recovery claims a 96% success rate for its recovery services, its own marketing figure without a published definition (Secure Data Recovery, 2026).
How many drives go for recovery

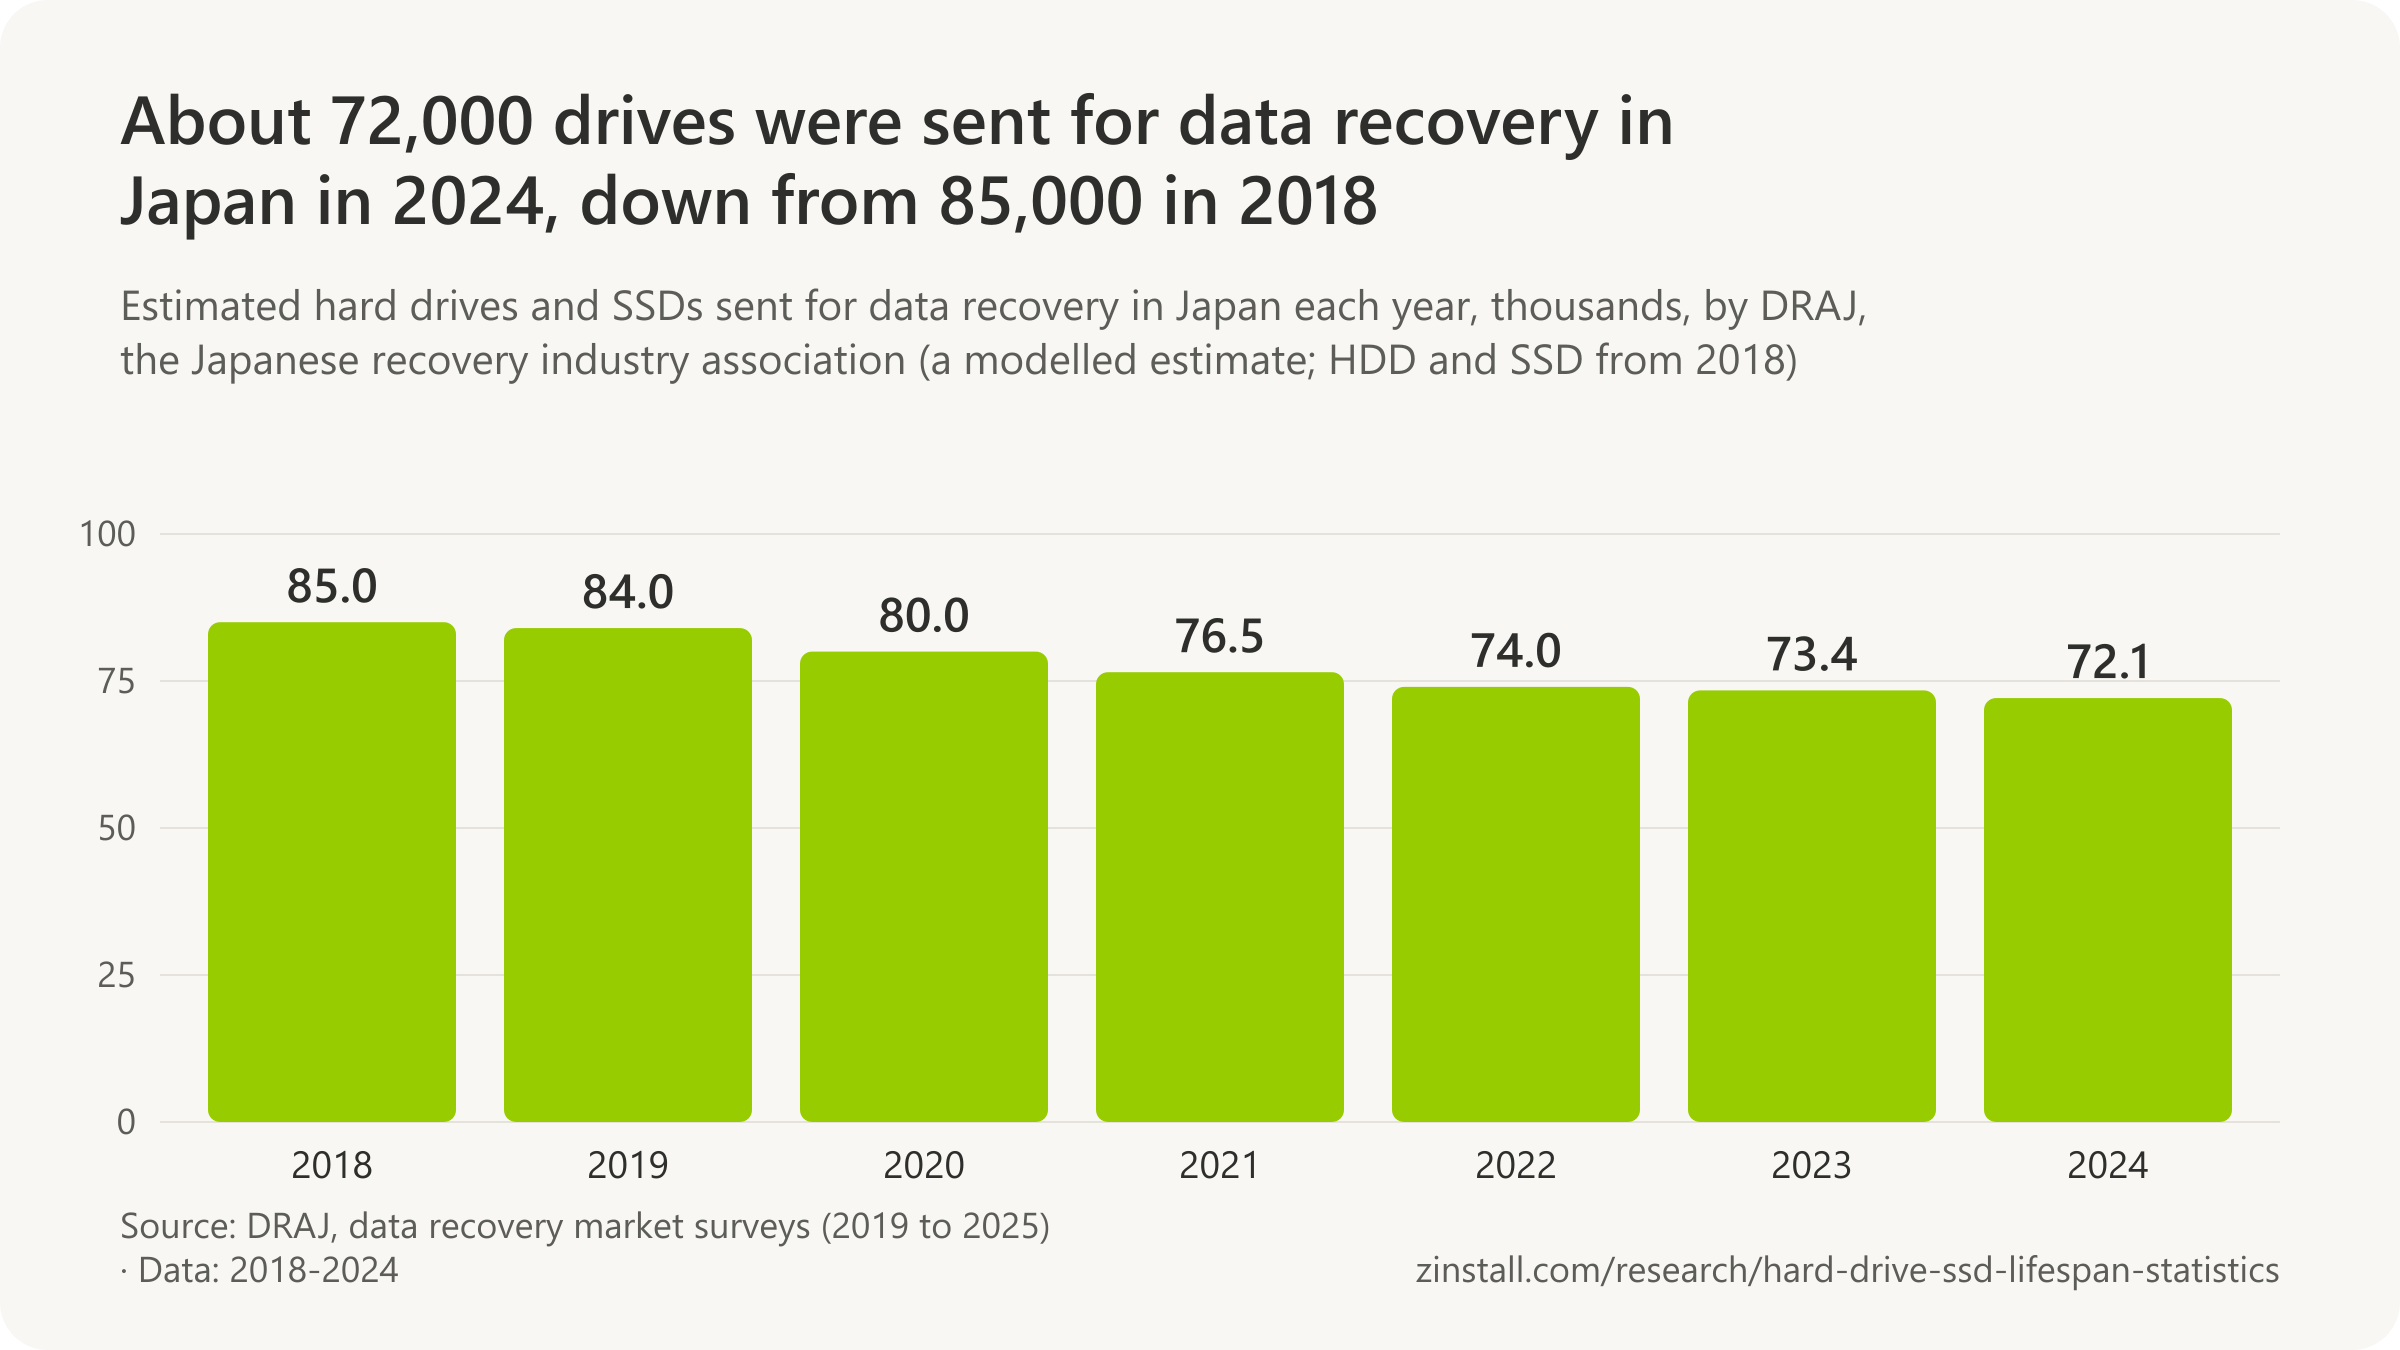
- 78% of the data-recovery requests Ontrack received in 2020 were for ageing or physically damaged hard drives, against 3% for SSDs and 10% for mobile devices, by the firm's own count (Ontrack, 2021).
- 85,700 drives were sent for professional data recovery in Japan in 2015, DRAJ (the Data Recovery Association of Japan) estimated (DRAJ, 2016).
- 79,600 drives were sent for professional data recovery in Japan in 2016, DRAJ (the Data Recovery Association of Japan) estimated (DRAJ, 2018).
- 87,500 drives were sent for professional data recovery in Japan in 2017, DRAJ (the Data Recovery Association of Japan) estimated (DRAJ, 2019).
- SSD recovery requests at Kroll Ontrack more than doubled each year on average from 2011 to 2014, by the firm's own count (Kroll Ontrack, 2015).
People who lost data to a failed drive
- 30% of the 496,142 data-loss scenarios EaseUS recorded among users of its recovery software stemmed from physical damage to hardware, and about 40% from logical errors (EaseUS, 2024).
- 38% of the data-loss cases that 55 recovery companies in 15 countries received began with a hard drive that did not respond at all, and 29.9% with read instability, against 12.8% from software and 12.1% from user error (DeepSpar survey, 2007-2010).
- 66% of Kroll Ontrack's recent data-recovery customers blamed a hardware crash or failure for their most recent data loss, up from 29% in 2010, among 1,066 surveyed (Kroll Ontrack, 2014).
- 72% of Kroll Ontrack's recent data-recovery customers said their most recent data loss came from a desktop or laptop hard drive, against 15% from an SSD and 13% from RAID or virtual systems, among 1,066 surveyed (Kroll Ontrack, 2014).
- 61% of the respondents to Kroll Ontrack's 2015 SSD survey who had had an SSD malfunction (one third of nearly 2,000) lost data, and fewer than 20% recovered it (Kroll Ontrack, 2015).
- 38% of 1,849 Ontrack data-recovery customers surveyed in May 2016 had had an SSD fail, and 64% of those lost data (Ontrack, 2016).
- 30% of data-loss incidents were caused by hardware failure and 34% by accidental deletion, according to 1,000 US adults surveyed by Handy Recovery Advisor in June 2025 (Handy Recovery Advisor, 2025).
- 70.7% of 1,000 US adults surveyed by Handy Recovery Advisor in June 2025 said they had lost data at least once, from any cause (Handy Recovery Advisor, 2025).
- 51% of Americans had experienced a computer or hard drive failure that caused them to lose photos, movies or other digital content, among nearly 2,000 consumers aged 14 to 75 surveyed for Deloitte in 2010 (Deloitte, 2011).
- 65% of the Australians in Kroll Ontrack's 2014 customer survey said their most recent data loss came from a desktop or laptop hard drive, against 16% from an SSD and 12% from a tablet or smartphone (Kroll Ontrack, 2014).
Sources: Secure Data Recovery Services (2024, 2026); Payam Data Recovery; DeepSpar Data Recovery Systems; Ontrack (2014, 2016, 2021); Data Recovery Association of Japan (2016-2025); Kroll Ontrack (2014, 2015); EaseUS Software; Handy Recovery Advisor; Deloitte
How long do USB flash drives, SD cards, CDs, DVDs and tape last?
10% of pressed CDs were estimated to fail in under 25 years in accelerated-ageing tests (Library of Congress, 2009).

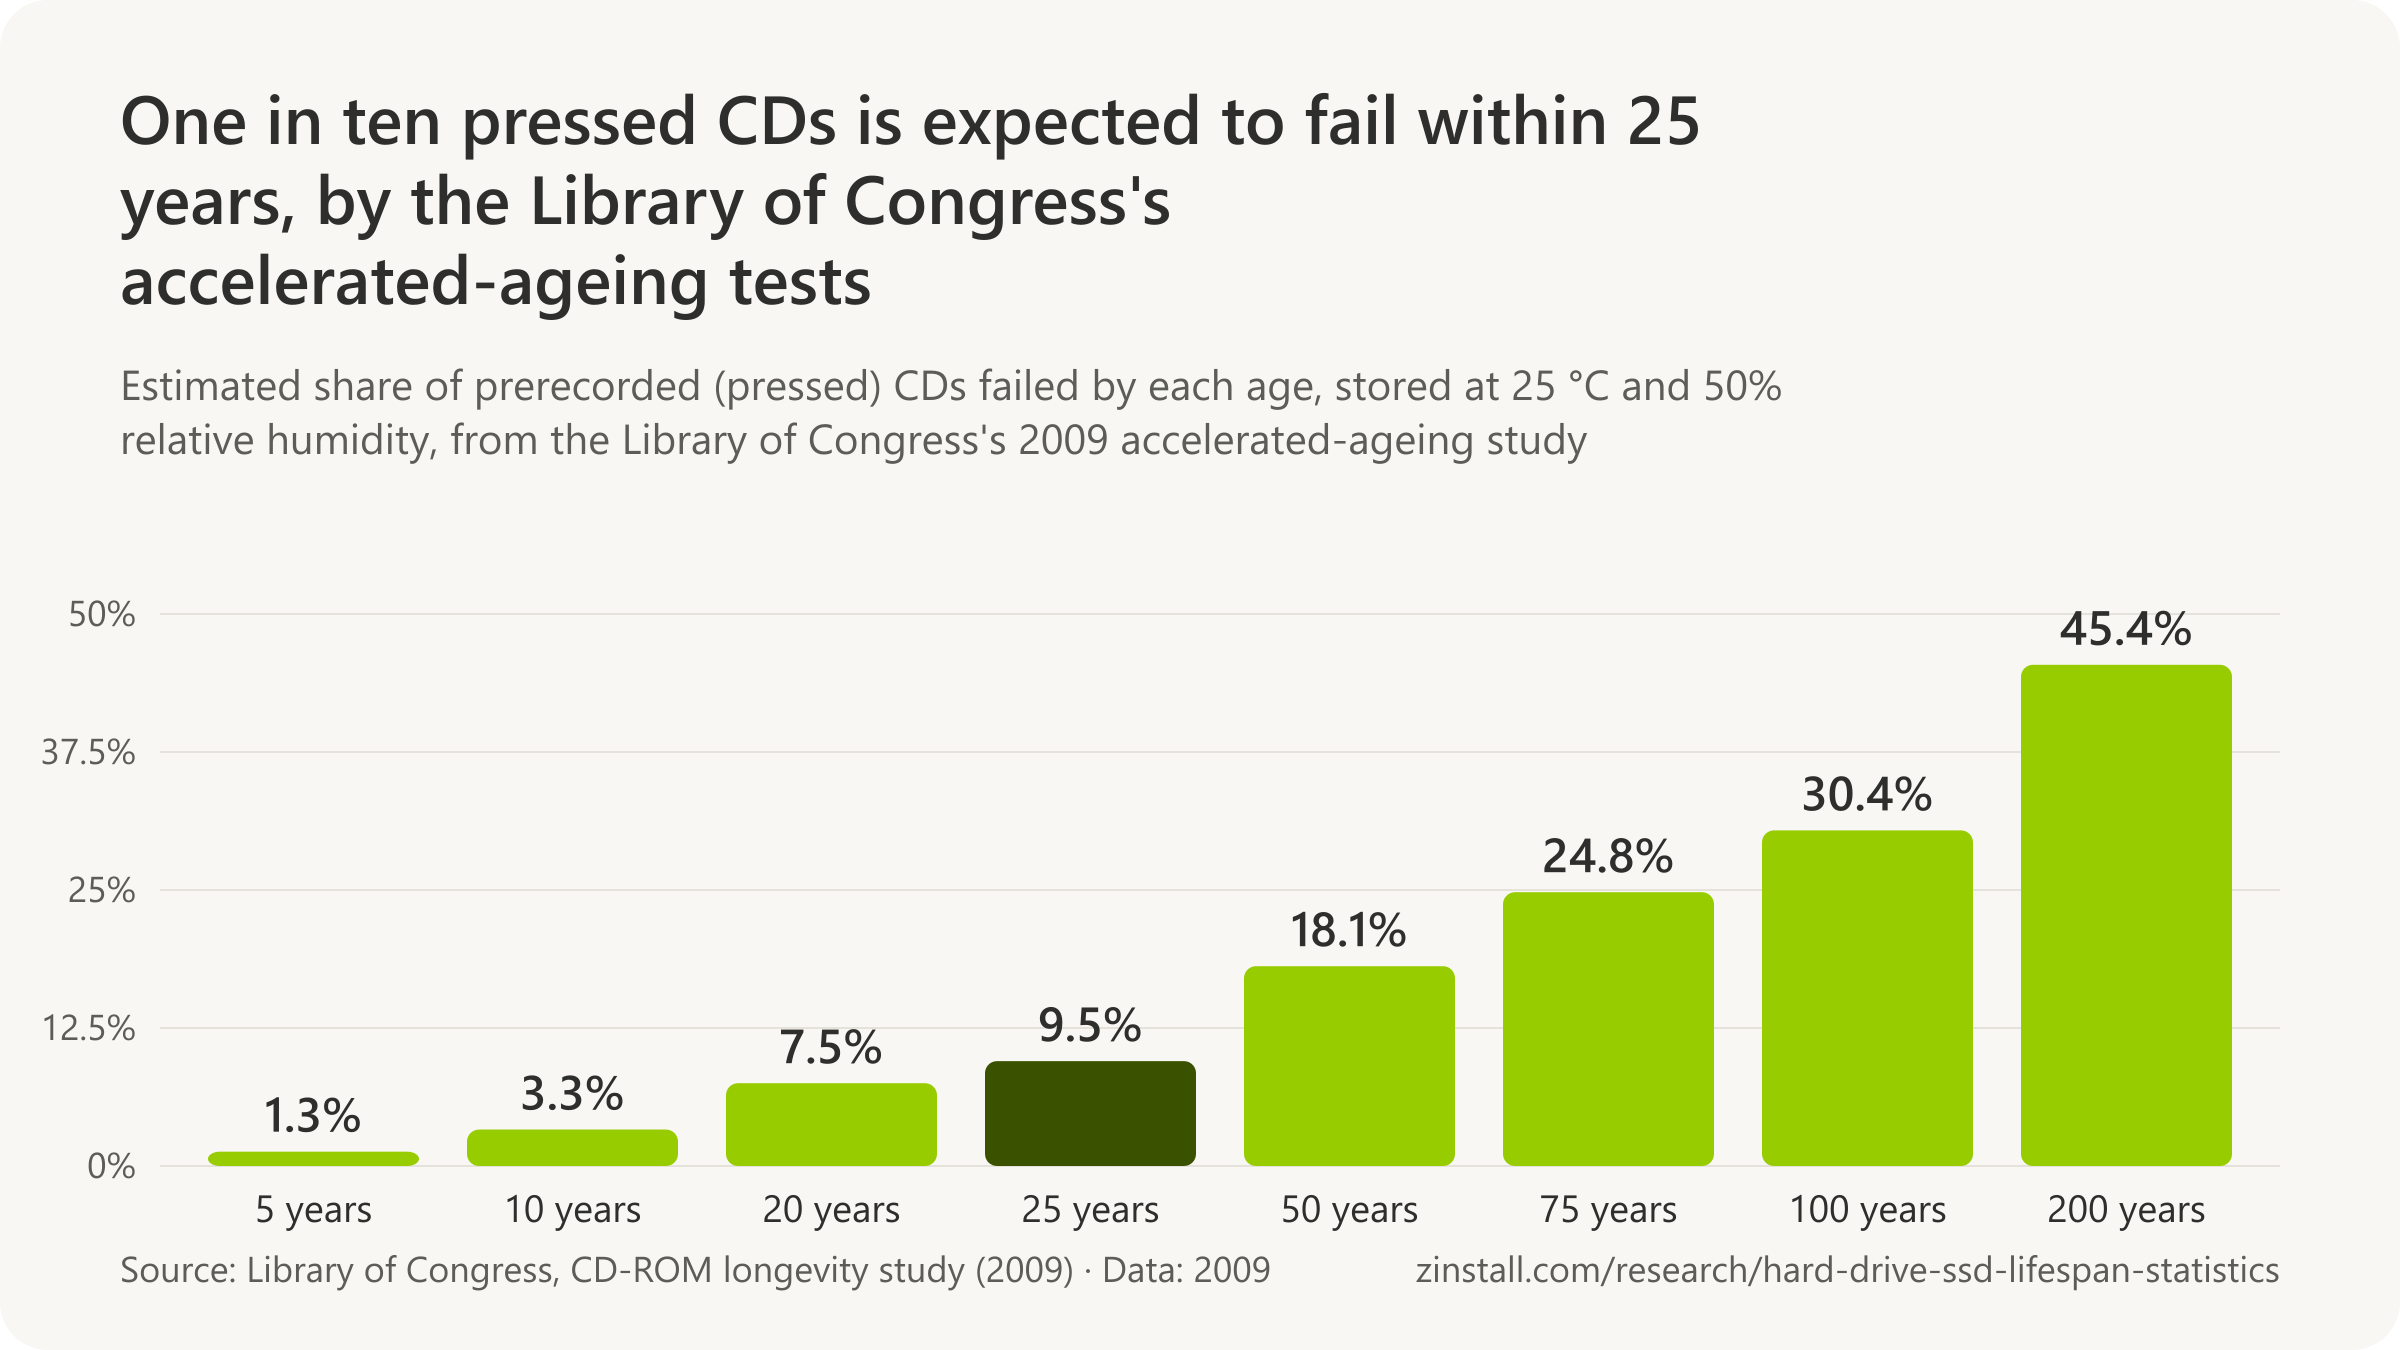
- Recordable Blu-ray discs share the lowest longevity rating of any disc, 5 to 10 years, with dual-layer DVD+R.
- M-DISC DVDs lasted under 250 hours in France's national lab's heat and humidity test, no better than ordinary DVDs.
- One microSD card is rated for 140,160 hours of recording, 16 years, but warranted for 5.
- LTO data tape can protect data for up to 30 years, by the format's backers.
- Archivists advise making new copies of digital files on fresh media at least every five years.
| Disc type | Average longevity |
|---|---|
| CD-R, phthalocyanine dye, gold layer | over 100 years |
| CD-R, phthalocyanine dye, silver alloy layer | 50 to 100 years |
| CD-R, cyanine or azo dye, silver alloy layer | 20 to 50 years |
| Read-only CD (audio CD, CD-ROM) | 50 to 100 years |
| DVD-R, gold layer | 50 to 100 years |
| DVD-R, silver alloy layer | 10 to 20 years |
| DVD+R, silver alloy layer | 20 to 50 years |
| DVD+R DL (dual layer) | 5 to 10 years |
| Read-only DVD or Blu-ray (movie discs) | 10 to 20 years |
| Rewritable CD-RW, DVD+RW, BD-RE | 20 to 50 years |
Sources: Library of Congress, Preservation Research and Testing Division; Canadian Conservation Institute; Laboratoire national de métrologie et d'essais; Samsung Electronics; LTO Program; Library of Congress
Related guides: Back up your entire computer · Transfer with a USB drive
More statistics (69)
Pressed CDs held up best in the Library of Congress's tests, and recordable discs varied by dye and metal far more than by brand; recordable Blu-ray shares the lowest rating of any disc with dual-layer DVD+R. Memory cards and USB sticks come with endurance ratings and warranties but no published failure rates. Tape makers rate their cartridges for decades, and cloud providers publish design targets for durability. Archivists' advice is the same for every medium: make new copies every five to ten years.
CDs and DVDs
- 100 to 200 years or more is the life expectancy disc makers agreed on for recorded CD-R, DVD-R and DVD+R discs under recommended storage, a manufacturers' claim from accelerated aging with few independent tests behind it (NIST, 2003).
- 25 years or more is the life expectancy disc makers claimed for rewritable CD-RW, DVD-RW, DVD+RW and DVD-RAM discs, against 100 to 200 years for write-once discs (NIST, 2003).
- 20 to 100 years was the range of life expectations for pressed CD-ROM and DVD-ROM discs (audio, video, software), with little information published on them (NIST, 2003).
- 5 to 10 years is the shelf life before recording that makers claimed for blank CD-R and DVD-R discs, a claim NIST found no published tests to verify (NIST, 2003).
- About 1,000 erase-and-rewrite cycles is the limit for rewritable CDs and DVDs, and about 100,000 for DVD-RAM discs, with each rewrite shortening the disc's life (NIST, 2003).
- A few weeks of direct sunlight can be enough to make a recordable CD or DVD fail, depending on the disc and the light's intensity, in NIST's stress tests of commercial discs (NIST, 2004).
- 5 of the 7 CD-R products tested had an estimated life expectancy of more than 45 years at 25 °C and 50% relative humidity, and the other two 30 to 45 years, in the NIST and Library of Congress accelerated aging study of discs bought in 2005 (NIST and Library of Congress, 2007).
- 7 of the 15 recordable and rewritable DVD products tested had an estimated life expectancy of more than 45 years at 25 °C and 50% relative humidity, and 4 more 30 to 45 years (NIST and Library of Congress, 2007).
- 4 of the 15 DVD products tested were estimated to last less than 30 years at 25 °C and 50% relative humidity, 2 of them less than 15 years, against none of the CD-R products (NIST and Library of Congress, 2007).
- 776 years was the estimated mean life of prerecorded CDs stored at 25 °C and 50% relative humidity in the Library of Congress's accelerated aging study, although 10% of the discs were estimated to fail in under 25 years (Library of Congress, 2009).
- 10% of the prerecorded CDs tested were estimated to fail in less than 25 years, including 5% that failed too early to estimate, while 16% showed too little error growth to fail at all under the test (Library of Congress, 2009).
- Storing CDs at 7 °C and 35% relative humidity could make them last 17 times longer than at 25 °C and 50%, and one degree cooler alone adds 18% to the mean life, by the Library of Congress's model of its disc test (Library of Congress, 2009).
- 4% of 125 audio CDs from the Library of Congress collection had exceeded the ISO error limit after 15 years of natural aging at room conditions, tracked by periodic testing from 1996 (Library of Congress, 2015).
- 2 to 5 years is the experiential life expectancy of a CD or DVD by the US National Archives' guidance for agencies storing temporary records, even though published life expectancies are often cited as 10 or 25 years or longer (NARA, 2007).
- 15 to 200 years is the lifespan optical-media makers claimed from accelerated aging experiments, with longer spans for recorded discs than blank ones, the US National Archives told records managers (NARA, 2007).
- 70 to over 200 years is the CD-R lifetime makers' own longevity studies claimed, the Optical Storage Technology Association (the disc industry's trade body) said (OSTA, 2001).
- 5 to 10 years is the shelf life of a blank CD-R before recording by the media makers' estimate, as the disc industry's trade body put it (OSTA, 2001).
- Many Blu-ray discs, recordable, erasable and read-only movie discs, were significantly degraded after only 21 days at 80 °C and 85% relative humidity, ranking Blu-ray very low for stability among optical formats (Canadian Conservation Institute, 2018).
| Disc type | Average longevity |
|---|---|
| CD-R, phthalocyanine dye, gold layer | over 100 years |
| CD-R, phthalocyanine dye, silver alloy layer | 50 to 100 years |
| CD-R, cyanine or azo dye, silver alloy layer | 20 to 50 years |
| Read-only CD (audio CD, CD-ROM) | 50 to 100 years |
| DVD-R, gold layer | 50 to 100 years |
| DVD-R, silver alloy layer | 10 to 20 years |
| DVD+R, silver alloy layer | 20 to 50 years |
| DVD+R DL (dual layer) | 5 to 10 years |
| Read-only DVD or Blu-ray (movie discs) | 10 to 20 years |
| BD-R, dye or non-dye (recordable Blu-ray) | 5 to 10 years |
| BD-R, non-dye, gold layer | 10 to 20 years |
| Rewritable CD-RW, DVD+RW, BD-RE | 20 to 50 years |
- From a couple of years to more than 200 years is how long recordable optical discs can last, by the research, anecdotes and makers' literature the Canadian Conservation Institute reviewed, which is why libraries and archives distrust them (Canadian Conservation Institute, 2019).
- 2 to 10 years is how soon recordable discs may fail if they are badly chosen, recorded, handled or stored, the Canadian Conservation Institute warns (Canadian Conservation Institute, 2019).
M-DISC
- 1,332 years is the expected average lifetime Millenniata calculated for its M-DISC DVD stored at 25 °C and 50% relative humidity, from its own ISO/IEC 10995 accelerated aging test (Millenniata, 2013).
- M-DISC DVD+R discs lasted less than 250 hours at 90 °C and 85% relative humidity in France's national testing laboratory, no longer than ordinary recordable DVDs, while a glass DVD survived 1,000 hours unchanged (LNE, 2012).
- Only 1 of 7 disc models, a DVD engraved in glass, survived 1,000 hours at 90 °C and 85% relative humidity, more than four times longer than the best recordable DVD (LNE, 2012).
Memory cards and USB flash drives
- Samsung rates its 256 GB PRO Endurance microSD card for up to 140,160 hours (16 years) of continuous Full HD recording, but its limited warranty covers 5 years (Samsung, 2022).
- About 1,640 TB of video, roughly 6,400 complete overwrites of the card, is what Samsung's 140,160-hour rating for the 256 GB PRO Endurance card implies at its stated 3.25 MB/s recording rate (derived from Samsung, 2022).
- SanDisk rates its 256 GB MAX ENDURANCE microSD card for up to 120,000 hours (over 13 years) of Full HD recording, with a 15-year limited warranty, against 15,000 hours and 3 years for the 32 GB card (SanDisk, 2026).
- SanDisk rates its HIGH ENDURANCE microSD cards for 2,500 hours (32 GB) to 40,000 hours (512 GB) of Full HD recording, all with a 2-year limited warranty (SanDisk, 2026).
- Kingston rates its High Endurance microSD card for 3,000 program/erase cycles and 26,900 hours of 24/7 recording, which its 3-year warranty covers (Kingston, 2026).
- Kingston rates its Industrial microSD card, which runs TLC flash in single-bit pSLC mode, for 30,000 program/erase cycles and up to 3,840 TB written, ten times the cycles of its High Endurance card, with a 3-year warranty (Kingston, 2026).
- Lexar rates its High-Endurance microSD card for up to 12,000 hours of Full HD recording at 128 GB (3,000 hours at 32 GB), with a 2-year limited warranty (Lexar, 2026).
- 10 years is the limited warranty on Samsung's PRO Plus microSD card, but it does not extend to dashcams, CCTV, surveillance cameras or other write-intensive uses, which Samsung's 5-year PRO Endurance line is sold for (Samsung, 2026).
- SanDisk sells its Extreme microSD cards with a lifetime limited warranty on every capacity, against 2 years for its HIGH ENDURANCE cards built for continuous recording (SanDisk, 2026).
- 5 years is the warranty Kingston gives its DataTraveler USB flash drives, while its SD and microSD cards are covered for the product lifetime, which it defines as the normal time expectancy for such products, 10 years in Russia (Kingston, 2024).
- 5 years is the limited warranty on SanDisk's Ultra USB 3.0 flash drive, the same term Kingston gives its DataTraveler drives (SanDisk, 2026).
- The median microSD card failed completely after 3,616 full write-and-verify cycles (average 5,362) among 119 cards a hobbyist tester wrote to death, a torture test rather than everyday use (Matt Cole, 2025).
- 84 of 119 microSD cards (71%) that failed in a hobbyist's write-to-death test stopped working or locked themselves read-only before even half their sectors went bad, so cards tend to die suddenly rather than wear out gradually (Matt Cole, 2025).
Tape
- About 100 years at room temperature (20 to 25 °C) would pass before playable polyester audio tapes reach the condition of unplayable ones, against the 10 to 30 year life expectancy in older guidance, in a Library of Congress and Fujifilm accelerated aging study (CLIR, 2022).
- About 30 years is how long audio tapes in good condition may stay playable in hot uncontrolled storage such as attics or old warehouses (40 °C), against about 100 years at room temperature (CLIR, 2022).
- Up to 30 years is how long LTO data tape can protect data, the LTO Program (the format's backers HPE, IBM and Quantum) states, a maker's claim rather than a measured lifespan (LTO Program, 2025).
- 1 uncorrectable read error per 12.5 exabytes read (10^20 bits) is the end-of-life specification for LTO-9 tape, a design figure the LTO Program sets against 10^15 bits for a typical hard drive (LTO Program, 2022).
- Over 50 years is the magnetic lifetime Fujifilm and the Japanese electronics industry association JEITA estimated for barium-ferrite LTO-7 tape at 25 °C, against at least 20 years for older metal-particle LTO-5 tape, from accelerated tests by the tape's maker (Fujifilm and JEITA, 2019).
Cloud storage durability
- 99.999999999% (11 nines) is the data durability Amazon S3 is designed to exceed, a design target rather than a measured loss rate, with data stored across at least three Availability Zones by default (Amazon Web Services, 2026).
- 1 object every 10,000 years is the average loss AWS said to expect when storing 10,000,000 objects in Amazon S3, its own illustration of an 11-nines annual durability design target (Amazon Web Services, 2018).
- 99.999999999% (11 nines) a year is the durability Microsoft designs Azure's cheapest option, locally redundant storage (copies in a single datacentre), to provide at least, a design target (Microsoft, 2026).
- 99.99999999999999% (16 nines) a year is the durability Microsoft designs Azure geo-redundant storage, which copies data to a second region hundreds of miles away, to provide at least, a design target (Microsoft, 2026).
- 99.999999999% (11 nines) a year is the durability Google Cloud Storage is designed for at least, regardless of storage class and location, using erasure coding across multiple devices, a design target (Google Cloud, 2026).
- 99.999999999% (11 nines) a year is the durability Backblaze calculates for its B2 cloud storage, a modelled figure for files split into 17 data and 3 parity shards, up from the 8 nines it published earlier (Backblaze, 2018).
What archivists recommend
- At least every 5 years, individuals should create new archival copies of their digital files on fresh media, the Library of Congress advises, because all digital storage media have a short life (Library of Congress, 2011).
- 10 years is the age by which US federal agencies must copy permanent records held on magnetic storage media onto tested new media, under the National Archives' records-storage regulation (NARA, 2016).
- At least 10 years of proven life span is what the UK National Archives asks of a storage medium chosen for long-term preservation, adding that beyond that, obsolescence of the drives that read it matters more than decay of the medium (The National Archives, 2008).
- Flash memory sticks and cards scored lowest for longevity (1 of 3) and overall (10 of 18) in the UK National Archives' example storage-media scorecard, against 2 for hard disks and 3 for CD-R, DVD-R and LTO tape (The National Archives, 2008).
- 100 years is the average archive life Sony estimates for the discs in its Optical Disc Archive cartridges, from its own accelerated tests under the ISO/IEC 16963 method, a maker's estimate for a professional system now discontinued (Sony, 2025).
- More than 10,000 years at room temperature is how long data laser-written into glass is projected to stay stable, from accelerated ageing in Microsoft Research's Project Silica, a research system rather than a product on sale (Nature, 2026).
Numbers in circulation
Sources: National Institute of Standards and Technology and Council on Library and Information Resources; National Institute of Standards and Technology; National Institute of Standards and Technology and Library of Congress; Library of Congress, Preservation Research and Testing Division (2009, 2015); US National Archives and Records Administration (2007); Optical Storage Technology Association; Canadian Conservation Institute, in Restaurator 39, 129-155; Canadian Conservation Institute; Millenniata, Inc. (2011, 2013); Laboratoire national de métrologie et d'essais; Samsung Electronics (2022, 2026); Sandisk (2026); Kingston Technology (2024, 2026); Lexar; Matt Cole; Council on Library and Information Resources, research by the Library of Congress Preservation Research and Testing Division and FUJIFILM Recording Media Products Division; Council on Library and Information Resources, research by the Library of Congress and FUJIFILM; LTO Program (2022, 2025); FUJIFILM Corporation and JEITA; Amazon Web Services (2018, 2026); Microsoft; Google Cloud; Backblaze; Library of Congress; US National Archives and Records Administration, Code of Federal Regulations; The National Archives; Sony; Nature
Are hard drives still worth buying?
124.3 million hard drives shipped worldwide in 2025, about a fifth of the 651 million of 2010 (Coughlin Associates, 2026).

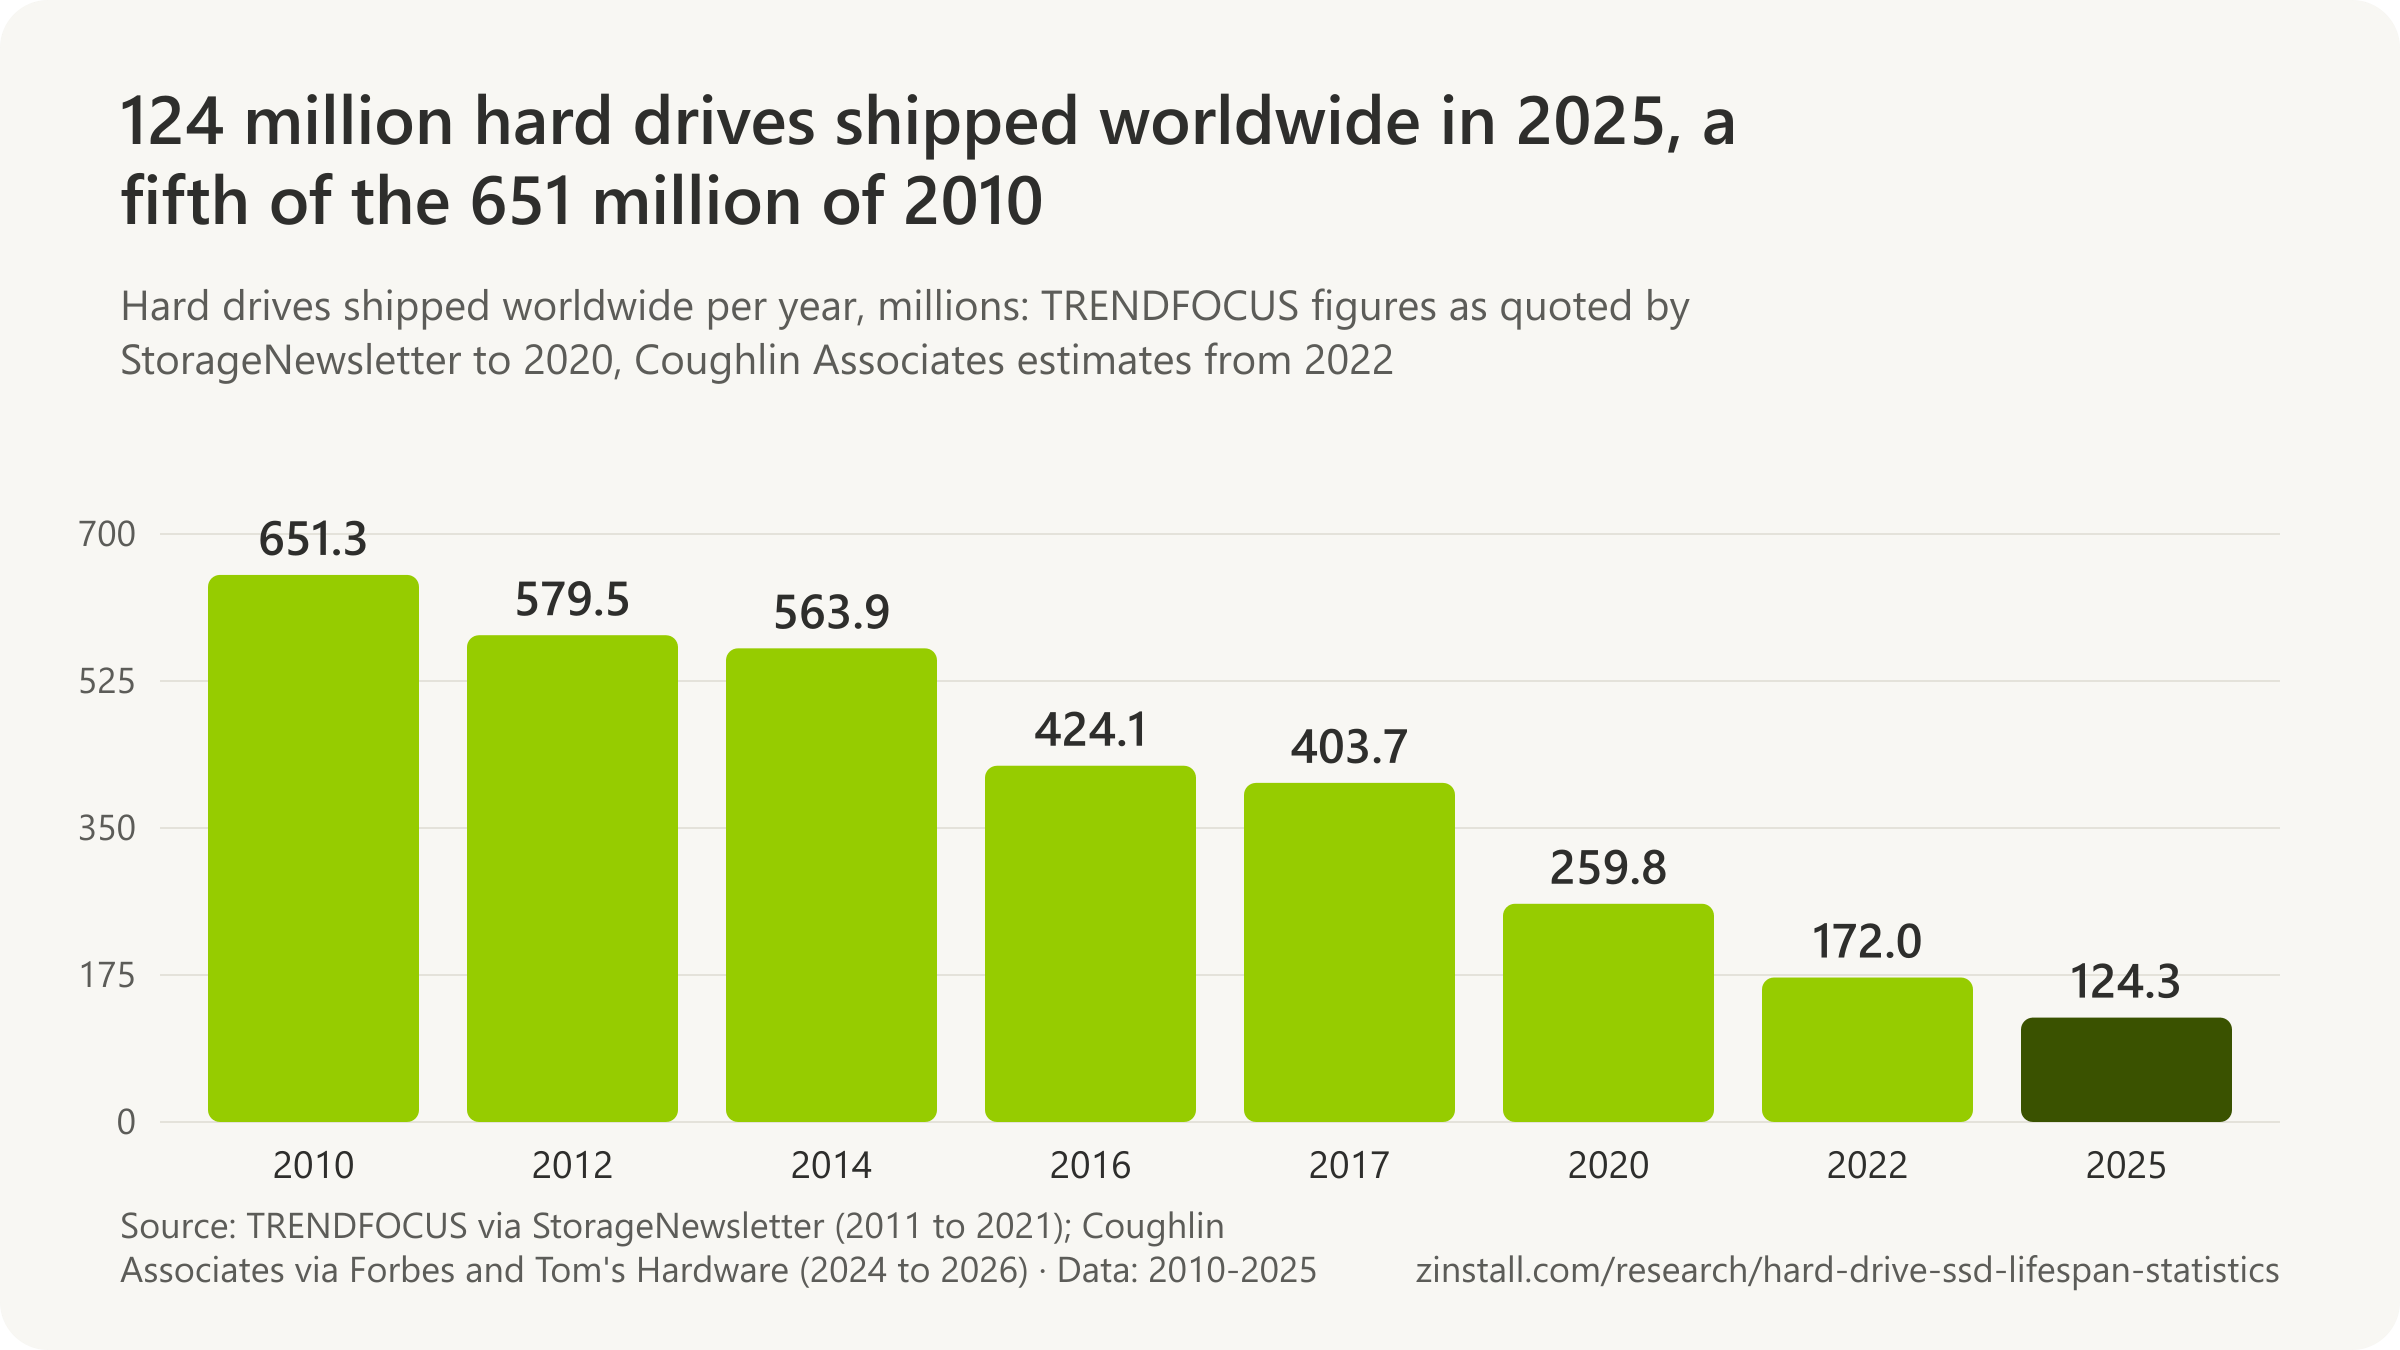
- 333 million SSDs shipped in 2020 against 260 million hard drives, the first year SSDs outsold them.
- 87% of the data stored in large data centres sits on hard drives.
- 85% of consumer PCs stored everything on a hard drive alone in a 2019 sample, the last such count.
- Lead times for data-centre hard drives passed 52 weeks in 2025 as AI storage demand outran supply.
| Measure and date | Figure |
|---|---|
| Data-centre (nearline) hard drives shipped, 2025 | 80.8 million |
| Hard-drive capacity shipped, 2025 | 1.62 ZB |
| Hard-drive makers left after 2012 | 3 |
| Hard-drive price per gigabyte, 2025 | $0.015-0.016 per GB |
| Flash wafer contract prices, November 2025 | 20% to over 60% |
| PC prices in 2026 against 2025 (forecast) | +17% (forecast) |
| Steam survey PCs with more than 1 TB of storage, October 2026 | 48.6% |
| Hard-drive assembly capacity shut by the 2011 Thailand floods | about 45% |
| Seagate's average price per drive after the floods, fiscal 2012 | $66 (from $54) |
| Branded (mostly external) hard drives shipped, Q4 2014 | about 17 million |
Sources: Forbes; StorageNewsletter (2013-2022); Seagate Technology (2025, 2013, 2012); Avast; TrendForce (2025a, 2025b, 2025c); Gartner, Inc.; Valve; Western Digital Corporation; Tom's Hardware
Related guides: A new PC with an SSD · Clone or transfer
More statistics (53)
Hard drives have left most PCs: SSDs outsold them from 2020 and are in nearly every new laptop. But hard drives still hold most of the world's data, because data centres buy them for capacity, and the exabytes they ship keep rising while unit sales fall. Three makers remain. In 2025 and 2026 demand for AI storage stretched both hard-drive and flash supply, and prices rose.
Hard drives shipped

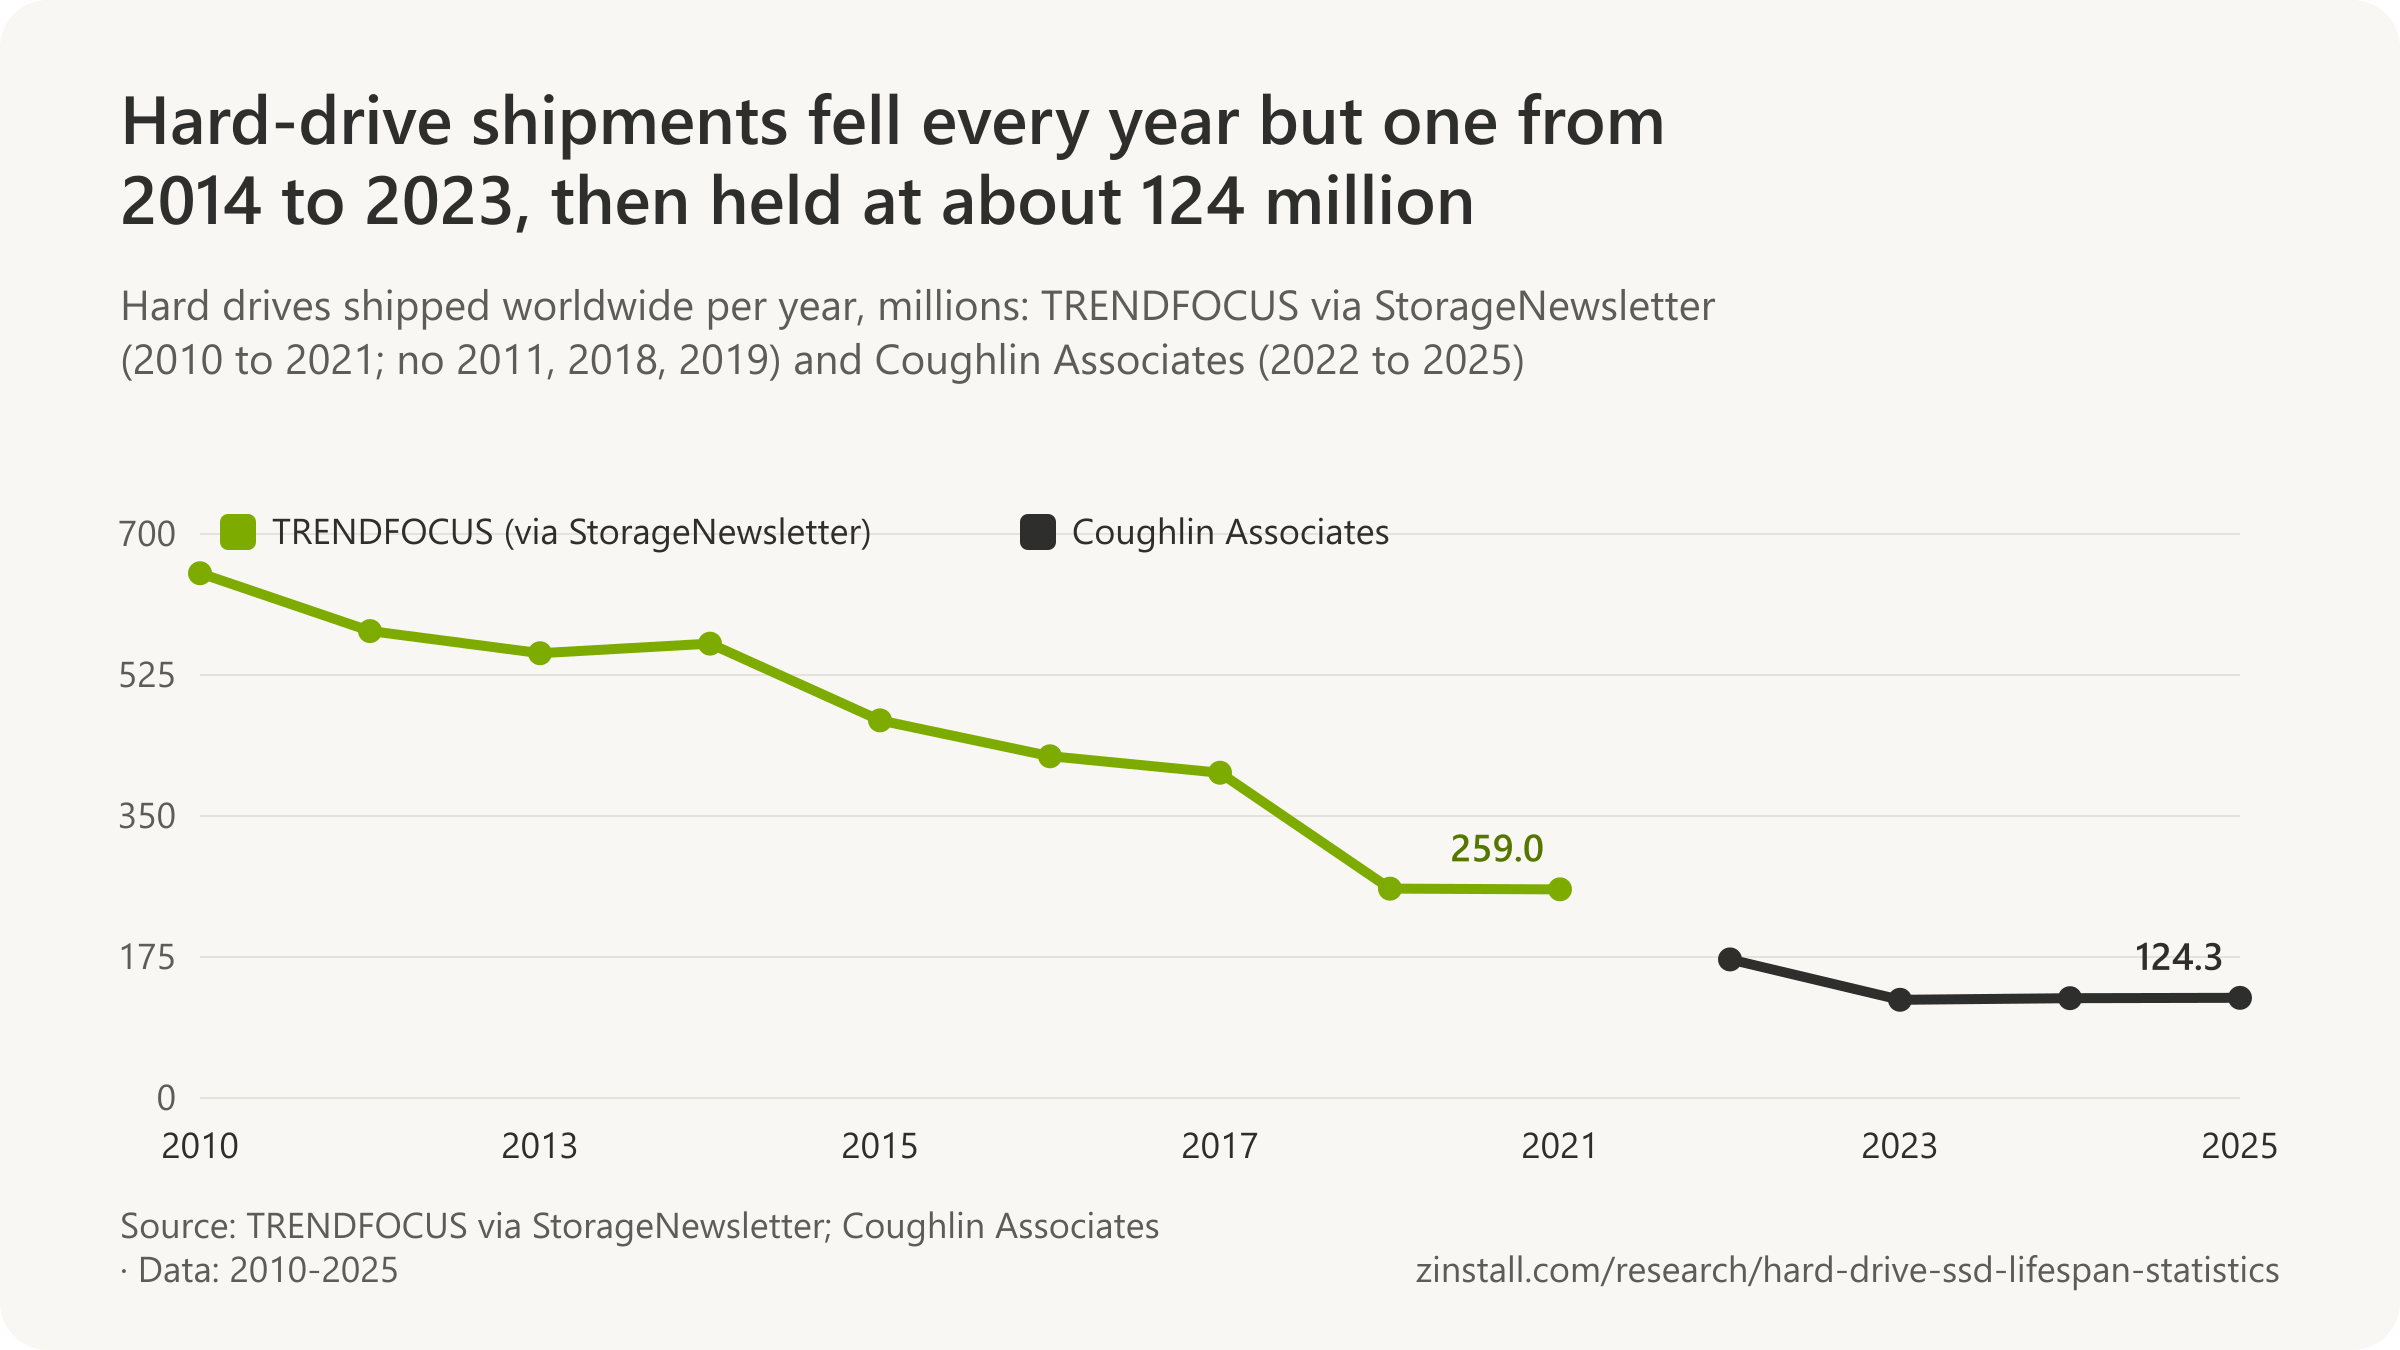

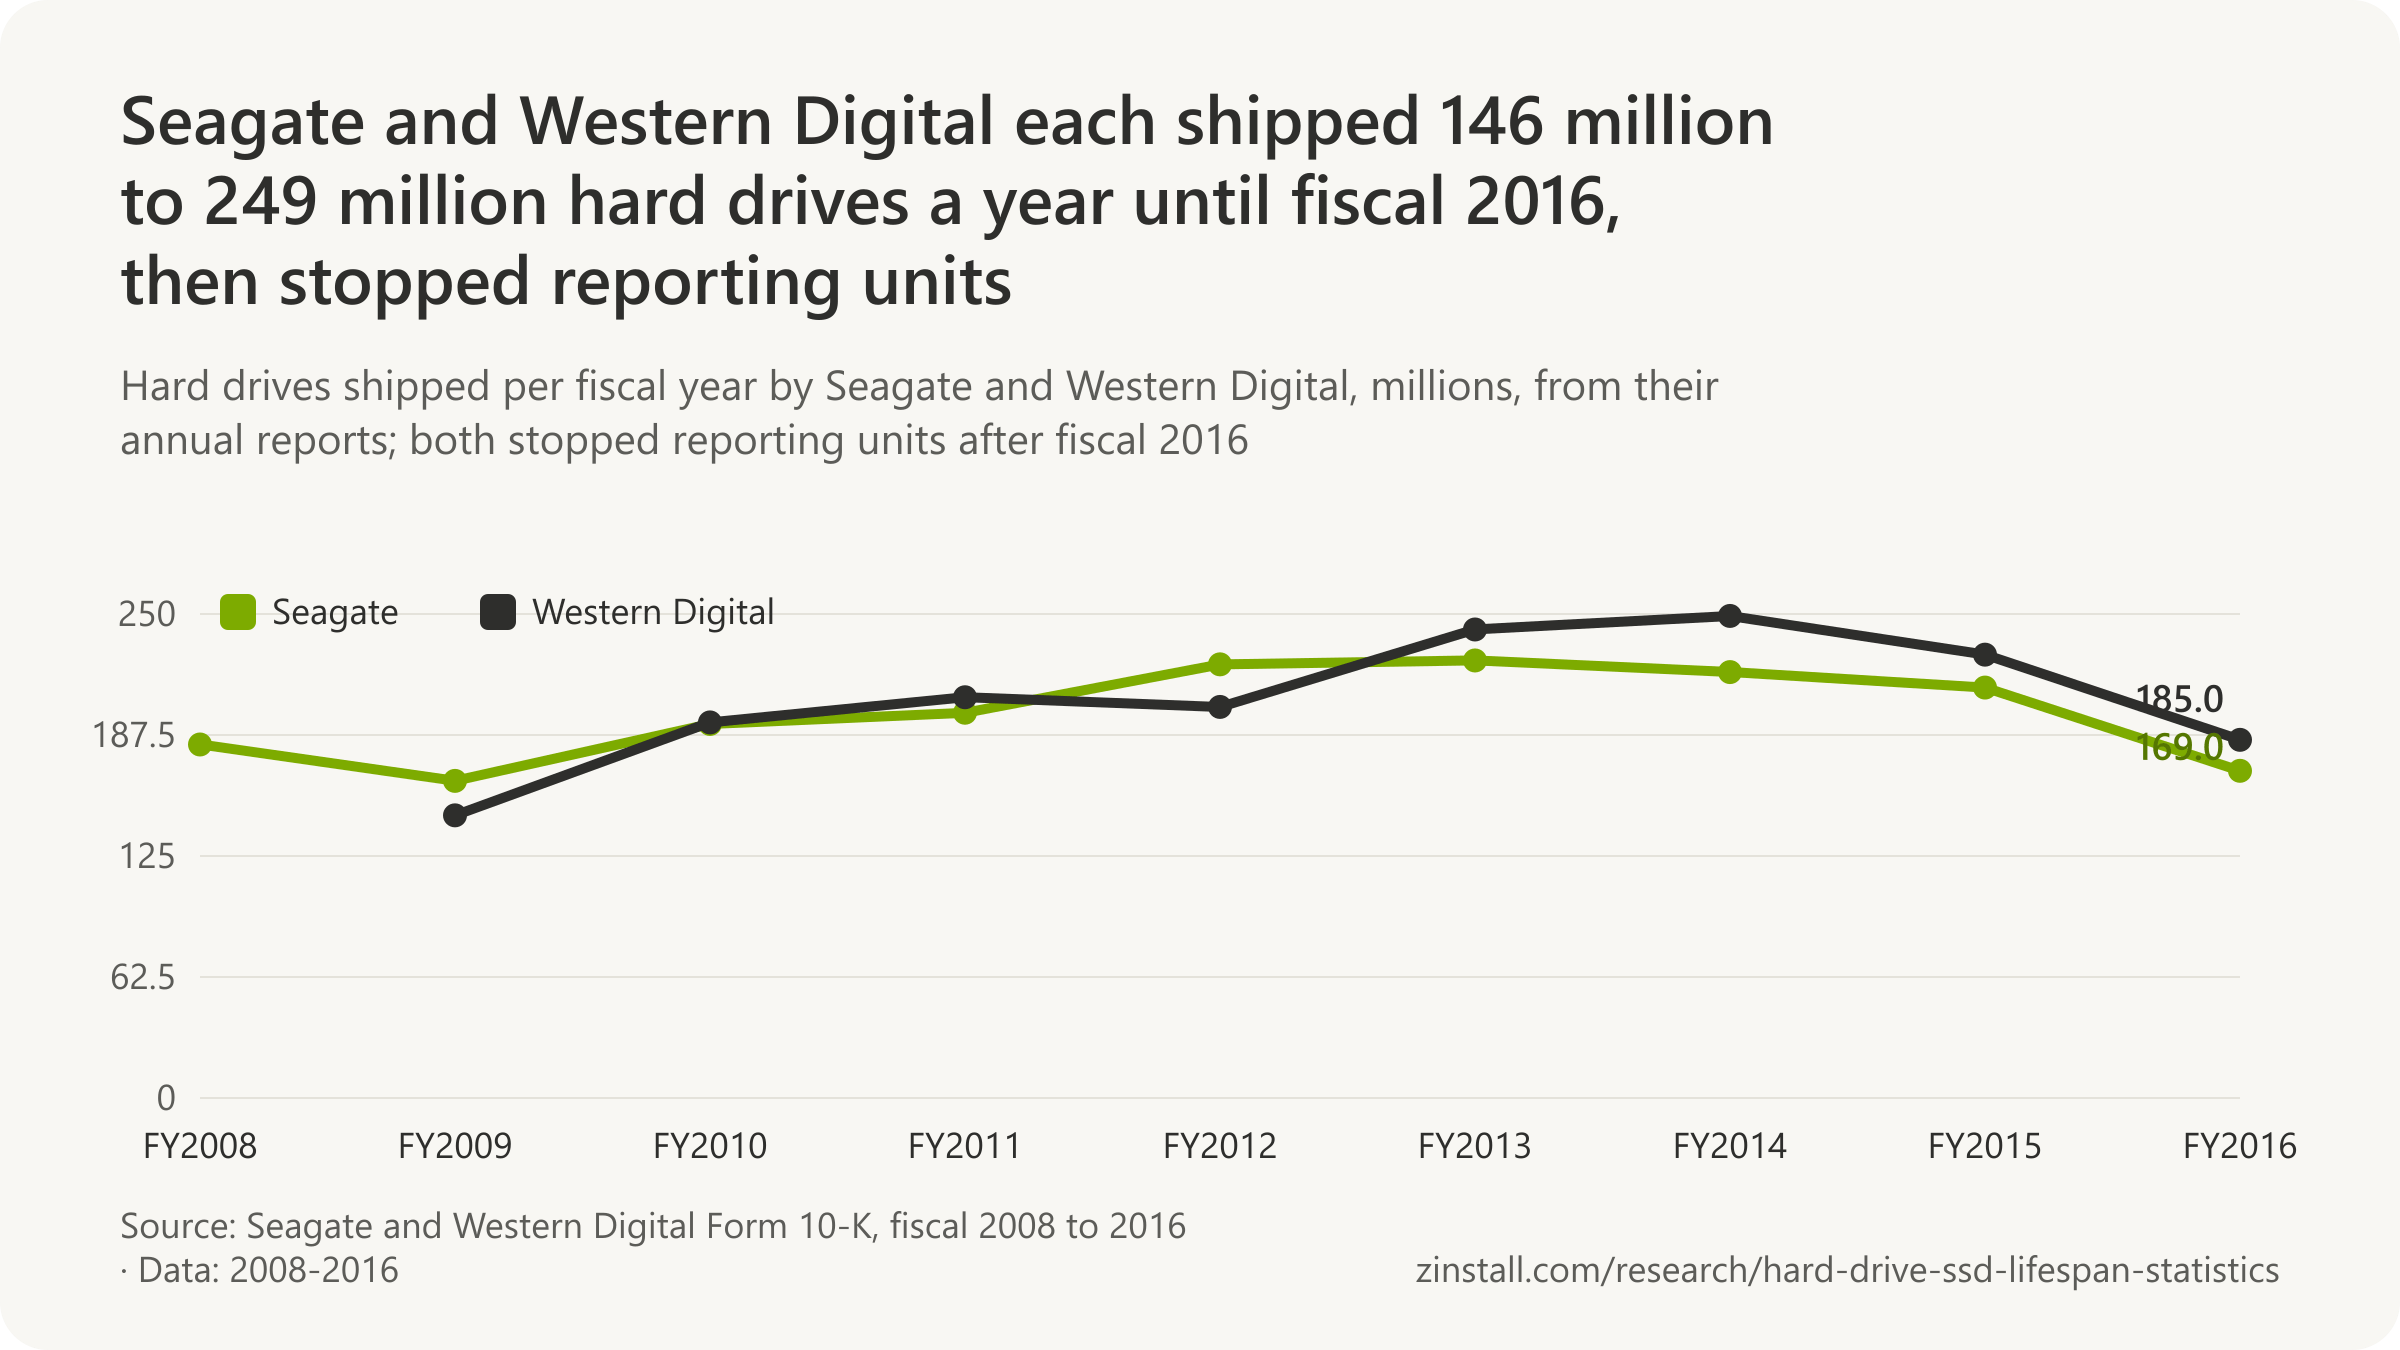
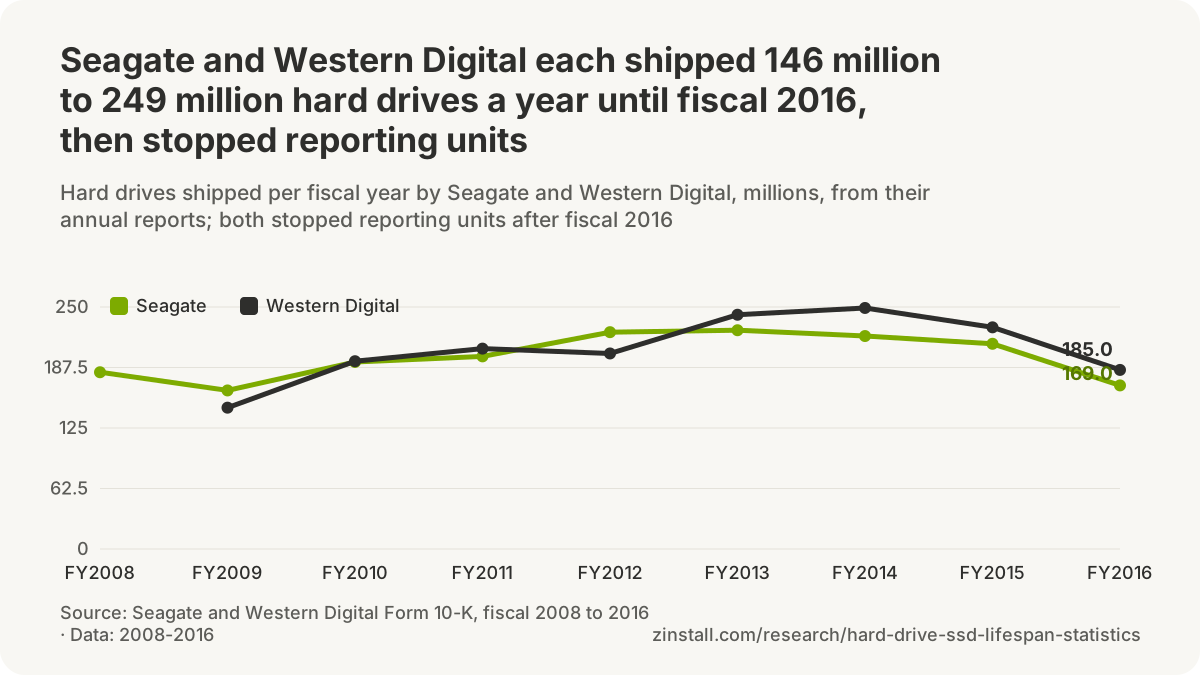
- 333 million SSDs were shipped worldwide in 2020 against 260 million hard drives, the first year SSDs outsold HDDs (TRENDFOCUS figures quoted by StorageNewsletter, 2021).
- 373 million SSDs were shipped worldwide in 2021, up 12% from 2020, against 259 million hard drives (TRENDFOCUS figures quoted by StorageNewsletter, 2022).
- 333 million SSDs were shipped worldwide in 2022, down 11% from 2021 (TRENDFOCUS figures quoted by StorageNewsletter, 2023).
- 80.8 million of the hard drives shipped worldwide in 2025 were nearline drives for data centres, about two in three of all hard drives shipped, up 13.6% in a year (Coughlin Associates estimate, 2026).
- 2012 was the peak year for hard-drive industry revenue and 2010 for unit shipments, a gap Tom's Hardware ties to the 2011 Thailand floods that caused drive shortages (Coughlin Associates figures quoted by Tom's Hardware, 2024).
- 33.4% fewer hard drives and 14.5% less hard-drive capacity were shipped worldwide in 2022 than in 2021, with the biggest drop in data-centre (nearline) drives (Coughlin Associates estimate, 2023).
- About 45% of the hard-drive industry's assembly capacity was shut by the Thailand floods from mid-October 2011 to February 2012, and industry unit volumes fell 5% in 2011, by Western Digital's estimate (Western Digital Form 10-K, 2012).
- Three companies still make hard drives, Seagate, Western Digital and Toshiba, after the 2012 consolidation in which Seagate took over Samsung's drive business and Western Digital bought Hitachi GST (Seagate Form 10-K, 2013).
- 420 million desktop and laptop (client) hard drives were shipped worldwide in 2013: 251.6 million 2.5-inch mobile and 168.7 million desktop drives (TRENDFOCUS figures quoted by StorageNewsletter, 2014).
- 268 million desktop and laptop (client) hard drives were shipped worldwide in 2016, with mobile drives down 12% on SSD gains, especially in business notebooks (TRENDFOCUS figures quoted by StorageNewsletter, 2017).
- 139 million desktop and laptop (client) hard drives were still shipped worldwide in 2020, a third of the 2013 number, while enterprise drives took 64% of the capacity shipped (TRENDFOCUS figures quoted by StorageNewsletter, 2021).
- About 17 million branded (retail, mostly external) hard drives were shipped worldwide in the fourth quarter of 2014 by the three makers: Western Digital 7.16 million, Seagate 5.95 million and Toshiba 3.82 million (TRENDFOCUS figures quoted by StorageNewsletter, 2015).

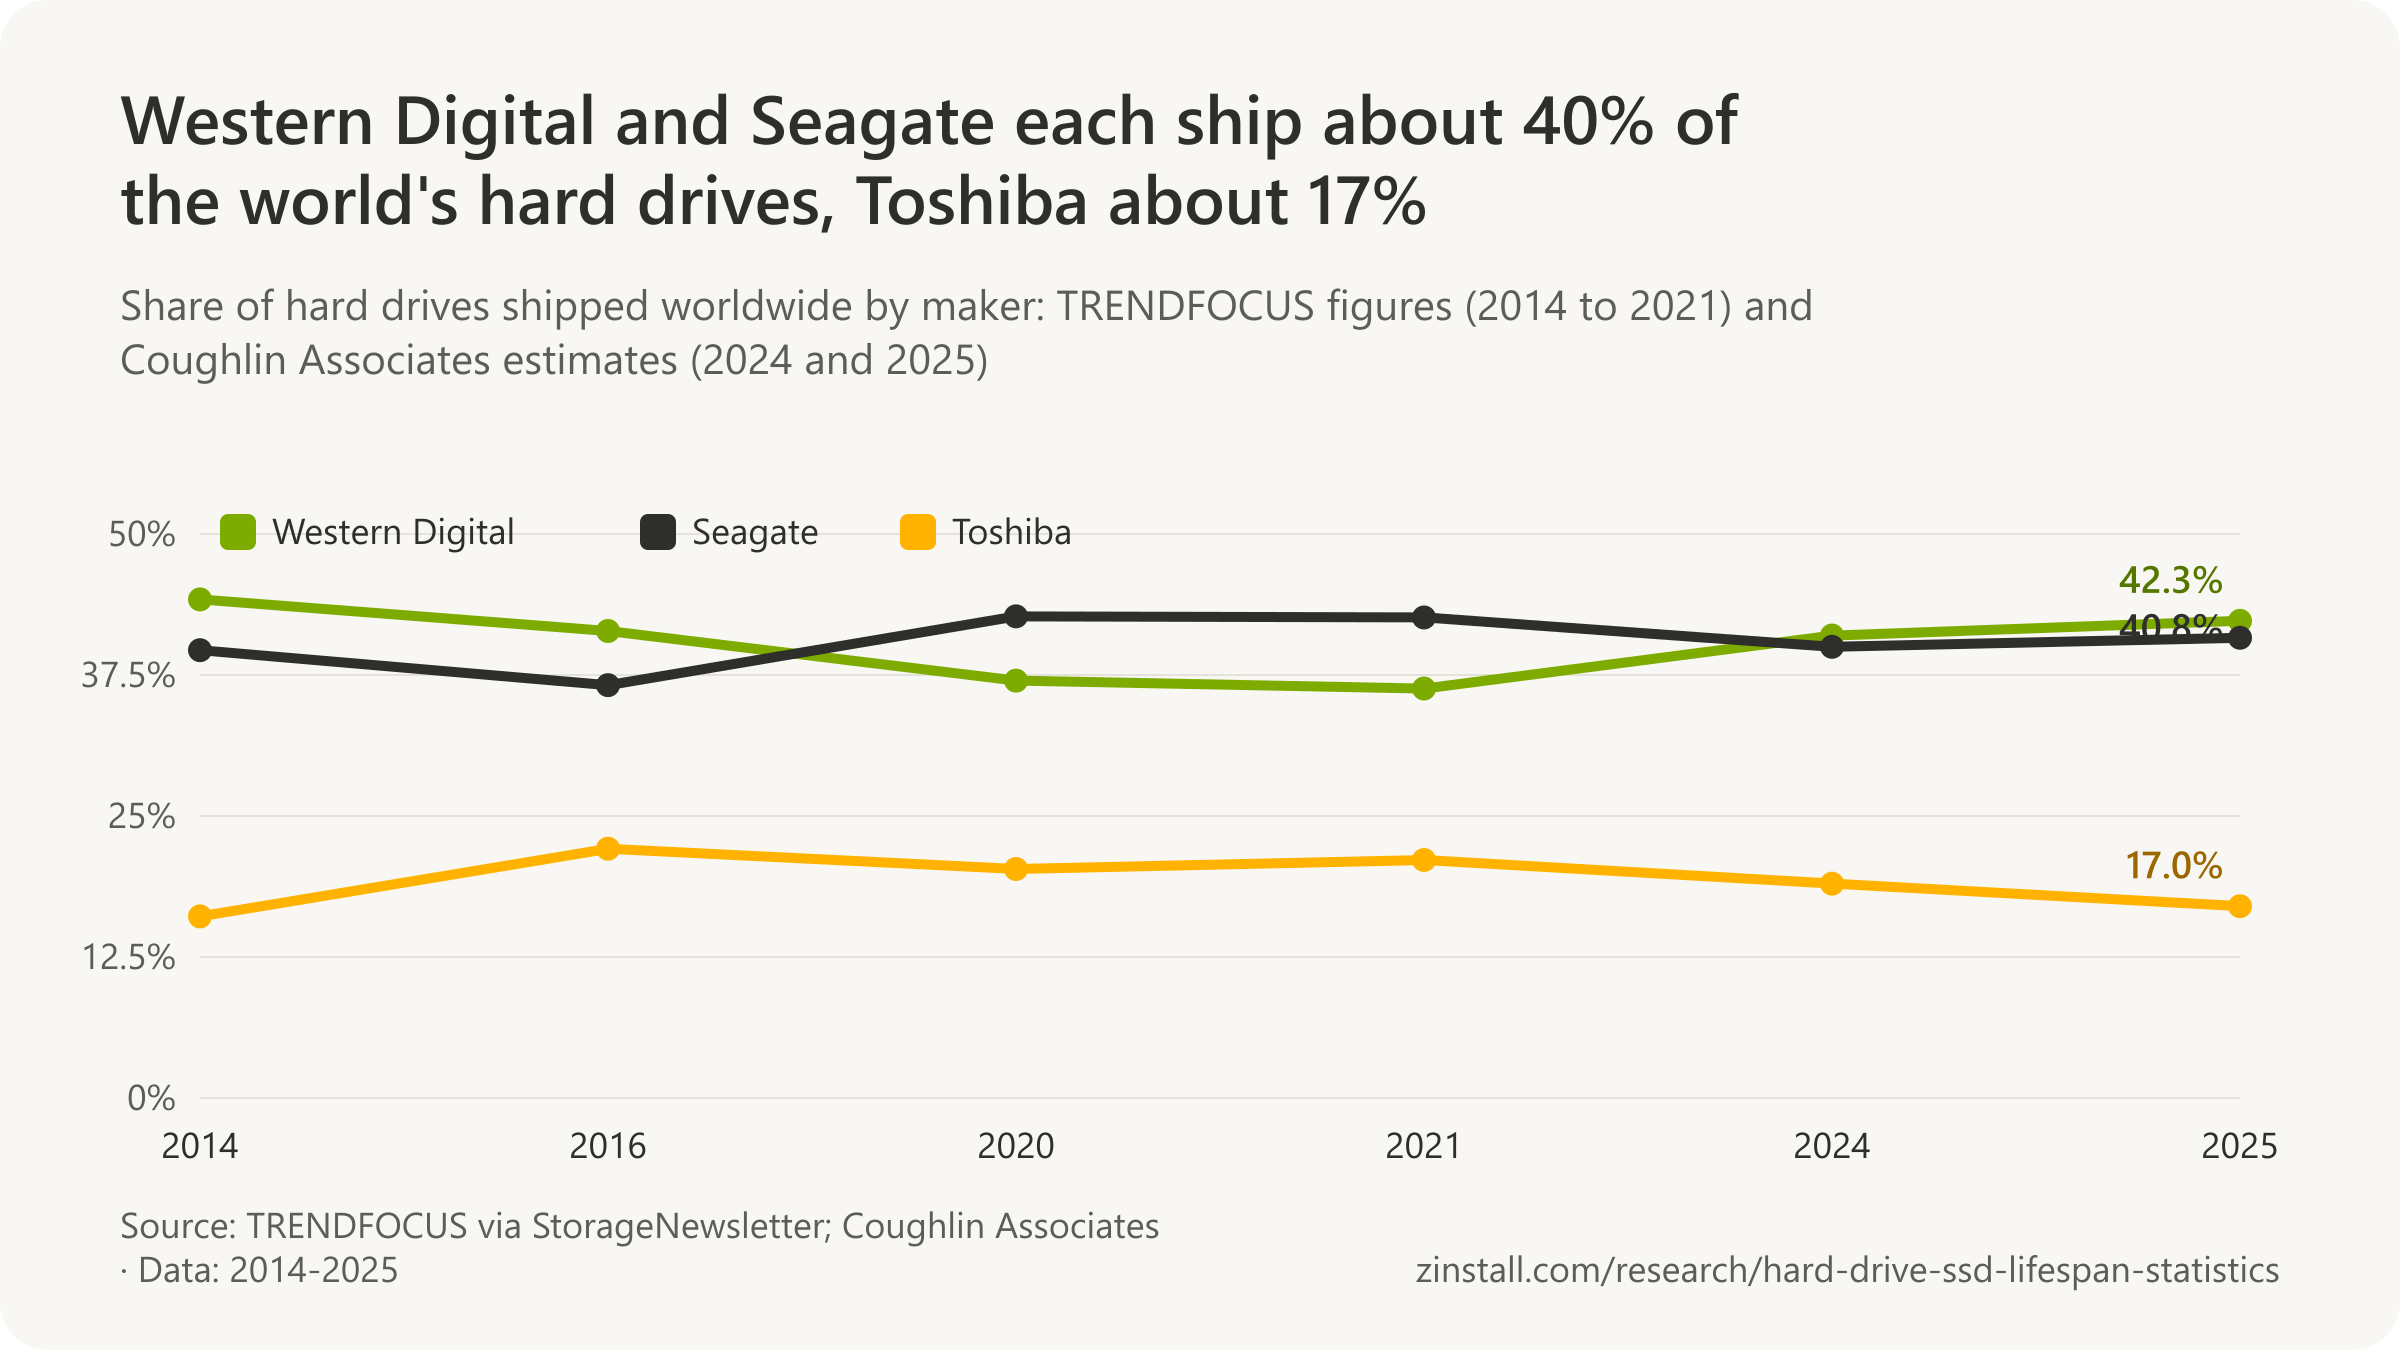
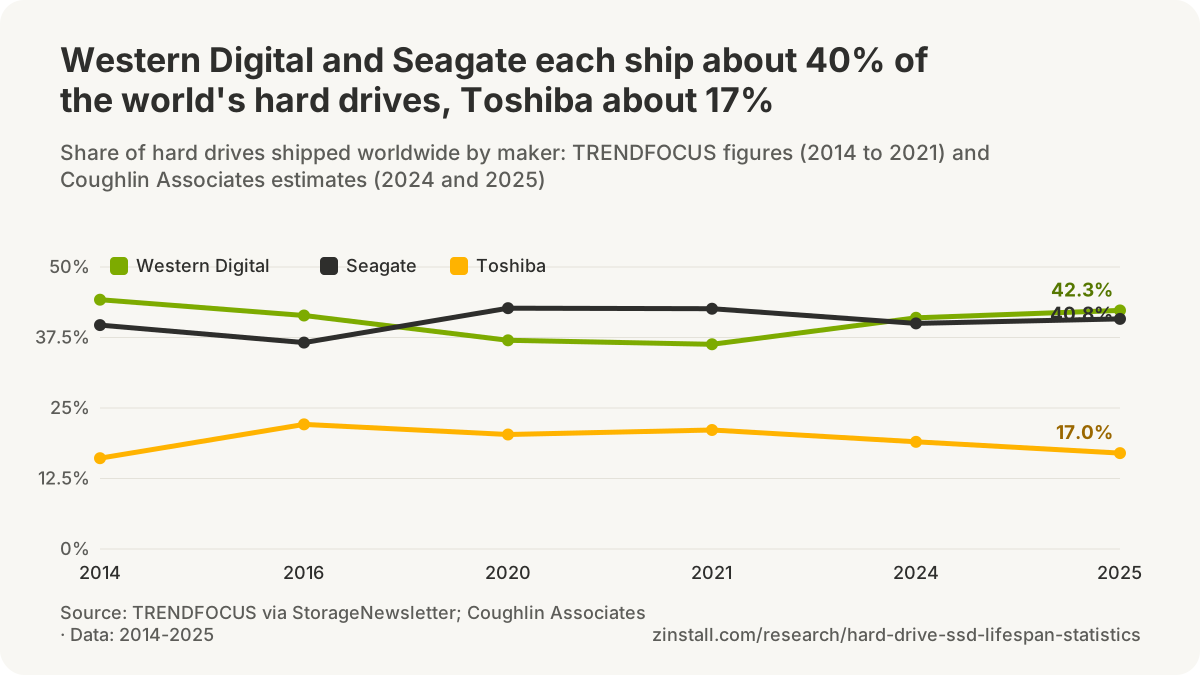
Capacity shipped

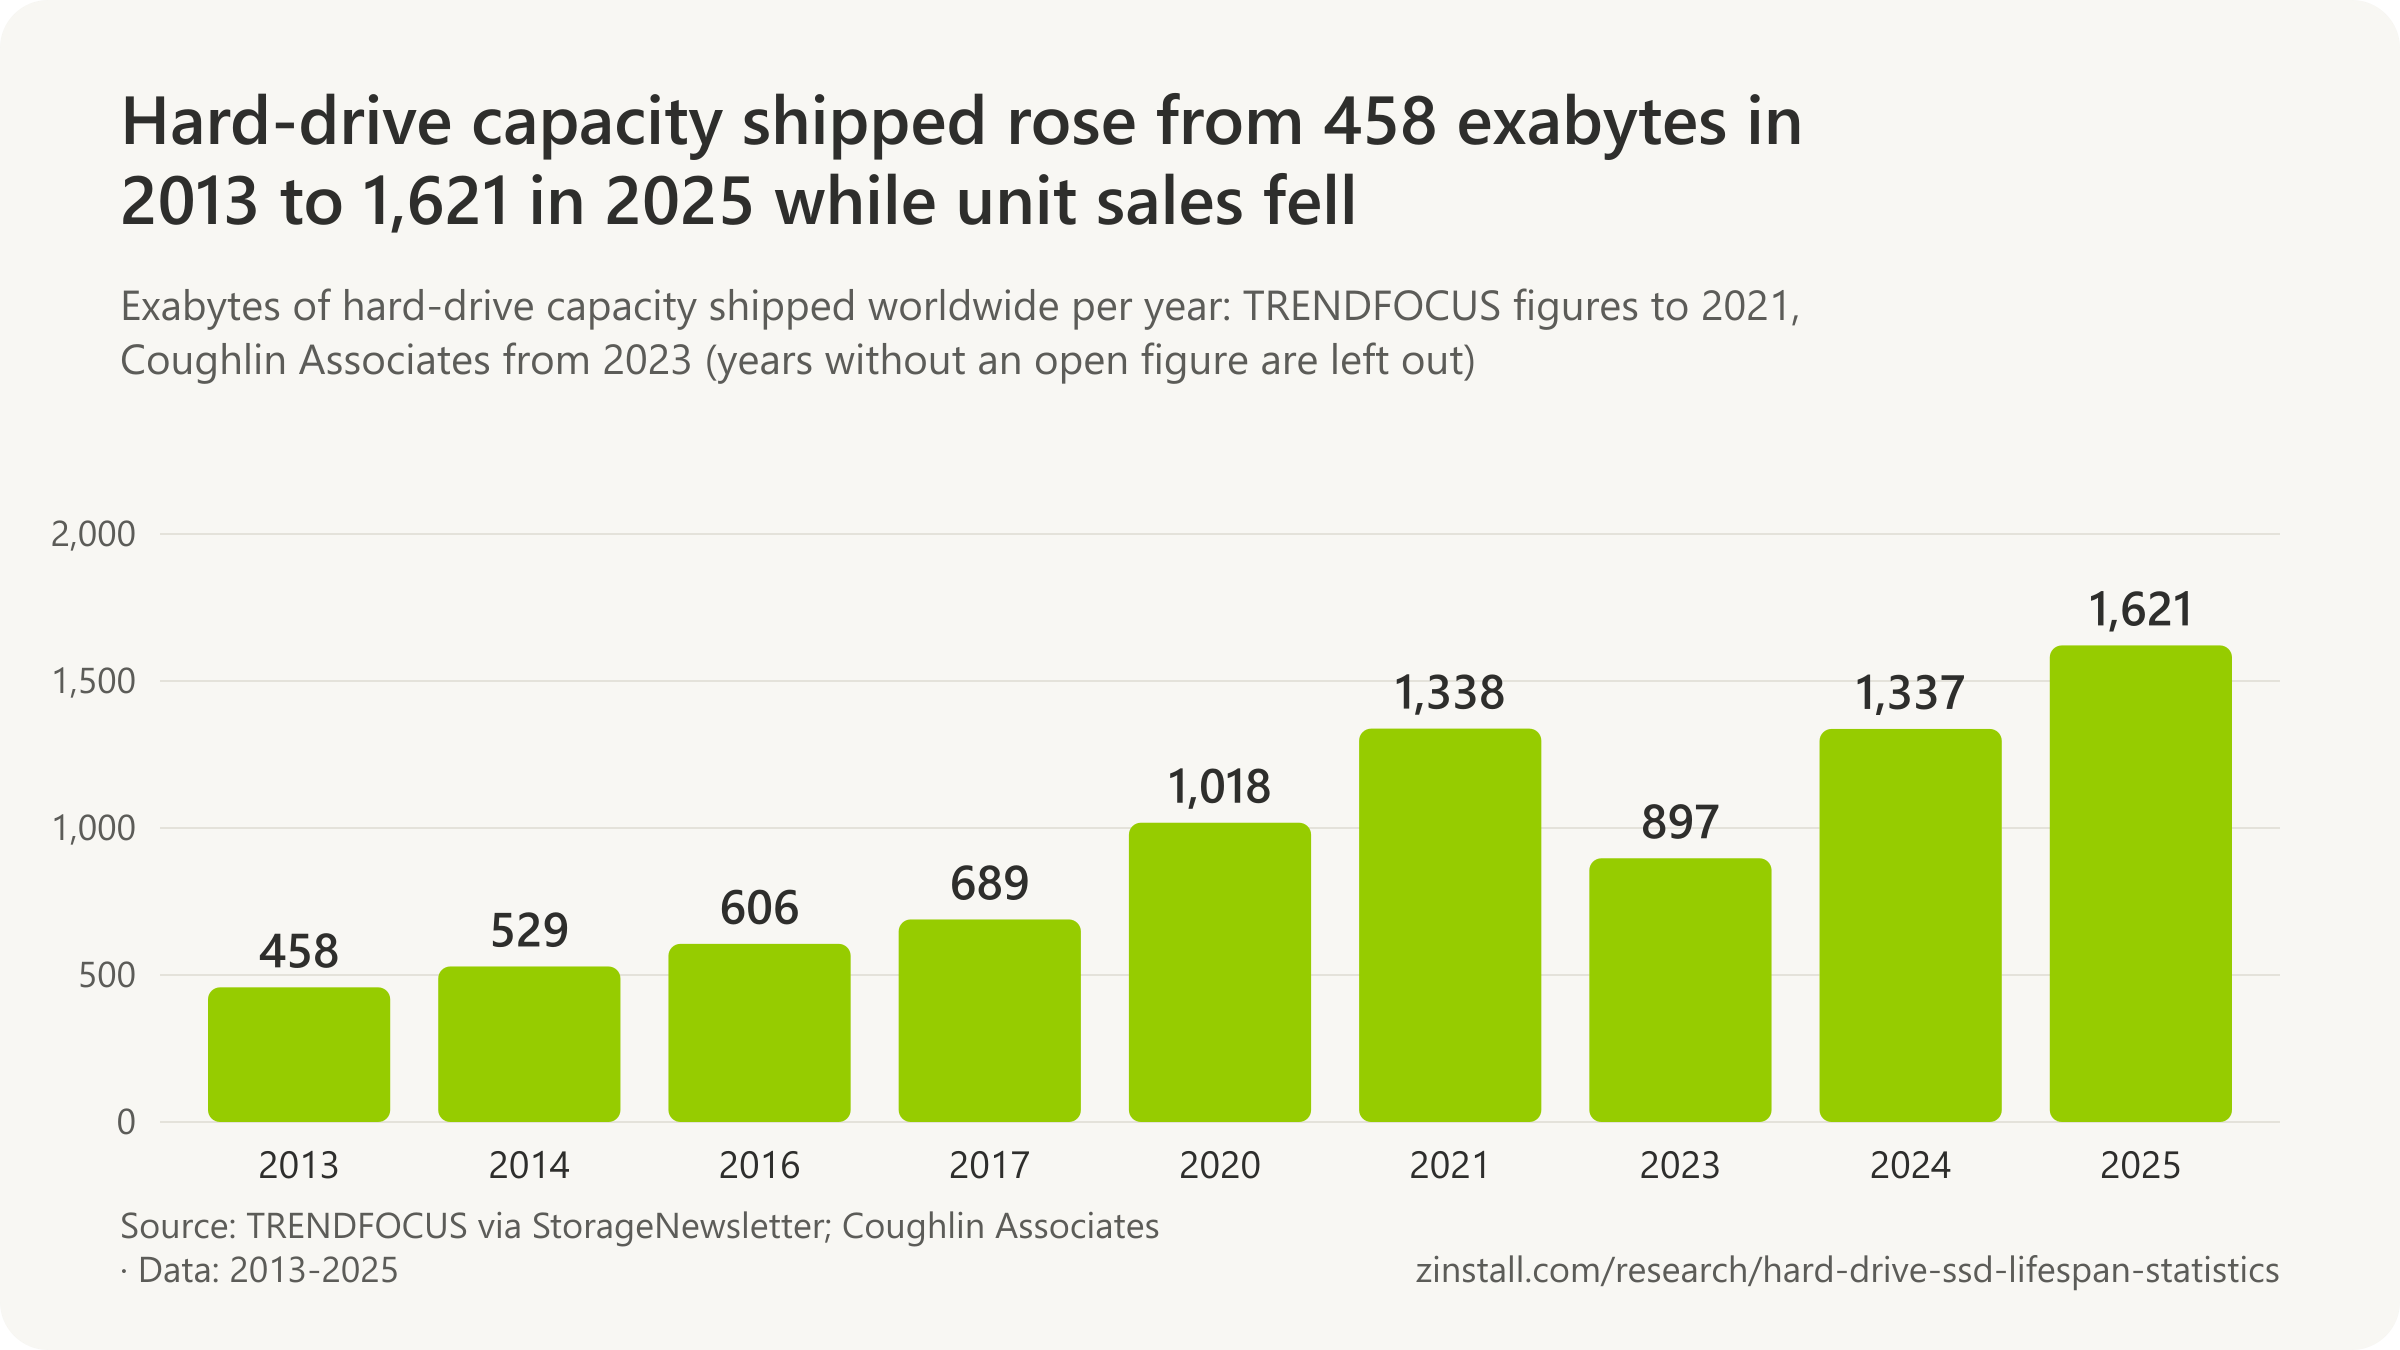

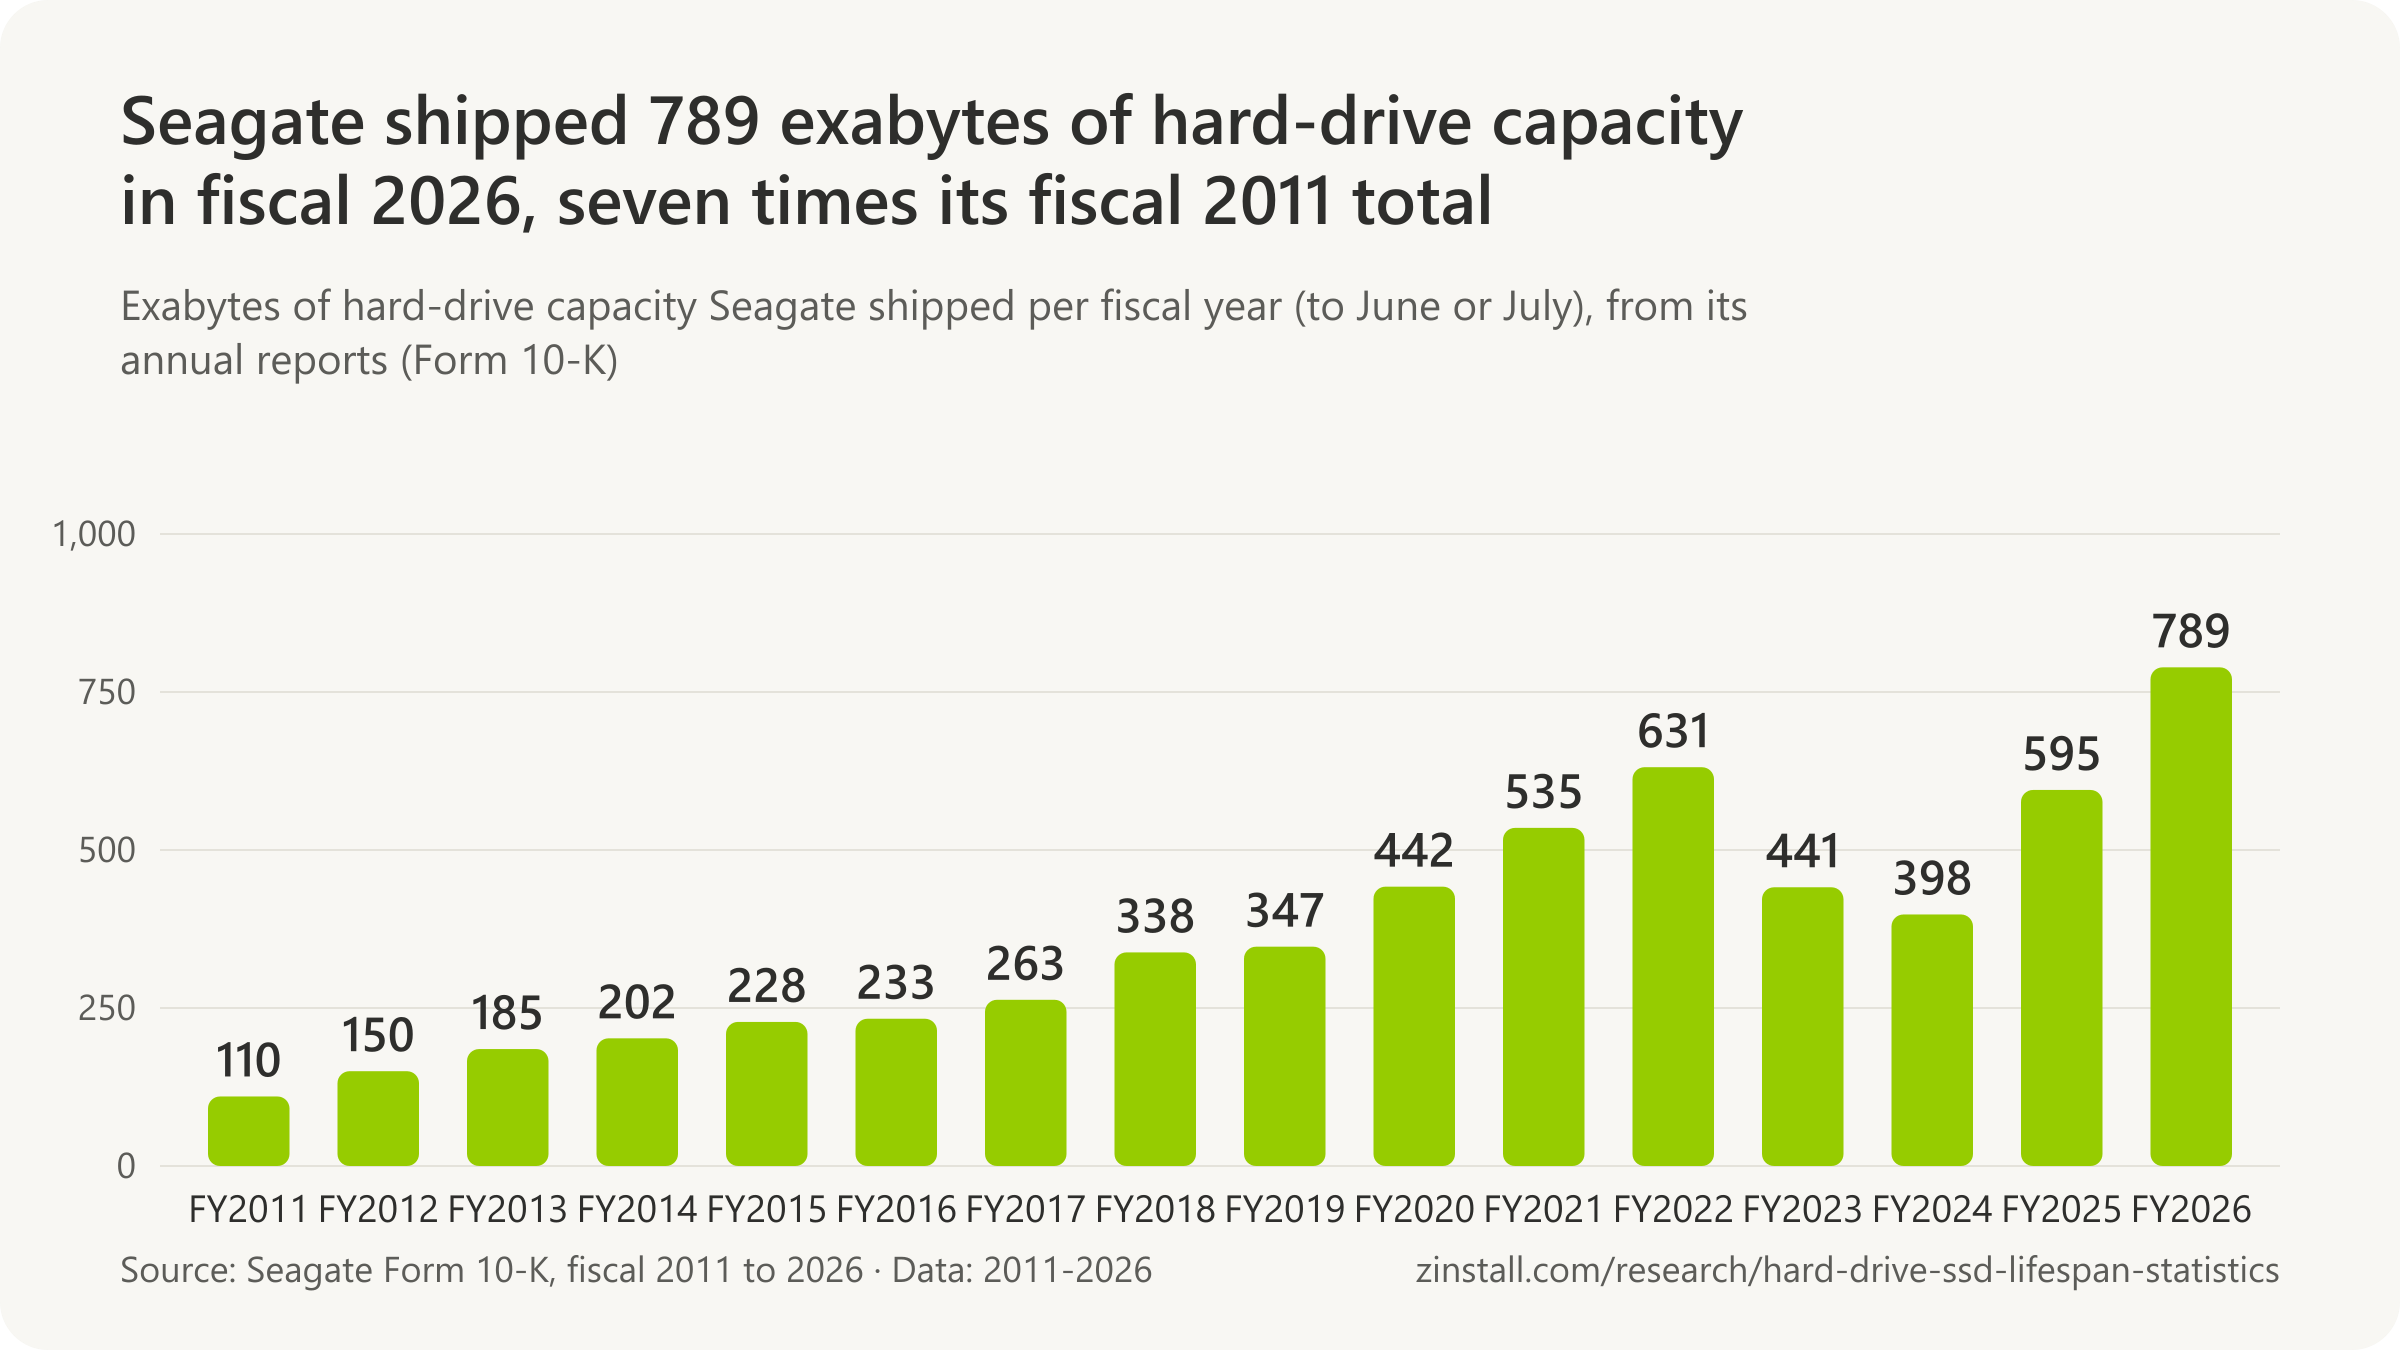

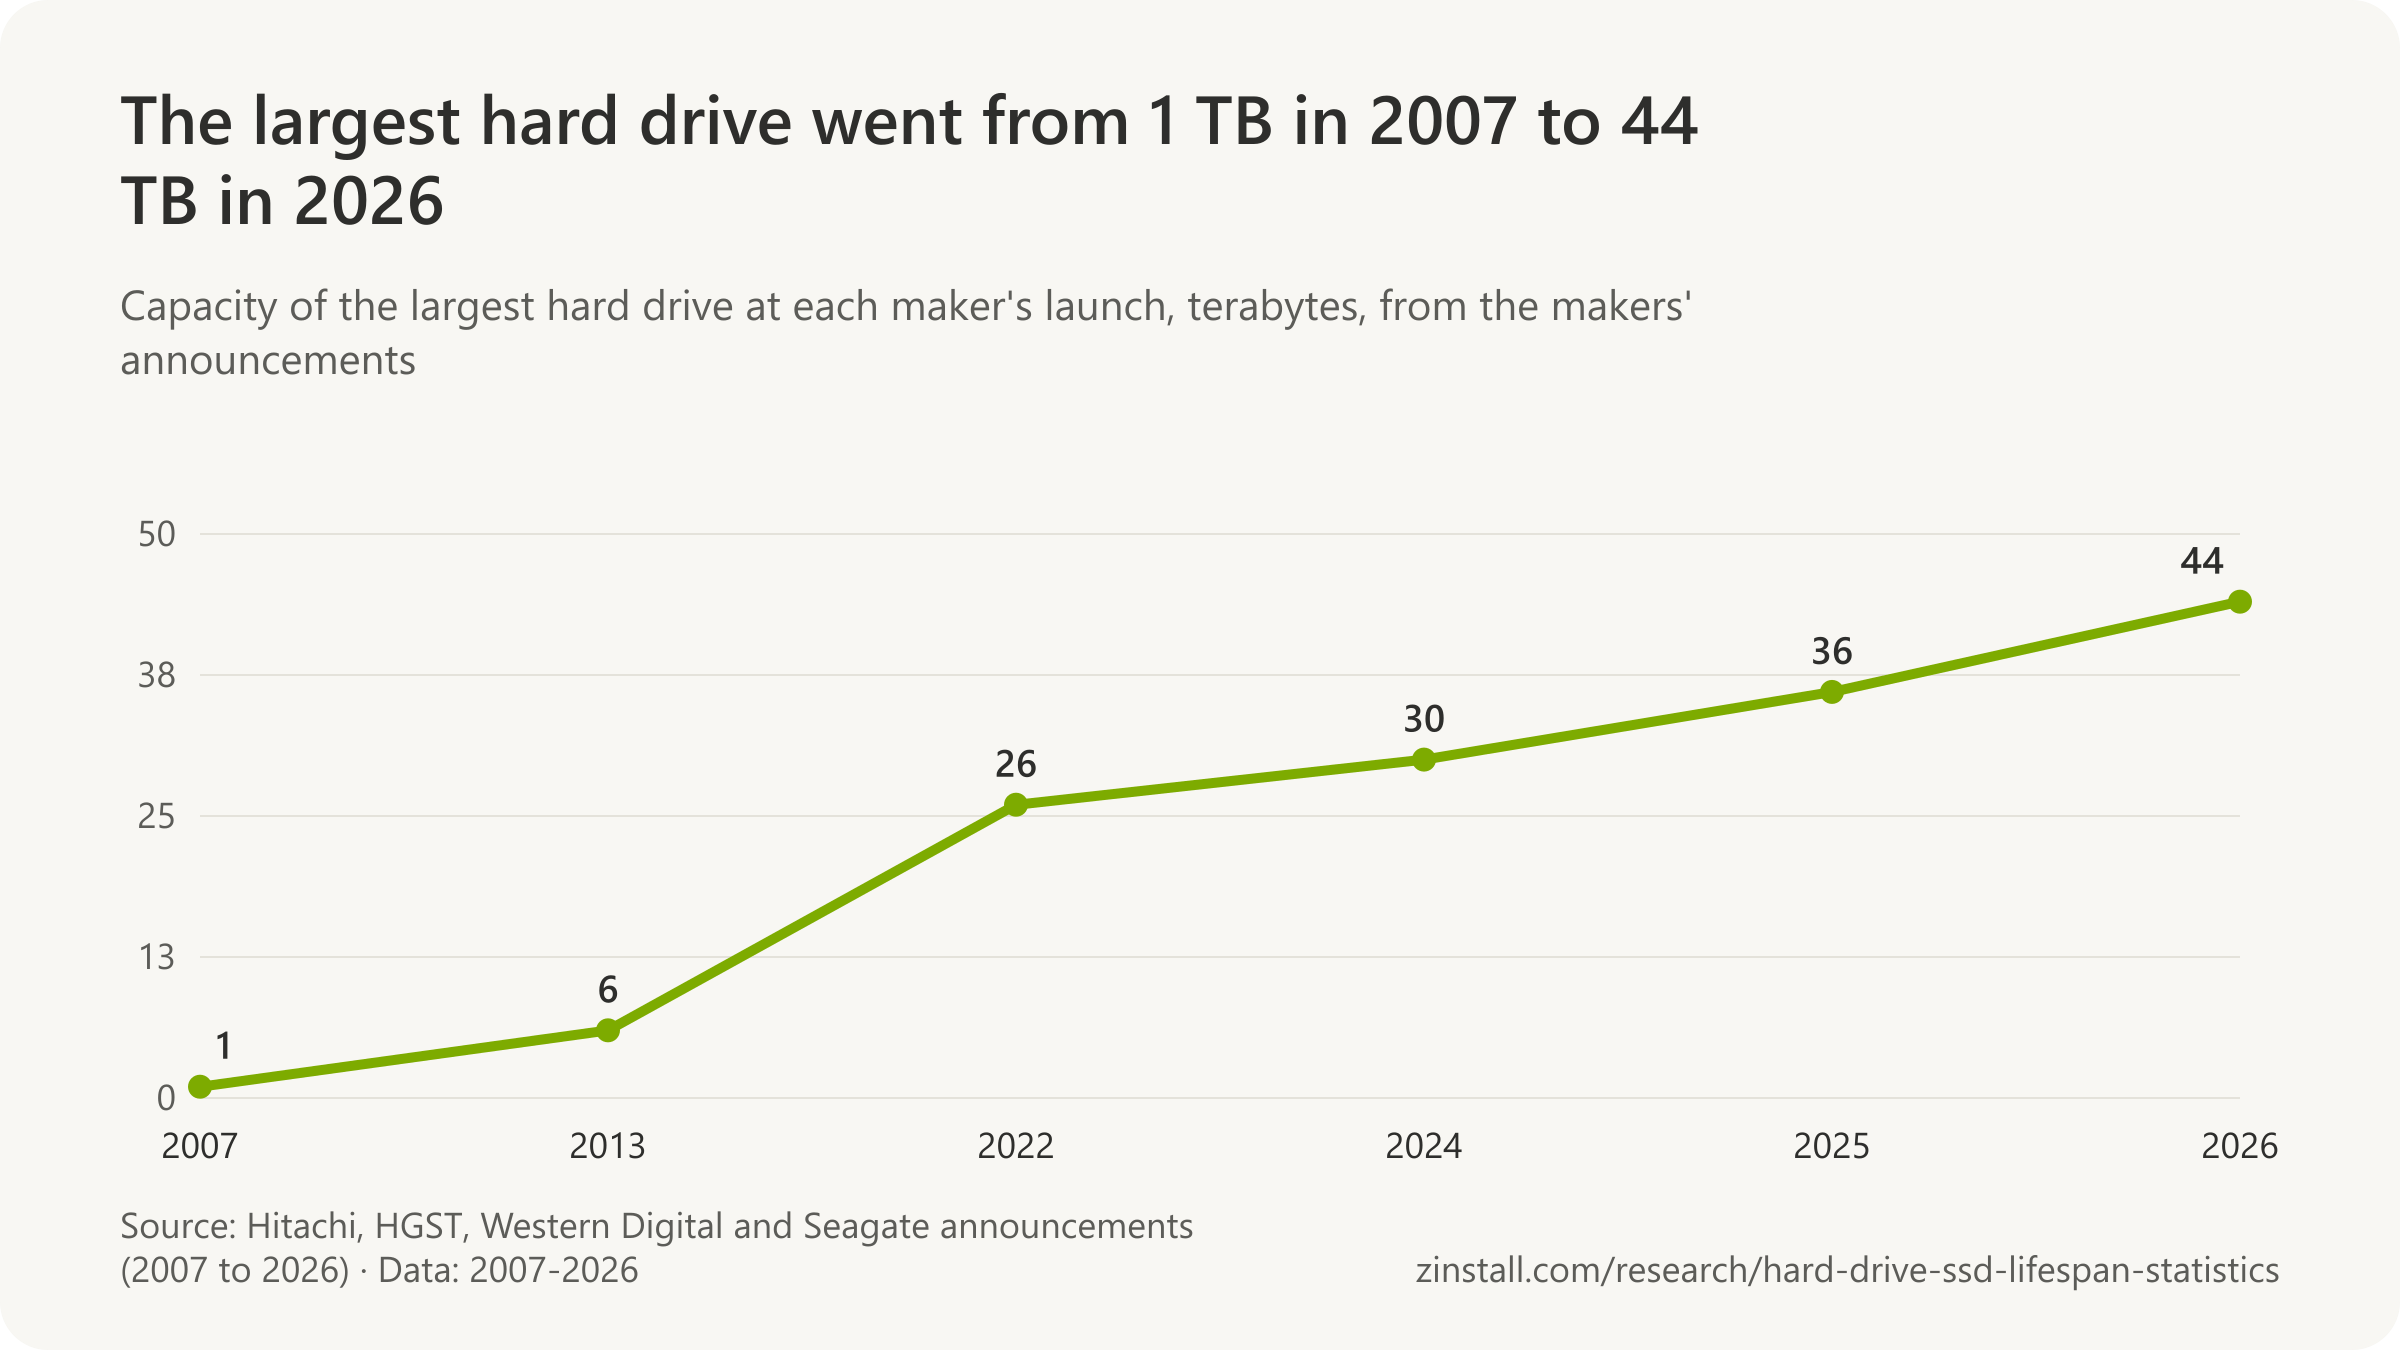
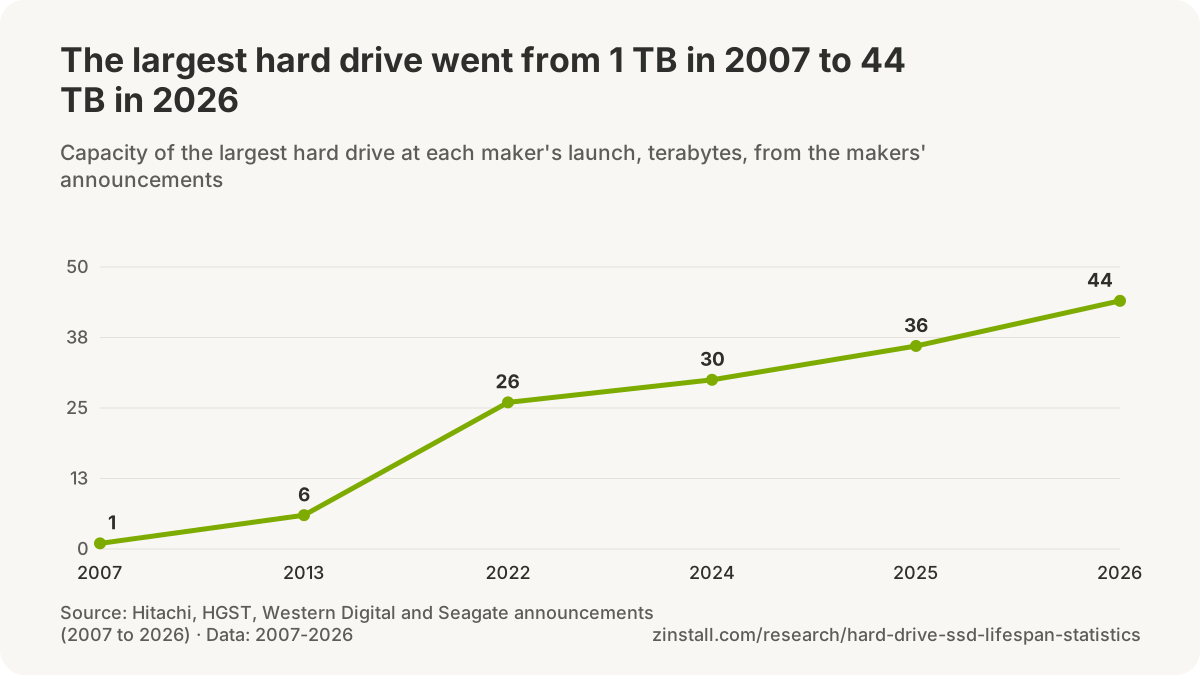
- Western Digital shipped 696 exabytes of hard-drive capacity in its fiscal year 2025, up from 443 in fiscal 2024 and 412 in fiscal 2023 (Western Digital Form 10-K, 2025).
- Western Digital sold 25% more exabytes of hard-drive capacity in its fiscal year 2026 than in fiscal 2025, with cloud customers taking 89% of its revenue (Western Digital Form 10-K, 2026).
- 207 exabytes of SSD capacity were shipped worldwide in 2020, about a fifth of the 1,018 exabytes shipped on hard drives (TRENDFOCUS figures quoted by StorageNewsletter, 2021).
- 32-33% of the notebooks shipped worldwide in the second quarter of 2016 came with an SSD rather than a hard drive (TrendForce, 2016).
- 45% of the notebooks shipped worldwide in 2017 came with an SSD, below expectations because SSD prices rose (TrendForce, 2018).
- More than half of the notebooks shipped worldwide in 2018 came with an SSD, and TrendForce expected 60-65% in 2019 (TrendForce, 2019).
- 92% of the notebooks shipped worldwide in 2022 were expected to come with an SSD, and about 96% in 2023 (TrendForce projection, 2022).
- Close to 100% of new notebooks ship with an SSD (TrendForce: attach rates 'reaching 100%'), and 101 million SSDs were sold through retail and distribution channels in 2024, down 14% (TrendForce, 2025).
- 87% of the exabytes stored in large data centres sit on hard drives, by IDC's 2025 Cloud Infrastructure Index as quoted in Seagate's annual report (IDC via Seagate Form 10-K, 2025).
- 912 exabytes of storage were shipped on hard drives and SSDs together in 2018, more than 800 of them on hard drives, so SSDs carried at most about an eighth (TRENDFOCUS, 2019).
- SSDs carried 17% of the storage capacity shipped on hard drives and SSDs in 2020 (207 of 1,226 exabytes), though they outsold hard drives in units (TRENDFOCUS figures quoted by StorageNewsletter, 2021).
- TRENDFOCUS forecast in 2018 that SSDs would go into more than 80% of notebooks and more than a third of desktop PCs by about 2022, with desktop and mobile hard drives still shipping for years (TRENDFOCUS figures quoted by StorageNewsletter, 2018).
- 284 exabytes of SSD capacity were shipped worldwide in 2023, up 2% from 2022, while all NAND flash shipped reached 779 exabytes (TRENDFOCUS figures quoted by StorageNewsletter, 2024).
SSDs in PCs

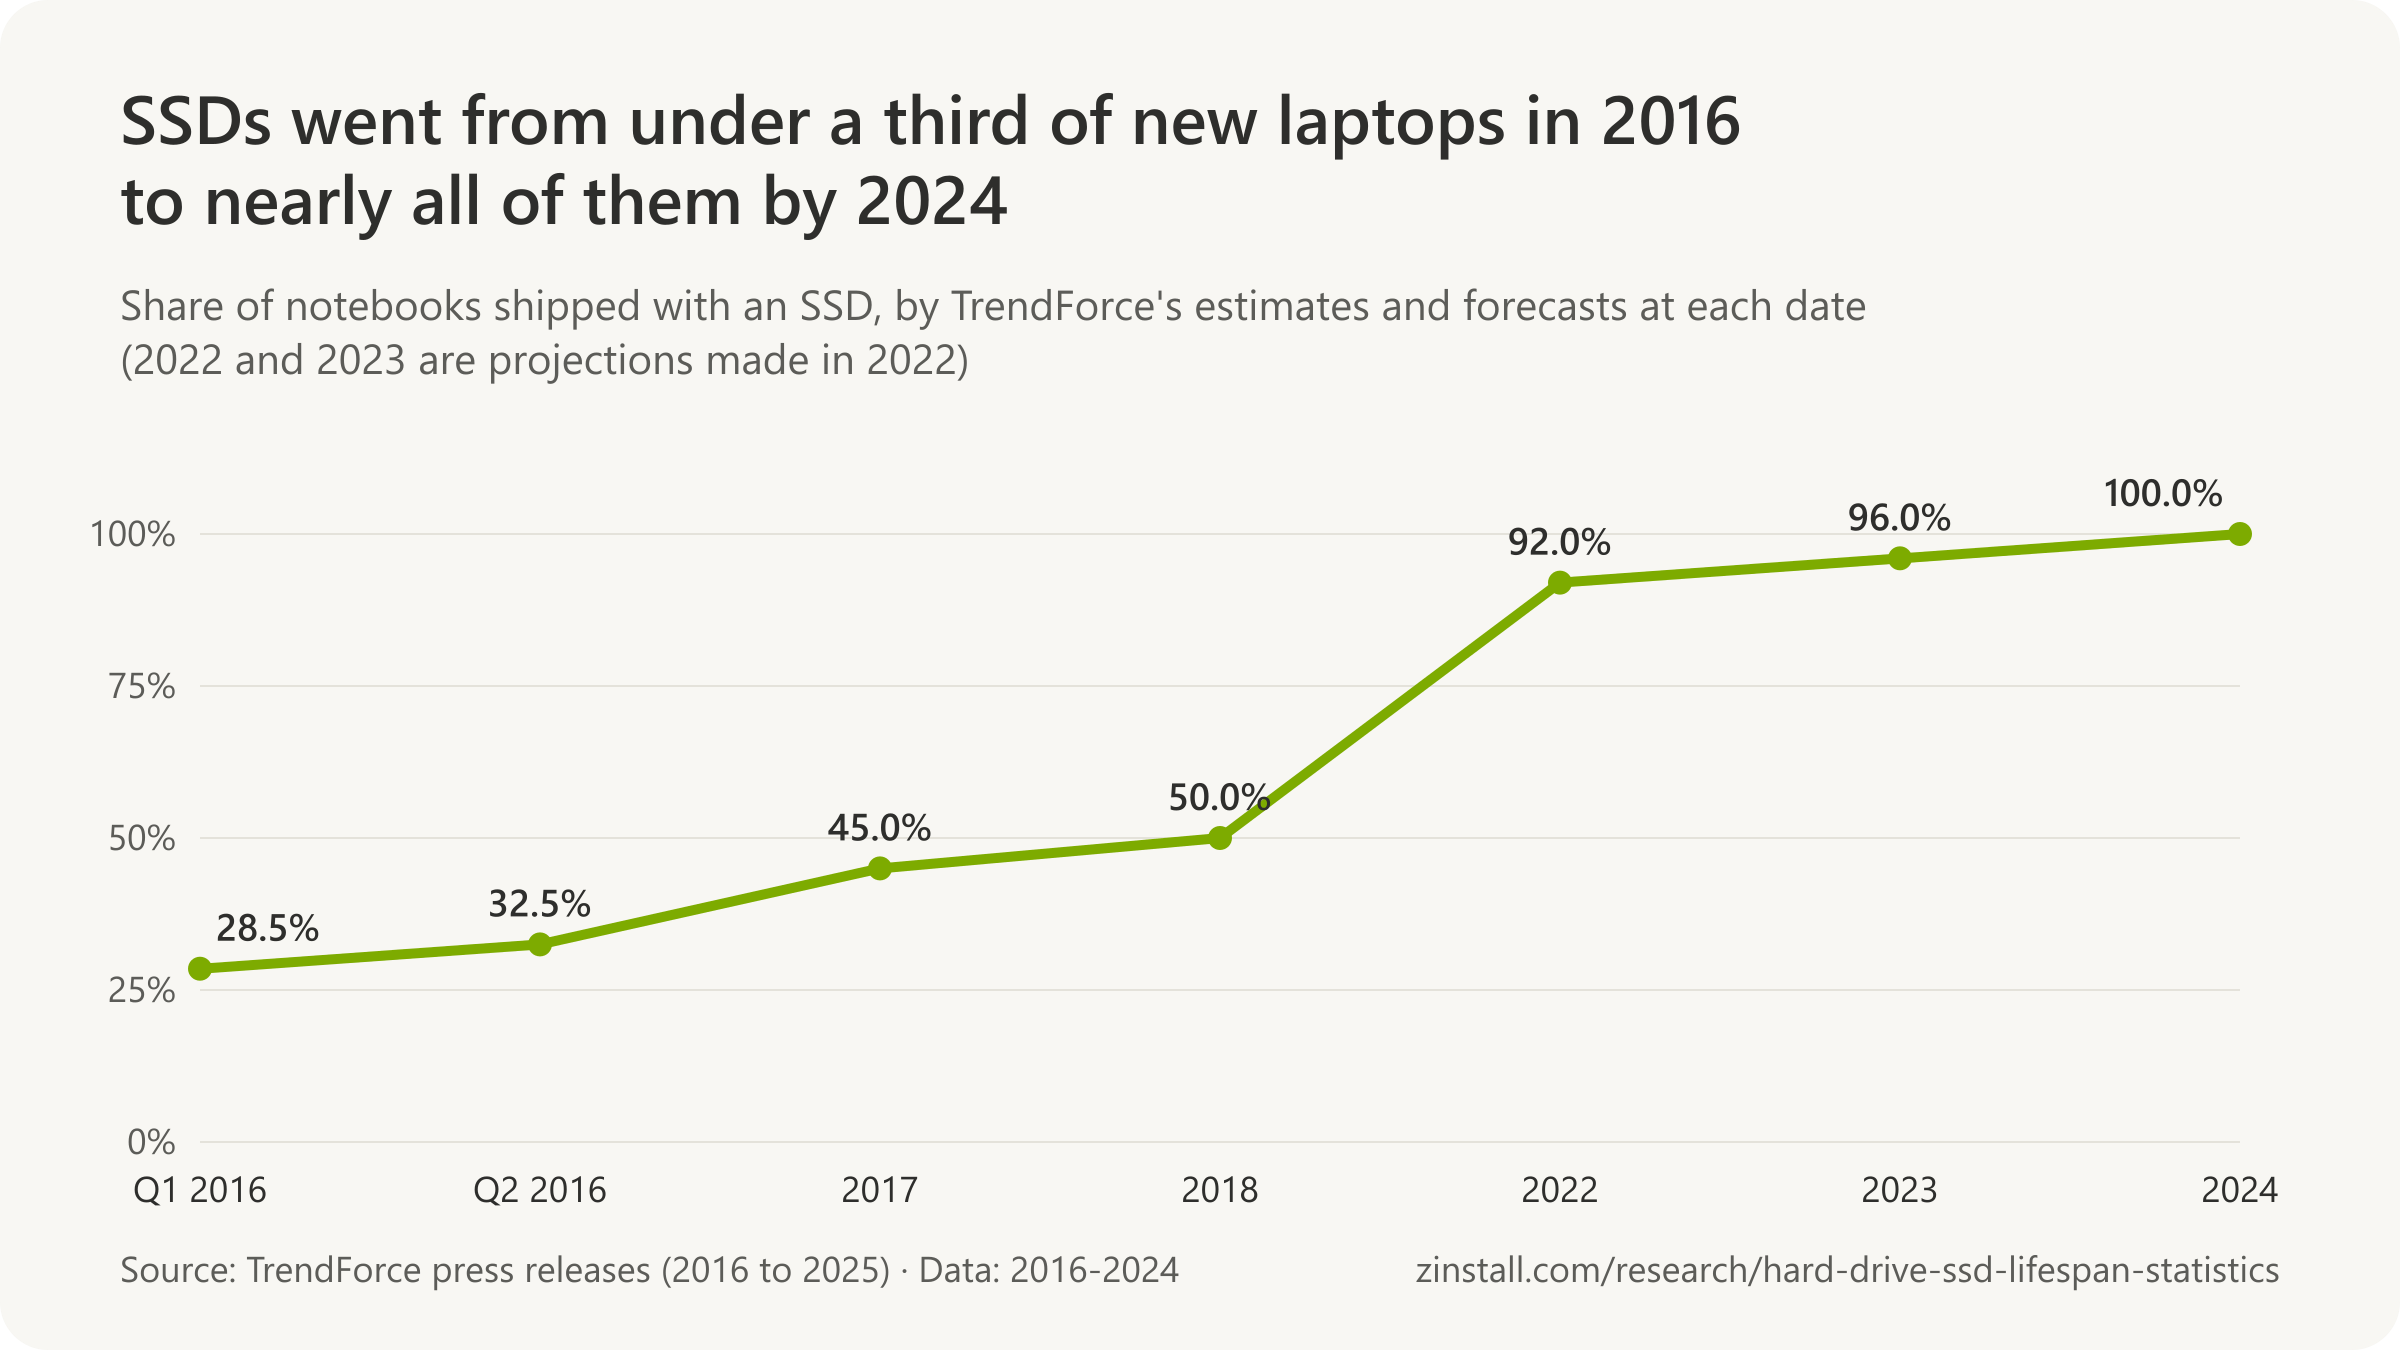
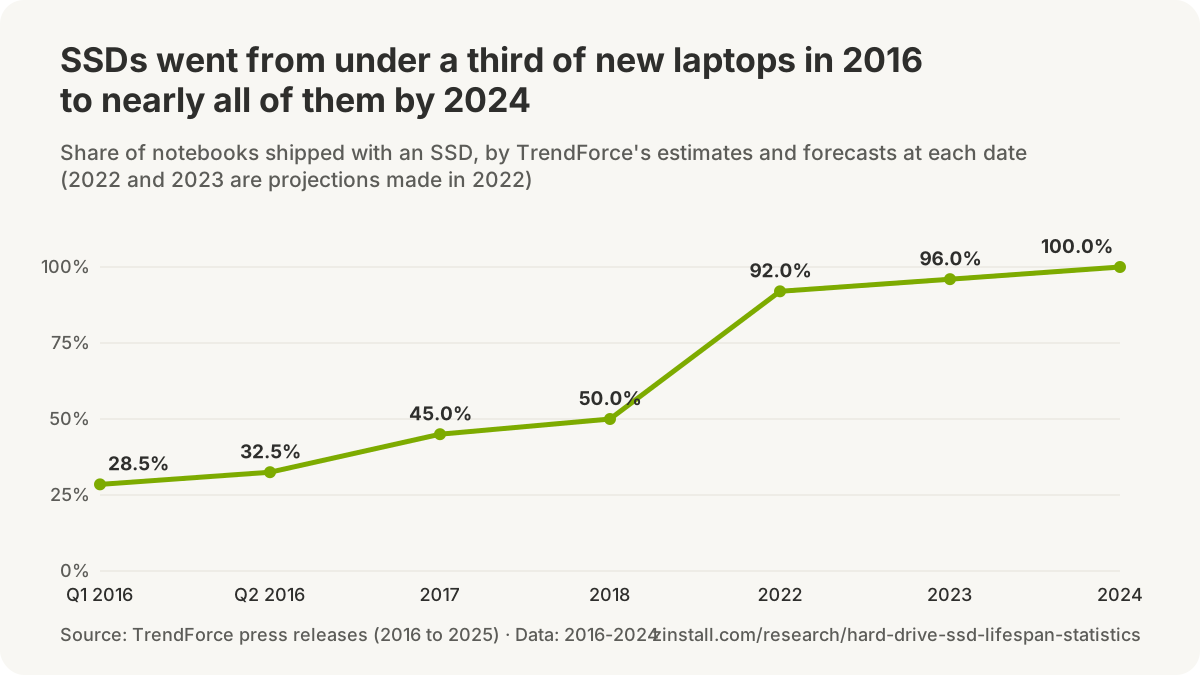
- 512GB laptop SSDs were quoted near the price of 512GB hard drives by the end of 2022, and the average client SSD held more than 500GB (TrendForce, 2022).
- TrendForce forecast in 2016 that 128GB SSDs would cost less than 500GB hard drives by the end of that year, and that 256GB SSDs would cost less than $5 more than 1TB hard drives (TrendForce, 2016).
- 85% of the consumer PCs in Avast's 2019 PC Trends data stored everything on a hard drive alone; 7.7% had only an SSD and 7.4% had both (Avast, 2019).
- 85.9% of the PCs in Avast's 2017 PC Trends data had only a hard drive; 7.4% had an SSD and 6.7% a hybrid of SSD and hard drive (Avast, 2017).
- 48.6% of the PCs in Steam's October 2026 hardware survey had more than 1 TB of total drive space, and 25.1% had 750 GB to 999 GB (Valve Steam Hardware and Software Survey, 2026).
- NAND flash contract prices were forecast to rise 15-20% in the fourth quarter of 2026, while PC brands cut the SSD capacity of mainstream models to hold down costs (TrendForce forecast, 2026).
- A 130% surge in combined DRAM and SSD prices by the end of 2026 was expected to raise PC prices by 17% compared with 2025 levels (Gartner forecast, 2026).
Prices and the 2025-2026 shortage

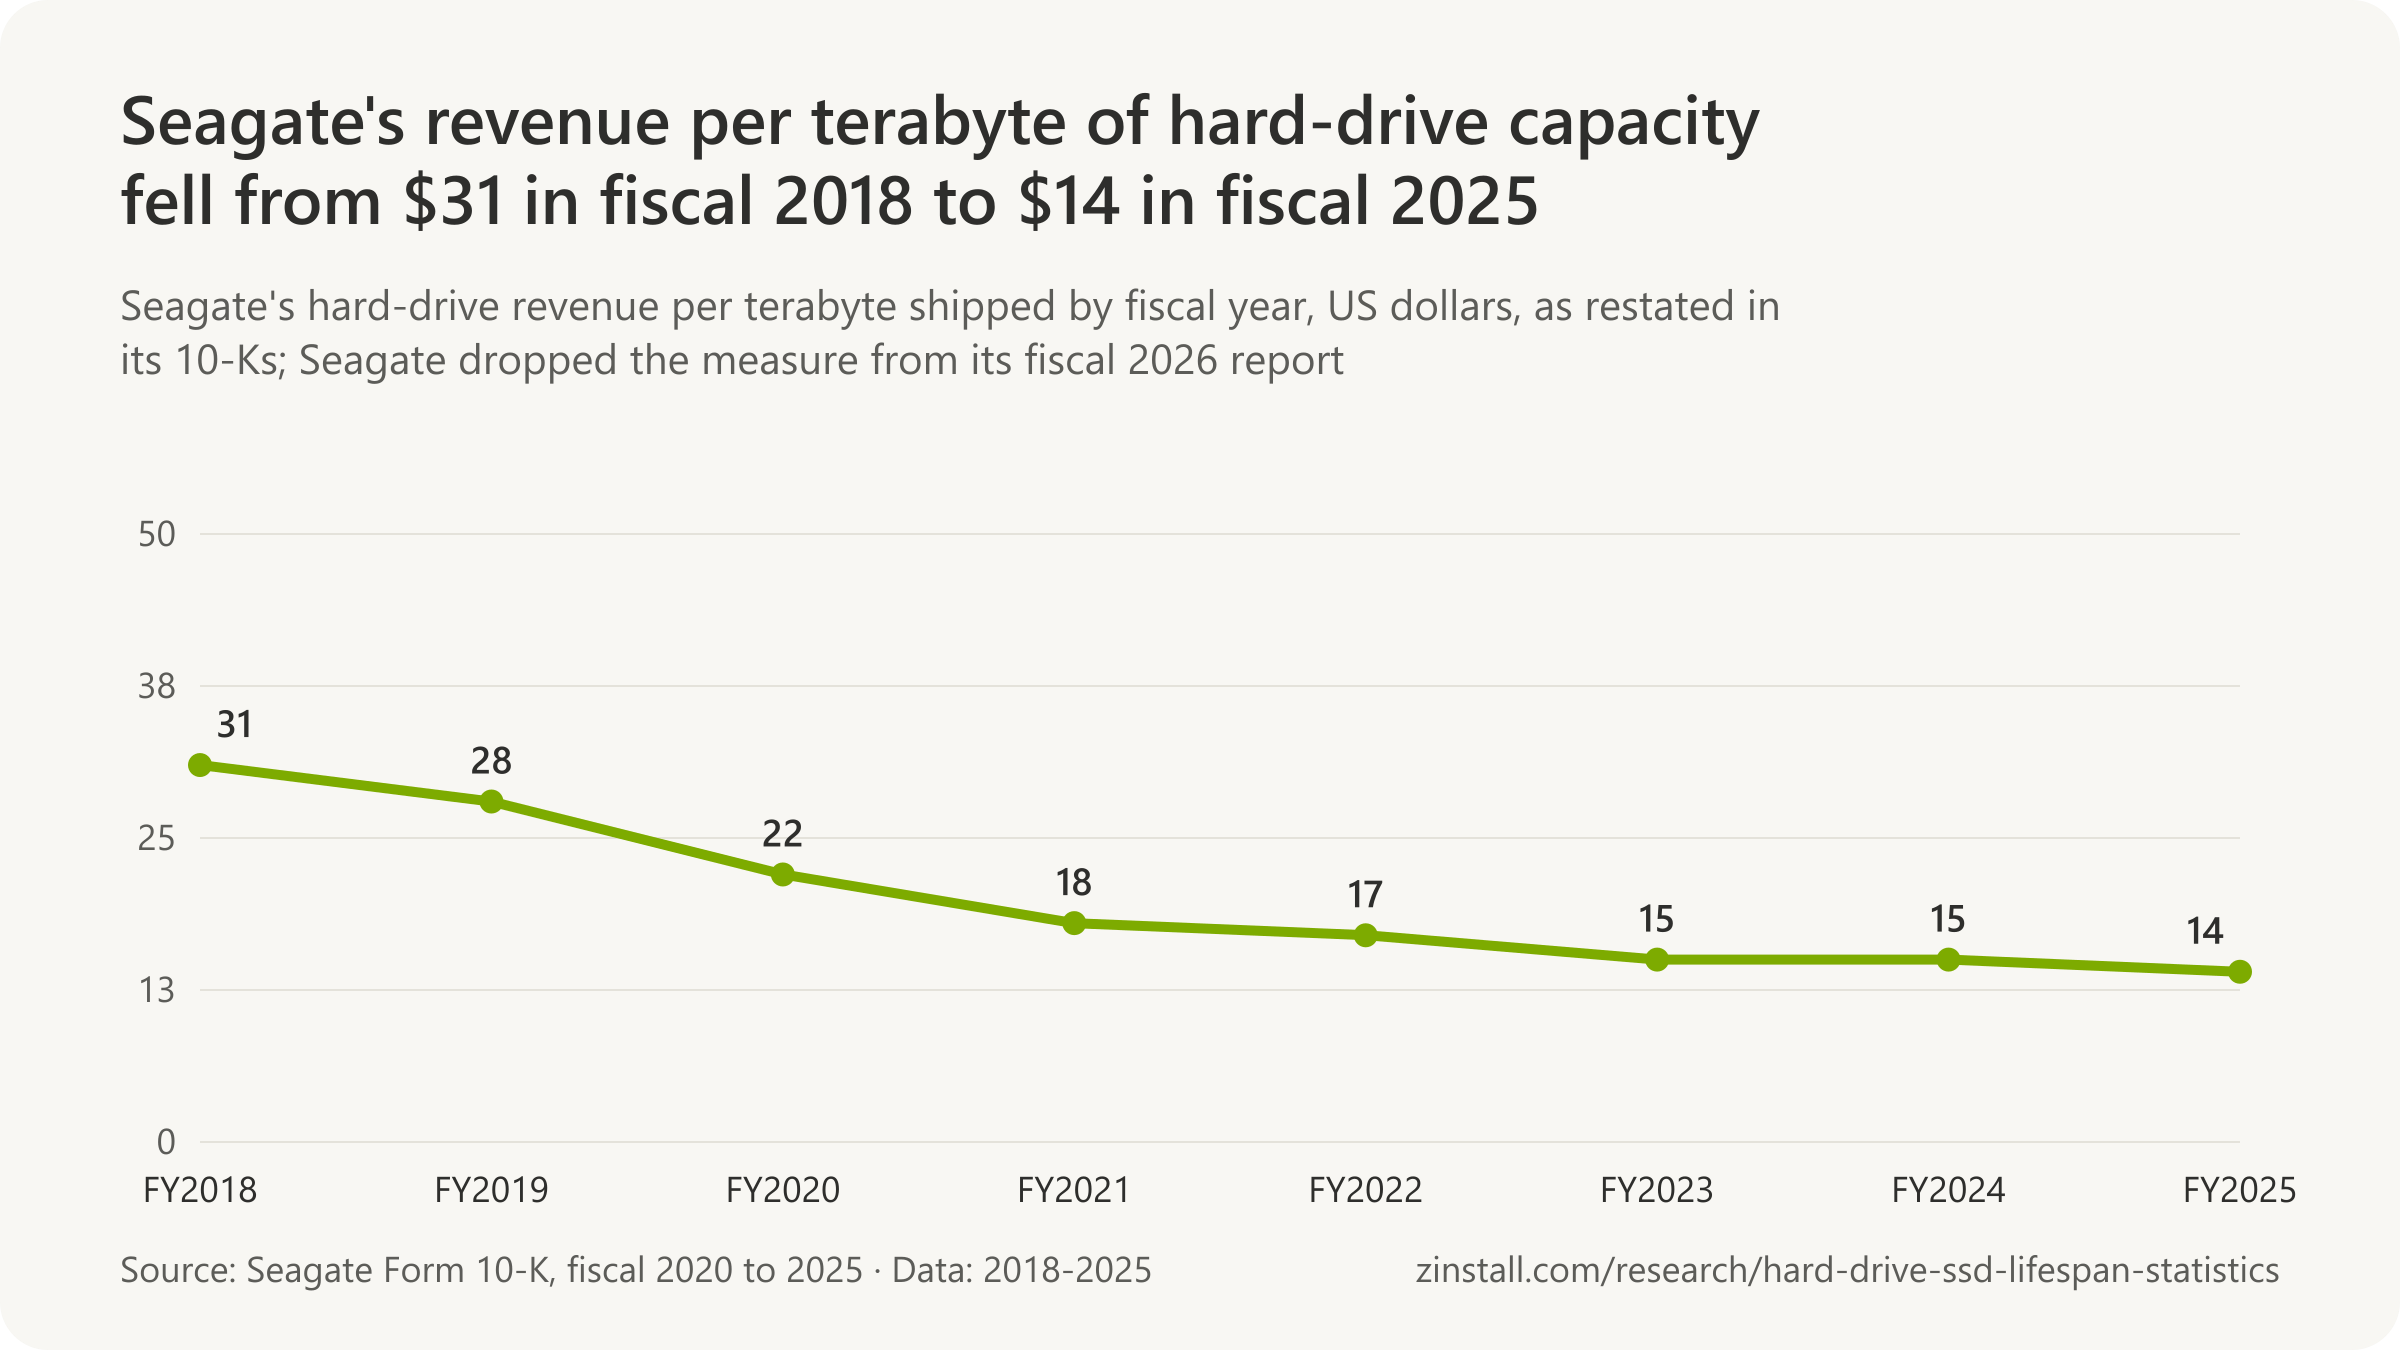

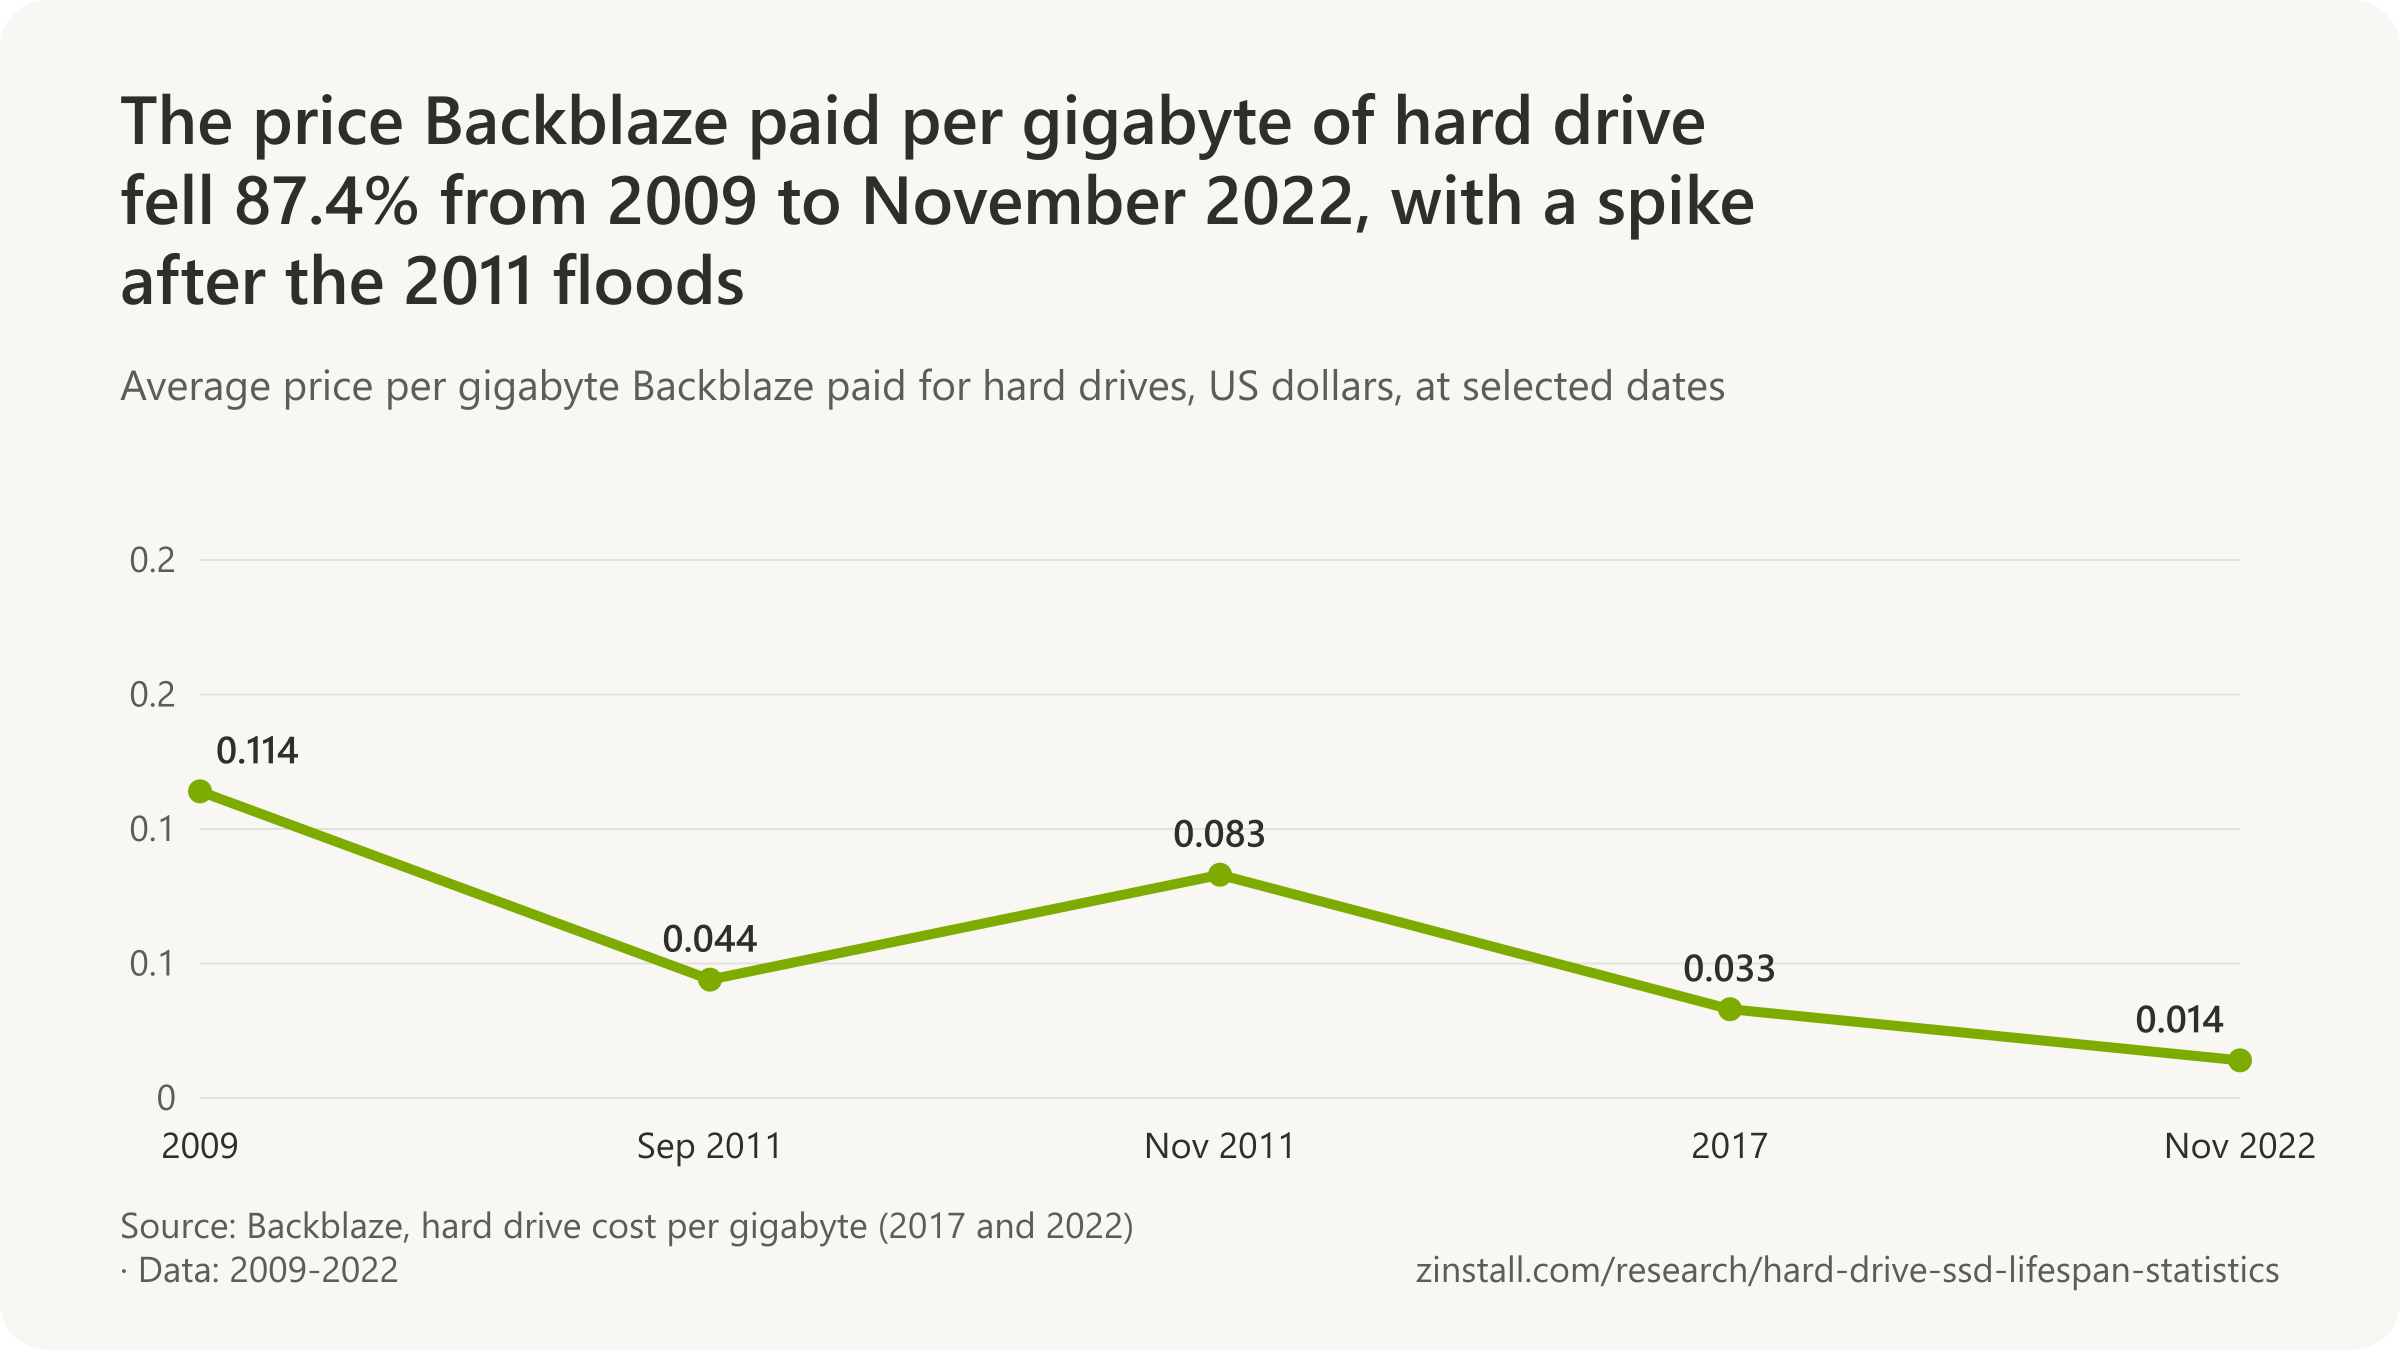

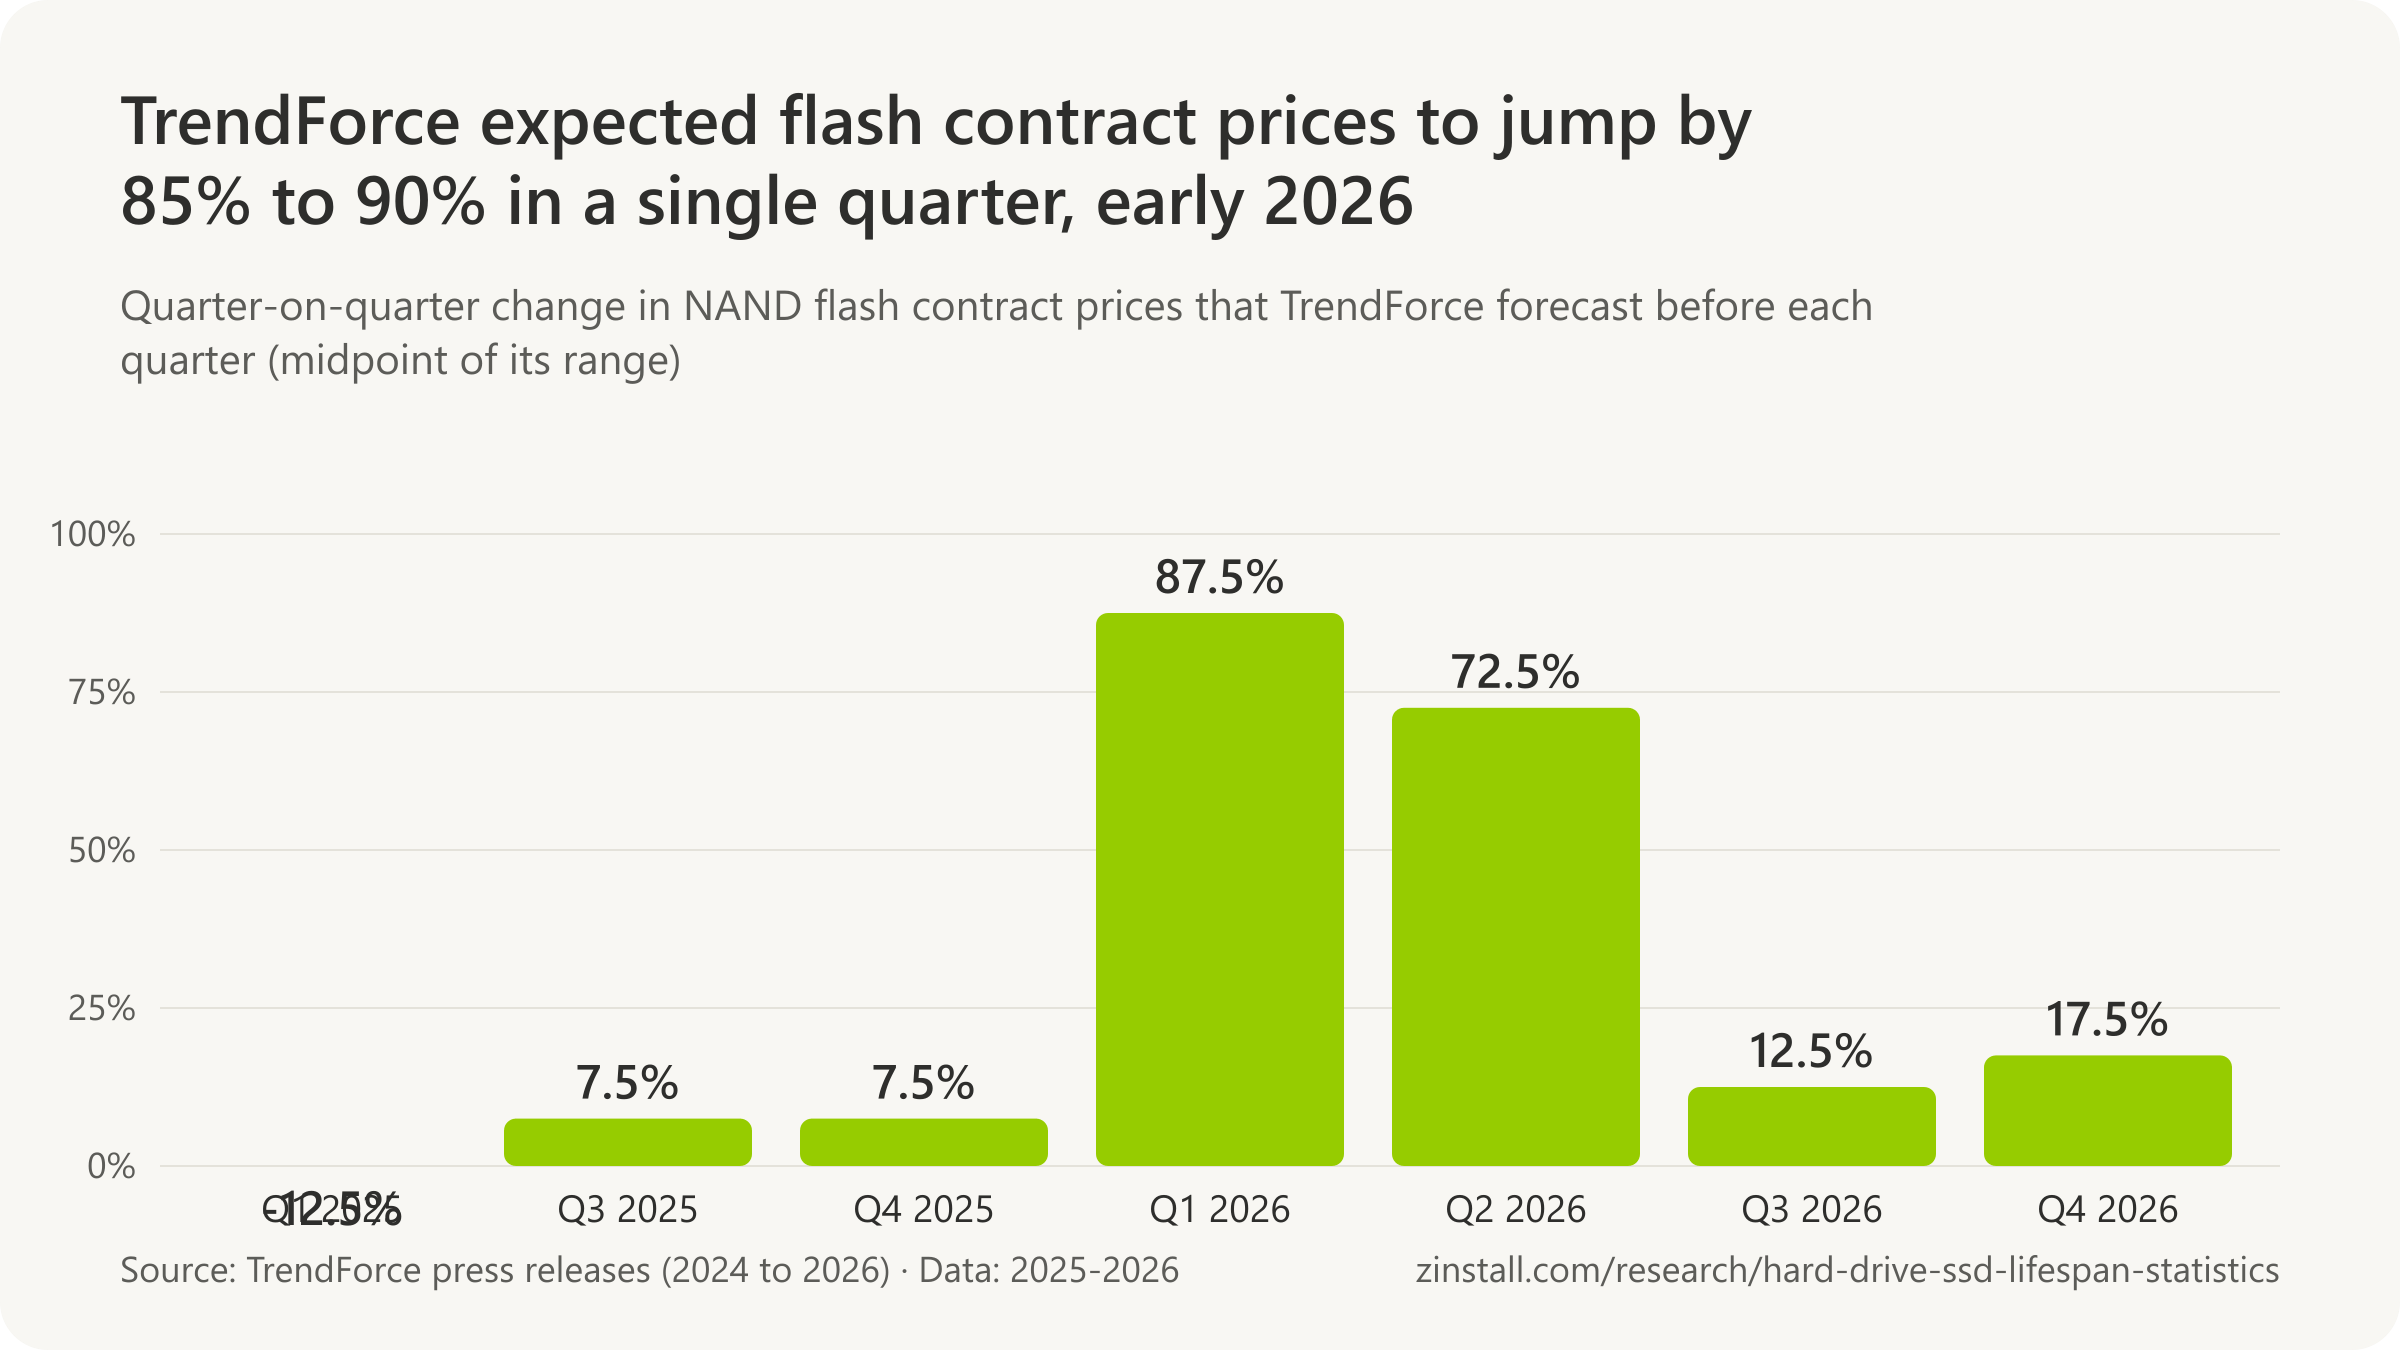
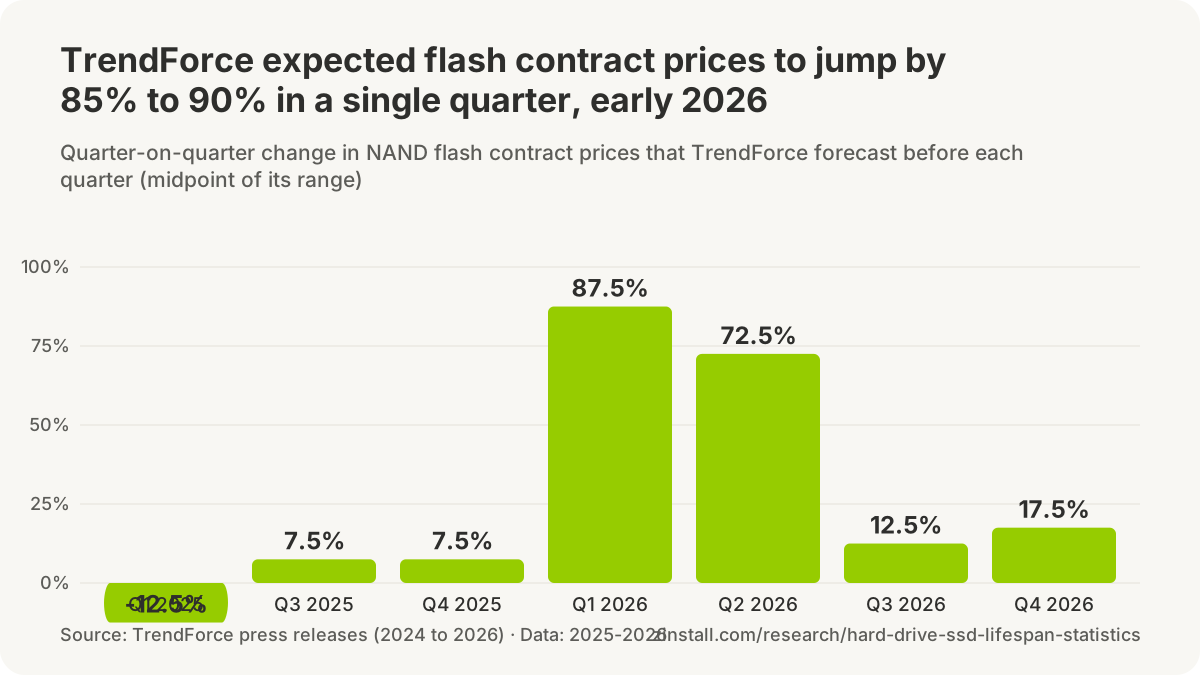
- 87.4% is how far the average price per gigabyte Backblaze paid for hard drives fell from 2009 to November 2022, about 0.52% a month (Backblaze, 2022).
- 200% to 300% was how much hard-drive prices jumped after the November 2011 Thailand floods, as Backblaze experienced it (Backblaze, 2015).
- 28.5 million hard drives were shipped by Western Digital in the quarter to 30 December 2011, after the Thailand floods submerged its main plant, against 52.2 million a year earlier (Western Digital, 2012).
- $199 million of charges and expenses related to the 2011 Thailand floods were booked by Western Digital in the quarter to 30 December 2011, and it expected pre-flood manufacturing capacity back only in the quarter ending September 2012 (Western Digital, 2012).
- Seagate took $30 of revenue per terabyte of hard-drive capacity it shipped in fiscal 2019, down from $41 in fiscal 2017; its later reports restate fiscal 2019 at $28 on a new basis (Seagate Form 10-K, 2019).
- About $195 to $207 was the average selling price of a hard drive from Seagate and Western Digital in the last quarter of 2025, with industry prices about 25% above their 1998 level because data-centre drives dominate (Coughlin Associates estimate, 2026).
- $0.015-0.016 per gigabyte (about $15-16 per terabyte) was the average price of hard-drive storage in 2025, up from $0.012-0.013, as makers passed on the cost of the move to HAMR, eroding hard drives' cost advantage over SSDs (TrendForce, 2025).
- More than 52 weeks was the lead time for nearline (data-centre) hard drives in 2025, up from a few weeks, as AI storage demand outran makers that had not added capacity (TrendForce, 2025).
- 20% to more than 60% was the rise in NAND flash wafer contract prices in a single month, November 2025, across all product categories (TrendForce, 2025).
- 29.3% of NAND flash revenue went to Samsung in the second quarter of 2026 and 13.6% to Kioxia, as the top five makers' revenue rose 77% in a quarter to $68.87 billion (TrendForce, 2026).
- More than 40% of NAND flash demand by bits comes from servers and nearly 40% from smartphones and notebooks together, and the flash market faces a 4-5% supply deficit in 2026 (TrendForce, 2026).
- $66 was Seagate's average selling price per hard drive in fiscal 2012, up 22% from $54, because of the limited industry supply after the Thailand floods (Seagate Form 10-K, 2012).
Flash makers
Sources: StorageNewsletter (2011-2024); Forbes (2023, 2025, 2026); Tom's Hardware; Western Digital Corporation (2010-2026); Seagate Technology (2010-2026); TrendForce (2016-2026); TRENDFOCUS; Avast (2017, 2019); Valve; Gartner, Inc.; Backblaze (2013, 2015, 2022); Hitachi Global Storage Technologies; HGST, a Western Digital company; Western Digital
Where do drive lifespan claims come from?
Hard drives last only 3 to 5 years, a device-repair company tells readers, citing no measurement (Asurion, 2026).
- The 3% failure rate often credited to Google comes from Carnegie Mellon's 2007 study, misattributed by a 2011 blog.
- 'Hard drives fail after 2.5 years' turned the average age of failed drives into a lifespan.
- An SSD maker says SSDs last 8 years and hard drives 4, pairing two unrelated failure rates.
- 'SSDs are replaced 25% less often than hard drives' is not in the Google study it cites.
- 'Almost 50% of hard drives fail too soon' came from a recovery lab's count of failed drives only.
| Page and claim | Figure claimed |
|---|---|
| Tom's Hardware: '21 percentage points lower' (2026) | 1.36% |
| IBTimes: 'unpowered SSDs lose data in a week' (2015) | a week |
| Ontrack: 'unpowered SSD data safe at least 10 years' (2016) | at least 10 years |
| GamersNexus: 'Seagate 14% annual failure rate' (2014) | 14% |
| Sandisk: '600 TBW at 20 GB a day is 82.2 years' (2025) | 82.2 years |
| Enterprise Storage Forum: 'oxide layer lasts 342 years' (2023) | 342 years |
| XDA: 'one brand fails twice as often' (2026) | twice as often |
| Phiston: 'median HDD life 6 years 9 months' (2024) | 6 years 9 months |
| Newegg: 'three to five years' credited to Backblaze (2021) | 3 to 5 years |
| Japanese site: 'HDD life 10,000 hours, 3 to 4 years' (2026) | 10,000 hours (3 to 4 years) |
Sources: Asurion; Mobile Outfitters; Enterprise Storage Forum (2023a, 2023b); Kingston Technology; N-able; BGR; Tom's Hardware; International Business Times UK; Ontrack; GamersNexus; SanDisk; XDA Developers; Phiston Technologies; Newegg; Exidea
More statistics (72)
The figures most often given for drive lifespans have no measurement behind them, or come from a real study whose measure changed on the way: an average age of failed drives turned into a lifespan, a population rating into years, one company's SSDs set against another's hard drives. Each figure below is what a page that ranks or is widely cited says, traced to its origin, or to none; a few restate their source faithfully.
'Hard drives last 3 to 5 years'
- Hard drives lasting only 3 to 5 years is how Asurion put it, citing no source; no measured study gives that range, and Backblaze's data-centre fleet had about 90% of drives still working at four years (Asurion, 2026).
- External hard drives lasting 3 to 5 years is how Secure Data Recovery summed up "most industry sources", naming none, before reporting that the 3,453 failed external drives in its own sample had a median of 190 days of power-on time (Secure Data Recovery, 2026).
- The average hard drive lasting 3 to 5 years is how SalvageData put it, citing no study; the measured survival data it does not cite (Backblaze, 2021) has about 90% of data-centre drives working at four years and 65% at six (SalvageData, 2026).
- Hard drives lasting three to five years on average is how Prosoft Engineering restated Backblaze's 2013 study of 25,000 drives, which reported 78% of its data-centre drives still alive after four years and gave no 3-to-5-year lifespan (Prosoft Engineering, 2020).
- Consumer hard drives typically lasting three to five years is how Newegg restated a 2013 Backblaze study, which reported 78% of its data-centre drives still working after four years and gave no 3-to-5-year lifespan (Newegg, 2021).
- An HDD lasting "between 3 to 5 years" is how SSD maker KingSpec put it, citing no source; no measured study gives that range (KingSpec, 2022).
- Hard drives lasting "about 10 years max" in reality is how Ontrack put it, citing nothing; Backblaze's fleet data has drives running past 10 years and gives no maximum (Ontrack, 2020).
- A 3 to 4 year average hard-drive life span is how IPVM summed up its own 2012 survey of surveillance integrators, a consensus of opinions rather than a measurement, set against Backblaze's projection of about six years (IPVM, 2013).
- Hard drives lasting four to seven years is how Enterprise Storage Forum put what "manufacturers say", naming none; drive makers publish MTBF or AFR ratings and warranty years, not a lifespan range (Enterprise Storage Forum, 2023).
- Hard-drive systems well over 30 years old still booting and reading error-free is how Ontrack described its engineers' experience, an anecdote with no count of drives tried or failed (Ontrack, 2016).
- Most SSDs lasting 5 to 10 years and most HDDs 3 to 5 years is how SSD seller Microflash put it, outlasting 'their 3- to 5-year manufacturer warranties', citing nothing for either range (Microflash, 2026).
- The average hard disk lasting somewhere between 3 and 5 years is how backup-software maker Archiware answered the question, citing no study, though it points readers to Backblaze's statistics further down (Archiware, 2021).
- Most hard drives having an expected lifespan of three to five years with regular use is how Datarecovery.com answered 'Can a hard drive last for 100 years?', citing no measurement, while adding that it still receives working drives made in the 1990s (Datarecovery.com, 2025).
- Hard drives lasting 3 to 5 years and an SSD 10 years is how EaseUS summed up drive life on its German site, citing nothing; it adds that most brands give external drives 3 to 5 years, naming none (EaseUS, 2022).
- 10% to 12% more drives failing each year, so a 50% chance of failure after three years, is how French recovery firm Chronodisk put it on television, citing nothing; even 12% a year compounds to about 32% over three years, and Backblaze's measured fleets lose about 1.4% a year (Chronodisk, 2026).
- An average HDD life of 10,000 hours, three to four years at eight hours a day, is how Japanese review site HonNe (Exidea) put it, adding that PC makers' 3-to-4-year warranties assume the drive dies by then, all without a source (HonNe, 2026).
- SSDs lasting 5 to 10 years under normal use and HDDs 3 to 5 years is how SSD maker Crucial answered its own FAQ, citing nothing; Crucial's own ratings for its MX500, P3 Plus and T500 SSDs are five-year warranties capped by rated writes, not lifespans (Crucial, 2026).
'SSDs last 5 to 10 years'
- SSDs having "a long lifespan of about 10 years or more" is how Asurion put it, citing no source; the SSD field studies measure replacement and error rates over four to six years, not a 10-year lifespan (Asurion, 2026).
- SSDs lasting 10 years under normal workloads, up from an older estimate of five to six years, is how Newegg reported "some estimates", naming none (Newegg, 2021).
- An NVMe SSD's average lifespan being 10 years is how KingSpec put it, citing no measurement; no field study reports an average NVMe lifespan (KingSpec, 2022).
- An SSD "age limit" of around 10 years is how N-able (first published as SolarWinds MSP) put "current estimates", naming none; the Google study it cites next followed drives for four to six years and gives no age limit (N-able, 2019).
- An SSD "age limit" of around 10 years is how Ontrack put "the most recent estimates" in 2020, naming none, in a sentence nearly identical to SolarWinds MSP's of 2019 (Ontrack, 2020).
- Most SSDs lasting 5 to 10 years under normal use, and often longer, is how SanDisk put it, citing no measurement; the range describes no field study, and SanDisk's own commitment on its WD Black and WD Blue SSDs is a five-year warranty capped by rated writes (SanDisk, 2025).
- An SSD lasting 8 years on average with a 0.9% annualized failure rate, against 4 years and 1.7% for a hard drive, is how Kingston put it, citing nothing; the two rates match Backblaze's 2023 figures for different measures (boot-drive SSDs over their lifetime, data-centre HDDs in 2023 alone), and no source gives the 8 and 4 year lifespans (Kingston, 2026).
- SSDs being 47% less likely to fail and lasting twice as long as hard drives is how Kingston read its own unsourced pairing of a 0.9% and a 1.7% failure rate, rates that come from different Backblaze measures (Kingston, 2026).
- An SSD lasting about 8 years with a 0.9% failure rate, against roughly 4 years and 1.7% for hard drives, is how SalvageData repeated Kingston's unsourced pairing of two different Backblaze measures (SalvageData, 2026).
- A typical SSD lasting 10 years or more with proper care is how Phiston Technologies put it, citing nothing, directly after a sourced HDD figure (Phiston Technologies, 2024).
- One hard drive brand failing twice as often as another is how XDA headlined a peer-reviewed analysis of 443,156 Backblaze data-centre drives, which found adjusted failure rates for HGST about 41% and WD about 52% of Seagate's, with Toshiba slightly above Seagate (XDA, 2026).
- Most hard drives lasting somewhere between 5 and 10 years is how XDA read the 13-year Backblaze dataset behind the 443,156-drive study, a lifespan range the study does not give; it reports relative failure rates by brand, age, capacity and temperature (XDA, 2026).
- SSDs lasting 5 to 10 years and flash storage about 10 years is how Enterprise Storage Forum put the "planned life expectancy" of drives, citing no source for either range (Enterprise Storage Forum, 2023).
- A manufacturer's SSD lifespan estimate of 5 to 7 years, which light use could stretch past 10 and heavy use cut to 3 to 5, is how PCWorld framed SSD life, naming no manufacturer or estimate (PCWorld, 2024).
- A modern SSD lasting 8 years on average with a 0.9% failure rate against 4 years and 1.7% for an HDD is how Kingston put it on its German blog, the same unsourced pairing as its English post (Kingston, 2026).
- A modern SSD lasting 8 years on average with a 0.9% failure rate against 4 years and 1.7% for a hard drive is how Kingston put it on its French blog, the same unsourced pairing as its English post (Kingston, 2026).
- An average SSD lifespan of 8 years with a 0.9% failure rate against 4 years and 1.7% for a hard drive is how Kingston put it on its Japanese blog, the same unsourced pairing as its English post (Kingston, 2026).
Ratings turned into years
- An SSD rated 600 TBW lasting 82.2 years at 20GB of writes a day is how SanDisk turned an endurance rating into a lifespan, though TBW is the warranty's write limit and SSDs fail from controller, firmware and age-related causes long before wear-out (SanDisk, 2025).
- MakeUseOf explained that an MTBF of 1.5 million hours does not mean a drive lasts 171 years, correctly treating MTBF as a population failure rate (MakeUseOf, 2015).
- 1.5 million hours MTBF converting to roughly 171 years but meaning about a 0.58% annual failure rate is how SSD maker OSCOO explained the rating, correctly (OSCOO, 2026).
- 1.5 million hours of MTBF being "equivalent to more than 171 years" is how ITIGIC framed the rating before explaining that nobody tests a part for 171 years and the figure is a prediction (ITIGIC, 2020).
- An HDD's MTBF of about half a million hours, approximately 57 years, is how Enterprise Storage Forum put it, turning a rating into years, with SSD MTBF 'reported' at 2.5 million hours and no source for either (Enterprise Storage Forum, 2023).
- An SSD's oxide layer lasting 342 years is how Enterprise Storage Forum worked out SSD lifespan from 3,000 write cycles, a 1,000GB capacity, a write amplification of 5 and 1,750GB written a year, a rated-endurance sum presented as a lifespan (Enterprise Storage Forum, 2023).
- SSDs being about 20 times more resilient than hard drives, withstanding 1,500G against 70 to 80G, is how Kingston presented shock figures as 'experimental testing', citing no test; such figures are datasheet operating-shock ratings measured under set pulse conditions, not tests of drives in use (Kingston, 2026).
Backblaze's figures as others restated them
- Drives failing at 5.1% a year for their first 1.5 years, 1.4% for the next 1.5 years and 11.8% a year after three years is how IPVM restated Backblaze's 2013 lifespan post on about 25,000 consumer-grade drives in its data centre, the same day it was published (IPVM, 2013).
- A median HDD life expectancy of six years and nine months is how Phiston Technologies restated Backblaze's 2021 estimate, which Backblaze extrapolated from six years of data on its data-centre drives and said it lacked the data to be certain of (Phiston Technologies, 2024).
- Seagate having a 14% annual failure rate across all of its drives is how GamersNexus restated Backblaze's January 2014 post, whose chart puts only Seagate's 1.5TB drives near 14% while its 3TB drives were at 9.8% and its 4TB drives at 3.8% (GamersNexus, 2014).
- Lifetime failure rates ranging from about half a percent to nearly 6% across 354,415 hard drives is how XDA restated Backblaze's Q2 2026 Drive Stats, whose lifetime table covers 353,041 drives with a fleet-wide lifetime AFR of 1.41%, the 354,415 count being the quarterly table's (XDA, 2026).
- "When HDDs fail, it's typically within 3 years of operation" is how TechSpot headlined Backblaze's analysis of 17,155 failed data-centre drives, whose figure is the average age of the drives that had failed (two years six months) in a fleet where about 1.4% of drives failed a year (TechSpot, 2023).
- Hard drives failing after two and a half years on average is how Enterprise Storage Forum restated Backblaze's average age of 17,155 failed drives, turning an age at failure into a lifespan; the wording is the one a Facebook post shows in Google's results (Enterprise Storage Forum, 2023).
- A hard-drive lifespan of two years and 10 months is how Network World restated Secure Data Recovery's 2023 sample of 2,007 failed drives sent to it for recovery, whose figure is the average power-on time of drives that had failed (Network World, 2023).
- An annualized failure rate of 1.36% for 2025 that is "21 percentage points lower than last year" is how Tom's Hardware headlined Backblaze's 2025 report, where the rate fell from 1.55% in 2024, a drop of 0.19 points (Tom's Hardware, 2026).
- A 2025 annualized failure rate of 1.13%, or one drive in 88, is how BGR reported Backblaze's year, but 1.13% was the fourth quarter alone; Backblaze's 2025 annual rate is 1.36% across 344,196 drives, about one in 74 (BGR, 2026).
- Hard drives lasting about four years on average is how Lifehacker read Backblaze's finding that about 80% of its data-centre drives survived four years, turning a survival share into an average life (Lifehacker, 2015).
- Hard drives failing at 6.26% a year against 0.79% for SSDs is how Production Expert led its summary of Backblaze's first SSD comparison, figures Backblaze itself called unfair because the boot HDDs were far older than the SSDs; matched by age, the rates were close (Production Expert, 2021).
- SSDs failing at 0.98% a year against 1.64% for hard drives is how ULINK DA restated Backblaze via Blocks & Files, a pairing of Backblaze's 2022 SSD boot-drive rate with a separate hard-drive table rather than an age-matched comparison (ULINK DA, 2025).
- 78% of drives living longer than four years and only 22% dying sooner is how ComputerWeekly.de restated Backblaze's 2013 data on consumer drives running around the clock in its data centre, a faithful restatement still ranking for German lifespan searches (ComputerWeekly.de, 2014).
- A warning to beware of any backup drive older than three years is how W&V turned Backblaze's average age of 17,155 failed drives (two years six months) into advice, adding that the drives fail even faster than Secure Data Recovery had found (W&V, 2023).
- A 5.1% risk of failure in a drive's first year, falling to 1.4% in years two and three, is how Tom's Guide France restated Backblaze's 2013 rates, which applied to the first 18 months and to the following 18 months, adding that 80% of drives on the market survive four years (Tom's Guide France, 2013).
- A median HDD life of six years and nine months, as Backblaze estimated from its data-centre drives with the caveat that its data past six years is thin, is how ITmedia's @IT restated the 2021 analysis in Japanese, faithfully (@IT, 2022).
Studies restated
- SSDs being replaced about 25% less often than HDDs is how N-able (first as SolarWinds MSP) restated the 2016 Google and University of Toronto flash study, which reports 4% to 10% of flash drives replaced within four years against 2% to 9% a year for hard drives in earlier studies, and no 25% figure (N-able, 2019).
- SSDs being replaced about 25% less often than HDDs is how Ontrack restated the 2016 Google and University of Toronto flash study, which reports 4% to 10% of flash drives replaced within four years against 2% to 9% a year for hard drives in earlier studies, and no 25% figure (Ontrack, 2020).
- Every 10°C hotter making a hard drive about 23% more likely to fail is how XDA put the study's finding, which compounds a 2.1% higher failure rate per extra degree of average temperature in Backblaze's data-centre drives to 23.1% (XDA, 2026).
- Google finding a 3% hard-drive failure rate against the makers' 0.88% is how Mobile Outfitters restated the 2007 studies, but the 3% (3.01% weighted average) and the 0.88% datasheet rate are Carnegie Mellon's findings, while Google's paper gave rates by age from 1.7% to 8.6% (Mobile Outfitters, 2011).
- A 3% mean annualized failure rate over one to five years is how Wikipedia summarises the 2007 Carnegie Mellon study, correctly, next to Google's 2007 range of 1.7% for first-year drives to over 8.6% for three-year-old drives (Wikipedia, 2026).
- About 7% a year for drives older than two years is how Ask Leo! summed up Google's 2007 paper, a fair reading of its rates by age (8.0% at two years, 8.6% at three, 5.9% at four, 7.3% at five) for drives in Google's data centres (Ask Leo!, 2007).
- Almost 50% of hard drives failing way too soon is how BGR headlined Secure Data Recovery's 2026 sample, in which 49.8% of the 5,106 failed drives sent for recovery had run less than a year, a share of failures, not of all drives (BGR, 2026).
- SSDs being replaced 25% less often than ordinary hard drives is how EaseUS repeated the untraceable SolarWinds MSP and Ontrack claim on its German site, with no source (EaseUS, 2022).
- 1.7% of Google's 100,000 drives replaced in their first year, 8% in the second and 8.6% in the third is how Clubic restated Google's 2007 study, faithfully (Clubic, 2007).
Unpowered SSDs
- An SSD left powered down not failing for "around 5 to 6 years" is how KingSpec reworded Ontrack's 2016 line that data degradation should not occur for at least 10 years, changing the number and citing nothing (KingSpec, 2022).
- Data on an unpowered SSD not degrading for at least 10 years in optimum storage is how Ontrack put it in 2016, citing nothing; JEDEC's requirement for client SSDs at the end of their rated endurance is one year powered off at 30°C, and Ontrack itself adds that TLC flash can lose data within months (Ontrack, 2016).
- SSDs starting to lose data if left without power for as little as a week is how IBTimes UK reported a JEDEC presentation by Seagate's Alvin Cox, whose tables concern worn-out drives stored hot; Cox later said 'This all pertains to end of life' (IBTimes UK, 2015).
- A powered-off SSD at 104°F (40°C) possibly losing data after a couple of weeks is how PCWorld restated Alvin Cox's JEDEC tables three days after IBTimes, before PCWorld itself reported they apply only to worn-out drives (PCWorld, 2015).
- "This all pertains to end of life" is how Seagate's Alvin Cox, author of the JEDEC presentation behind the one-week claim, put it to PCWorld, which reported that even a worn-out SSD would keep data a year stored at about 30°C under the original tables (PCWorld, 2015).
Other claims
- Half of hard-drive failures stemming from physical damage such as drops is how Payam Data Recovery summarised its own lab's 30,000 drives (2020 to 2025), giving no counts, categories or method behind the 50-50 split (Payam Data Recovery, 2025).
Sources: Asurion; Secure Data Recovery Services; SalvageData Recovery Services (2026); Prosoft Engineering; Newegg; KingSpec; Ontrack (2016, 2020); IPVM; Enterprise Storage Forum (2023); Microflash; Archiware; Datarecovery.com; EaseUS; Chronodisk; Exidea; Crucial; N-able (2019); SanDisk; Kingston Technology (2026); Phiston Technologies; XDA Developers (2026); PCWorld (2015, 2024); MakeUseOf; OSCOO; ITIGIC; GamersNexus; TechSpot; Network World; Tom's Hardware; BGR; Lifehacker; Production Expert; ULINK Technology; ComputerWeekly.de; W&V; Tom's Guide France; @IT; Mobile Outfitters; Wikipedia; Ask Leo!; Clubic; International Business Times UK; Payam Data Recovery
Data. All 1,254 statistics on this page, each with its source, verbatim quote and locator: CSV · JSON. Charts and figures on this page may be reused with a link to https://www.zinstall.com/research/hard-drive-ssd-lifespan-statistics as the source. Original publishers retain attribution.
Data behind each chart (CSV, 61 files)
- Backblaze's hard drives failed at 1.36% in 2025, and between 0.93% and 1.89% a year since 2018
- In Backblaze's 2025 data, failures peaked at 4.25% a year at age 10; in its 2013 data they peaked at 13.73% at age 3
- SSD fleets have failed or been replaced at 0.2% to 1.2% a year in the studies that published a rate
- In their fifth year of service, Backblaze's SSD boot drives failed at 0.92% against 3.55% for its hard-drive boot drives
- Western Digital drives have failed least in Backblaze's data centres, 0.60% a year over their service lives
- Nearly a quarter to nearly two fifths of failed drives gave no warning sign before they failed, in every study that checked
- Young hard drives failed more when cool and three-year-old drives far more when hot, in Google's 2007 data
- Six SSDs in a 2013-2015 write-to-death test wrote 700 TB to 2.4 petabytes before they died
- An MTBF of 1 million hours means about 0.88% of drives failing a year, not a century of life
- Six in ten failed external hard drives sent to one US recovery lab had died in their first year of use
- A worn-out consumer SSD keeps data about two years unpowered at 25 °C, but two weeks at 55 °C
- Firmware bugs have disabled SSDs at a fixed count of power-on hours, from 1,700 to 70,000
- Recovering a physically failed drive can cost $1,500 to $3,000 or more at US labs' published prices
- One in ten pressed CDs is expected to fail within 25 years, by the Library of Congress's accelerated-ageing tests
- 124 million hard drives shipped worldwide in 2025, a fifth of the 651 million of 2010
- Backblaze's yearly hard-drive failure rate fell from over 6% in 2014 to under 2% a year from 2016 on
- Backblaze's quarterly hard-drive failure rate ranged from under 1% to over 2% from 2016 to mid-2026
- Over their whole service, Backblaze's drives in use have failed at 1.3% to 2.0% a year
- Backblaze's drive fleet grew from 27,000 hard drives in 2013 to almost 350,000 in 2025
- In Google's 2007 study, drives failed at 1.7% in their first year and 8.6% at three years
- Drive replacements rose with age in a five-year supercomputer log, with no flat middle
- Half of the failed hard drives sent to one US recovery lab had run less than a year
- NetApp's enterprise SSD models were replaced at 0.07% to almost 1.2% a year
- Alibaba's NVMe SSD models were replaced at 0.26% to 2.34% a year
- Alibaba's 3D-TLC SATA SSDs failed at over 3% a year, several times its MLC models
- About 5% of the drives of most SSD models in Google's data centres were replaced within four years, about 10% for the worst
- A fifth to nine tenths of Google's flash drives hit at least one uncorrectable error, depending on the model
- Between about a third and nine tenths of Google's flash drives developed bad blocks, depending on the model
- Microsoft's consumer-class data-centre SSDs failed at about 0.4% to 1.0% a year, its enterprise model at about 0.14%
- Backblaze's SSD boot drives failed at under 1.3% a year from 2019 to 2022
- Backblaze's hard-drive boot drives failed more each year from year 4, while its SSDs stayed near 1%
- At a large French retailer, SSDs came back as faulty more often than hard drives until 2013, then less
- Seagate's failure rate in Backblaze's fleet fell from over 10% in 2013 to under 2%, while HGST's rose to about 3% as its drives aged
- Toshiba and Seagate each make about a third of Backblaze's drives, Western Digital about a quarter and HGST under a tenth
- At a French retailer, the four hard-drive brands still sold in 2016 came back faulty at 0.82% to 1.26%
- At a French retailer, SSD return rates fell below 0.5% for every brand still sold in 2016, after OCZ's peaked above 5%
- The Seagate 3 TB drive that failed badly at Backblaze was returned to a French retailer at 3.36% at launch, under 1% by 2016
- In Backblaze's 2022 data, 10 TB drives failed most and 6 TB and 16 TB drives least; capacity and drive age go together
- Bad sectors and failed heads were the most common faults in hard drives sent to recovery labs
- Popular 1 TB SSDs are rated for 220 to 800 TB written, five of these eleven for 600 TB
- An SSD's rated endurance grows with its capacity: each doubling of capacity roughly doubles the TBW
- Each extra bit per flash cell cuts rated write cycles: from about 100,000 for SLC to about 1,000 for QLC
- Lexar gives the same order: SLC lasts about 100 times as many write cycles as QLC
- In c't's write-to-death test, published in 2017, a Samsung 850 Pro wrote 9.1 petabytes, about 60 times its rating
- Makers rate desktop hard drives for up to 120 TB of reads and writes a year, standard NAS drives for 180 TB, pro NAS and enterprise drives for 550 TB
- Desktop hard drives mostly carry two-year warranties and NAS drives three; enterprise, NAS Pro and WD_BLACK drives five
- Standard NAS and surveillance drives are rated at 1 to 1.2 million hours MTBF, pro NAS, AI surveillance and enterprise drives at 2.5 million; desktop lines give none
- External drives carry one- to five-year warranties; Seagate gives the same drive one year in the Americas and three in Asia-Pacific
- About 72,000 drives were sent for data recovery in Japan in 2024, down from 85,000 in 2018
- External drives made up about a fifth of the drives sent for recovery in Japan from 2018 to 2024
- A worn-out enterprise SSD keeps data about two years unpowered at 25 °C and two weeks at 55 °C
- Hard-drive shipments fell every year but one from 2014 to 2023, then held at about 124 million
- Hard-drive capacity shipped rose from 458 exabytes in 2013 to 1,621 in 2025 while unit sales fell
- Seagate shipped 789 exabytes of hard-drive capacity in fiscal 2026, seven times its fiscal 2011 total
- Seagate's revenue per terabyte of hard-drive capacity fell from $31 in fiscal 2018 to $14 in fiscal 2025
- Seagate and Western Digital each shipped 146 million to 249 million hard drives a year until fiscal 2016, then stopped reporting units
- SSDs went from under a third of new laptops in 2016 to nearly all of them by 2024
- Western Digital and Seagate each ship about 40% of the world's hard drives, Toshiba about 17%
- The largest hard drive went from 1 TB in 2007 to 44 TB in 2026
- TrendForce expected flash contract prices to jump by 85% to 90% in a single quarter, early 2026
- The price Backblaze paid per gigabyte of hard drive fell 87.4% from 2009 to November 2022, with a spike after the 2011 floods
Methodology
What we included. Backblaze's own Drive Stats reports, workbooks and data files; peer-reviewed and industry field studies (Google, Carnegie Mellon, Microsoft, NetApp, Alibaba, Facebook, Tencent, EMC, the University of Toronto, the University of Essex and others); the makers' datasheets, warranty pages and support notices; JEDEC's standards; retailers' and system builders' published return and failure records (hardware.fr for the French retailer LDLC, Puget Systems); recovery labs' and industry associations' published case data and prices; archives' and standards bodies' studies of discs and tape; filings and analysts' figures on shipments; court records; and the restatements of all of these on the pages that rank for drive-lifespan searches, traced to their origin. A few figures are this page's own arithmetic on published numbers (totals by maker summed from Backblaze's model tables, MTBF converted to an annual rate, values read from a study's chart), labelled derived with the method in each record. Official statistics, the trackers' own publications, company filings and transcripts, and peer-reviewed or analyst reports are preferred; vendor surveys and news reports are included only where no better source exists and are labelled as such in the dataset.
How each figure was verified. Every record carries the exact sentence or table cell from the source (the quote) and where it sits (the locator). A researcher confirmed each one against the source document; a script then re-fetched every source on November 4, 2026 and checked for the quote. Records the script could not confirm are kept only if the researcher's check was complete, and are marked for human review in the dataset. Restatements (a later outlet quoting an earlier figure) are recorded as restatements, with the primary figure alongside.
What we excluded. Lifespans with no measurement behind them (they appear only as restatement records, traced); figures whose only source is a roundup, a forum post or a content farm; a copy of a study when the original could be read (a machine-extracted slide copy of a 2017 study is held back until the paper is checked); and any first-party Zinstall data. Where a source gives a figure only in a form we could not confirm (for example, a chart with no data table), the record is marked unverified and is not exported.
Rounding and derivation. Numbers are reproduced as published. Where a tracker publishes two decimals, statements and table cells give one decimal, rounded half up, and the dataset keeps the published value. In the short sentences at the top of the page and of each section, large counts and money amounts may be rounded to two or three significant figures; the exact figure follows in the section's full statements and in the dataset. Derived figures (a change between two months, a share computed from two counts) say so and name their inputs. The bold figure in each statement is a reading aid, not an edit.
Updates. Sources are re-checked and new figures added quarterly, with the monthly tracker series topped up as they are published; the next scheduled refresh is February 2027 (Backblaze's 2026 annual report), then each Backblaze quarterly report. Corrections are welcome through the contact page.
Measures. Each figure is given in its publisher's measure. An annualized failure rate counts failures per drive-year of running time; a replacement rate counts drives replaced, which includes drives pulled before they died; a return rate counts drives sent back to a retailer as faulty; a recovery lab's counts describe only the drives sent to it. MTBF, AFR specifications, TBW and warranties are makers' ratings, not measured lives. Backblaze's drives, and most field studies' drives, run around the clock in data centres.
Cite this page
Zinstall. "How Long Do SSDs and Hard Drives Last? Drive Lifespan and Failure-Rate Statistics." https://www.zinstall.com/research/hard-drive-ssd-lifespan-statistics. Updated 2026-11-04.
Frequently asked questions
How long do hard drives last?
Most last well beyond four years in measured fleets: about 90% of Backblaze's data-centre hard drives were still working at four years and 65% at six, by its December 2021 analysis, and the age at which failures peak rose from about three years in its 2013 data to over ten in 2025. No study has measured home PCs' drives the same way; '3 to 5 years' has no measurement behind it.
How long does an SSD last?
SSD fleets in data centres have failed or been replaced at about 0.2% to 1.2% a year, and almost never because they wore out: in a Google data centre almost 98% of SSD failures came before the drives had used half their rated write cycles. In write-to-death tests, consumer SSDs wrote hundreds of terabytes to petabytes before dying, far past their ratings.
Do SSDs last longer than hard drives?
Where one organisation ran both at the same age, yes. Backblaze's SSD boot drives failed at 0.92% a year in their fifth year of service, against 3.55% for its hard-drive boot drives, and Intel's laptop SSDs failed at 0.61% a year against 4.85% for the laptop hard drives it had used before.
What is a normal hard drive failure rate?
In Backblaze's data centres, 1.36% of hard drives failed in 2025. Older field studies found higher rates: about 3% of drives replaced a year on average at the systems Carnegie Mellon studied in 2007, several times the 0.58% to 0.88% their datasheets implied, and 3.16% across nine Microsoft data centres.
How long does an external hard drive last?
No maker or fleet publishes a failure rate for external drives. Among 3,453 failed external hard drives sent to one US recovery lab from 2023 to 2026, 60.8% had run less than a year; drops, power surges and heat were among the leading causes. Warranties run one to five years.
How long can an SSD keep data without power?
JEDEC's standard requires a consumer SSD at the end of its rated endurance to keep data for a year unpowered at 30 °C, and an enterprise SSD for three months at 40 °C. A new drive keeps data far longer: Crucial says several years. Heat shortens it.
Which hard drive brand is most reliable?
It depends on the model more than the brand. In Backblaze's data centres, Western Digital drives have failed at 0.60% a year over their lifetime to mid-2026 and HGST's at 1.96%, while a 2026 analysis of the same data that held age and capacity constant found HGST failing at about 41% of Seagate's rate.
Does an MTBF of 1.5 million hours mean a drive lasts 171 years?
No. MTBF describes a population: 1.5 million hours means about 0.58% of a large group of drives running around the clock failing each year. Seagate says MTBF ratings do not promise decades of operation, and that the MTBF its drives achieve in the field is typically 50% to 60% of the projected figure.
Sources: Backblaze (2021-2026); USENIX, Proceedings of the 18th USENIX Conference on File and Storage Technologies; USENIX, Proceedings of the 19th USENIX Conference on File and Storage Technologies; ACM / IEEE, Proceedings of the International Conference; The Tech Report; Intel Corporation, on Intel's own fleet and Intel's own SSD product; Carnegie Mellon University; Rutgers University, GoDaddy and Microsoft; Secure Data Recovery Services; JEDEC Solid State Technology Association; Crucial; University of Essex and Sungkyunkwan University; Seagate Technology
Ready to protect your entire computer?
Sources
Every source document behind the figures on this page, listed by publisher. The sources line under each section links each publisher to its document, and the dataset carries the verbatim quote and locator for every statistic.
Show all 453 sources
Loading the list of sources. It is also published as a file: JSON.
guarantee Buy now